

Calibration-free beam hardening correction for myocardial perfusion imaging using CT
- PMID: 30689216
- PMCID: PMC6453761
- DOI: 10.1002/mp.13402
Calibration-free beam hardening correction for myocardial perfusion imaging using CT
Abstract
Purpose: Computed tomography myocardial perfusion imaging (CT-MPI) and coronary CTA have the potential to make CT an ideal noninvasive imaging gatekeeper exam for invasive coronary angiography. However, beam hardening (BH) artifacts prevent accurate blood flow calculation in CT-MPI. BH correction methods require either energy-sensitive CT, not widely available, or typically, a calibration-based method in conventional CT. We propose a calibration-free, automatic BH correction (ABHC) method suitable for CT-MPI and evaluate its ability to reduce BH artifacts in single "static-perfusion" images and to create accurate myocardial blood flow (MBF) in dynamic CT-MPI.
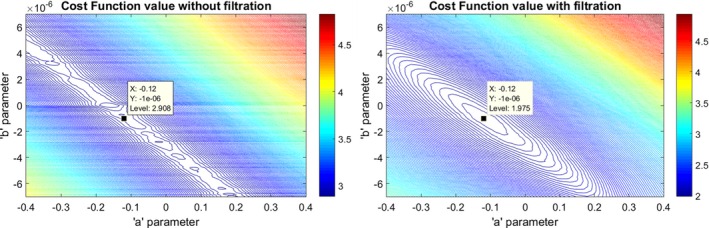
Methods: In the algorithm, we used input CT DICOM images and iteratively optimized parameters in a polynomial BH correction until a BH-sensitive cost function was minimized on output images. An input image was segmented into a soft tissue image and a highly attenuating material (HAM) image containing bones and regions of high iodine concentrations, using mean HU and temporal enhancement properties. We forward projected HAM, corrected projection values according to a polynomial correction, and reconstructed a correction image to obtain the current iteration's BH corrected image. The cost function was sensitive to BH streak artifacts and cupping. We evaluated the algorithm on simulated CT and physical phantom images, and on preclinical porcine with optional coronary obstruction and clinical CT-MPI data. Assessments included measures of BH artifact in single images as well as MBF estimates. We obtained CT images on a prototype spectral detector CT (SDCT, Philips Healthcare) scanner that provided both conventional and virtual keV images, allowing us to quantitatively compare corrected CT images to virtual keV images. To stress test the method, we evaluated results on images from a different scanner (iCT, Philips Healthcare) and different kVp values.
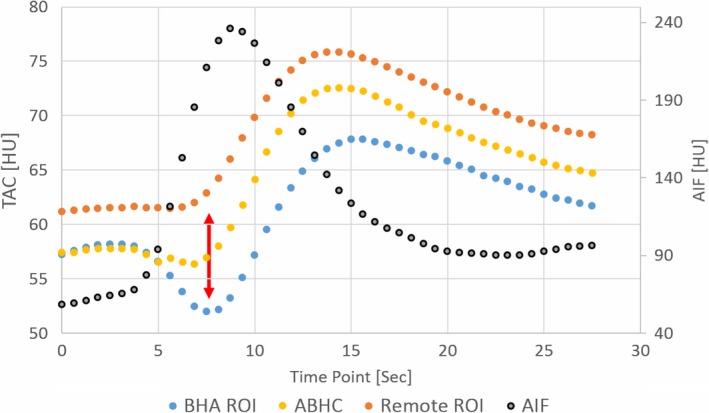
Results: In a CT-simulated digital phantom consisting of water with iodine cylinder insets, BH streak artifacts between simulated iodine inserts were reduced from 13 ± 2 to 0 ± 1 HU. In a similar physical phantom having higher iodine concentrations, BH streak artifacts were reduced from 48 ± 6 to 1 ± 5 HU and cupping was reduced by 86%, from 248 to 23 HU. In preclinical CT-MPI images without coronary obstruction, BH artifact was reduced from 24 ± 6 HU to less than 5 ± 4 HU at peak enhancement. Standard deviation across different regions of interest (ROI) along the myocardium was reduced from 13.26 to 6.86 HU for ABHC, comparing favorably to measurements in the corresponding virtual keV image. Corrections greatly reduced variations in preclinical MBF maps as obtained in normal animals without obstruction (FFR = 1). Coefficients of variations were 22% (conventional CT), 9% (ABHC), and 5% (virtual keV). Moreover, variations in flow tended to be localized after ABHC, giving result which would not be confused with a flow deficit in a coronary vessel territory.
Conclusion: The automated algorithm can be used to reduce BH artifact in conventional CT and improve CT-MPI accuracy particularly by removing regions of reduced estimated flow which might be misinterpreted as flow deficits.
Keywords: CT; MPI-CT; beam hardening correction; cardiovascular imaging; myocardial perfusion.
© 2019 The Authors Medical Physics published by Wiley Periodicals, Inc. on behalf of American Association of Physicists in Medicine.
Figures


Similar articles
-
Comparison of automated beam hardening correction (ABHC) algorithms for myocardial perfusion imaging using computed tomography.Med Phys. 2021 Jan;48(1):287-299. doi: 10.1002/mp.14599. Epub 2020 Dec 7. Med Phys. 2021. PMID: 33206403 Free PMC article.
-
Calibration Free Beam Hardening Correction for Cardiac CT Perfusion Imaging.Proc SPIE Int Soc Opt Eng. 2016 Feb-Mar;9784:97843S. doi: 10.1117/12.2216623. Epub 2016 Mar 21. Proc SPIE Int Soc Opt Eng. 2016. PMID: 33953456 Free PMC article.
-
Quantitative myocardial perfusion imaging in a porcine ischemia model using a prototype spectral detector CT system.Phys Med Biol. 2016 Mar 21;61(6):2407-31. doi: 10.1088/0031-9155/61/6/2407. Epub 2016 Mar 4. Phys Med Biol. 2016. PMID: 26943749 Free PMC article.
-
CT imaging of myocardial perfusion: possibilities and perspectives.J Nucl Cardiol. 2013 Apr;20(2):289-96. doi: 10.1007/s12350-013-9681-7. J Nucl Cardiol. 2013. PMID: 23479267 Review.
-
Dual-Energy CT for Pediatric Thoracic Imaging: A Review.AJR Am J Roentgenol. 2023 Oct;221(4):526-538. doi: 10.2214/AJR.23.29244. Epub 2023 May 17. AJR Am J Roentgenol. 2023. PMID: 37195790 Review.
Cited by
-
Myocardial perfusion assessment in the infarct core and penumbra zones in an in-vivo porcine model of the acute, sub-acute, and chronic infarction.Eur Radiol. 2021 May;31(5):2798-2808. doi: 10.1007/s00330-020-07220-x. Epub 2020 Nov 6. Eur Radiol. 2021. PMID: 33156386
-
Comparison of automated beam hardening correction (ABHC) algorithms for myocardial perfusion imaging using computed tomography.Med Phys. 2021 Jan;48(1):287-299. doi: 10.1002/mp.14599. Epub 2020 Dec 7. Med Phys. 2021. PMID: 33206403 Free PMC article.
-
Reproducibility of a single-volume dynamic CT myocardial blood flow measurement technique: validation in a swine model.Eur Radiol Exp. 2024 Aug 14;8(1):91. doi: 10.1186/s41747-024-00498-2. Eur Radiol Exp. 2024. PMID: 39143412 Free PMC article.
References
-
- So A, Hsieh J, Li JY, Lee TY. Beam hardening correction in CT myocardial perfusion measurement. Phys Med Biol. 2009;54:3031–3050. - PubMed
-
- Joseph PM, Spital RD. A method for correcting bone induced artifacts in computed tomography scanners. J Comput Assist Tomogr. 1978;2:100–108. - PubMed
-
- Ruegsegger P, Hangartner T, Keller HU, Hinderling T. Standardization of computed tomography images by means of a material‐selective beam hardening correction. J Comput Assist Tomogr. 1978;2:184–188. - PubMed
-
- Kijewski PK, Bjärngard BE. Correction for beam hardening in computed tomography. Med Phys. 1978;5:209–214. - PubMed
-
- Nalcioglu O, Lou RY. Post‐reconstruction method for beam hardening in computerised tomography. Phys Med Biol. 1979;24:330–341. - PubMed
