

Spatiotemporal Error in Rainfall Data: Consequences for Epidemiologic Analysis of Waterborne Diseases
- PMID: 30689681
- PMCID: PMC6494670
- DOI: 10.1093/aje/kwz010
Spatiotemporal Error in Rainfall Data: Consequences for Epidemiologic Analysis of Waterborne Diseases
Abstract
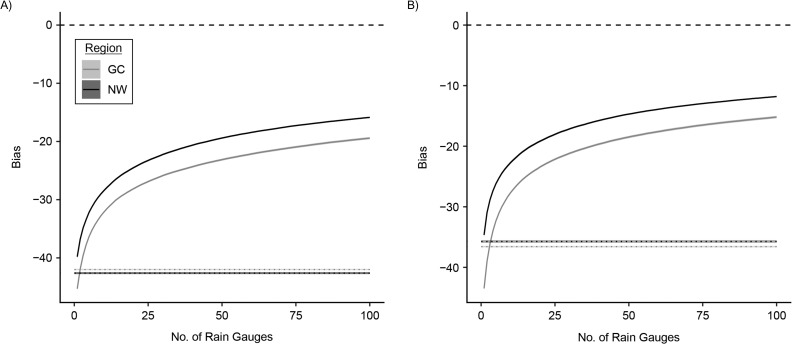
The relationship between rainfall, especially extreme rainfall, and increases in waterborne infectious diseases is widely reported in the literature. Most of this research, however, has not formally considered the impact of exposure measurement error contributed by the limited spatiotemporal fidelity of precipitation data. Here, we evaluate bias in effect estimates associated with exposure misclassification due to precipitation data fidelity, using extreme rainfall as an example. We accomplished this via a simulation study, followed by analysis of extreme rainfall and incident diarrheal disease in an epidemiologic study in Ecuador. We found that the limited fidelity typical of spatiotemporal rainfall data sets biases effect estimates towards the null. Use of spatial interpolations of rain-gauge data or satellite data biased estimated health effects due to extreme rainfall (occurrence) and wet conditions (accumulated totals) downwards by 35%-45%. Similar biases were evident in the Ecuadorian case study analysis, where spatial incompatibility between exposed populations and rain gauges resulted in the association between extreme rainfall and diarrheal disease incidence being approximately halved. These findings suggest that investigators should pay greater attention to limitations in using spatially heterogeneous environmental data sets to assign exposures in epidemiologic research.
Keywords: bias; environmental epidemiology; exposure misclassification; extreme weather; measurement error; precipitation; waterborne diseases.
© The Author(s) 2019. Published by Oxford University Press on behalf of the Johns Hopkins Bloomberg School of Public Health. All rights reserved. For permissions, please e-mail: journals.permissions@oup.com.
Figures


Similar articles
-
Projected local rain events due to climate change and the impacts on waterborne diseases in Vancouver, British Columbia, Canada.Environ Health. 2019 Dec 30;18(1):116. doi: 10.1186/s12940-019-0550-y. Environ Health. 2019. PMID: 31888648 Free PMC article.
-
Analytical studies assessing the association between extreme precipitation or temperature and drinking water-related waterborne infections: a review.Environ Health. 2015 Mar 27;14:29. doi: 10.1186/s12940-015-0014-y. Environ Health. 2015. PMID: 25885050 Free PMC article. Review.
-
Effects of heavy rainfall on waterborne disease hospitalizations among young children in wet and dry areas of New Zealand.Environ Int. 2020 Dec;145:106136. doi: 10.1016/j.envint.2020.106136. Epub 2020 Sep 25. Environ Int. 2020. PMID: 32987220
-
Effect of rain gauge density over the accuracy of rainfall: a case study over Bangalore, India.Springerplus. 2013 Jul 11;2(1):311. doi: 10.1186/2193-1801-2-311. Print 2013 Dec. Springerplus. 2013. PMID: 23888280 Free PMC article.
-
Understanding the Impact of Rainfall on Diarrhea: Testing the Concentration-Dilution Hypothesis Using a Systematic Review and Meta-Analysis.Environ Health Perspect. 2020 Dec;128(12):126001. doi: 10.1289/EHP6181. Epub 2020 Dec 7. Environ Health Perspect. 2020. PMID: 33284047 Free PMC article.
Cited by
-
Heavy weather events, water quality and gastroenteritis in Norway.One Health. 2021 Aug 4;13:100297. doi: 10.1016/j.onehlt.2021.100297. eCollection 2021 Dec. One Health. 2021. PMID: 34401456 Free PMC article.
-
The Association Between Rainfall, Temperature, and Reported Drinking Water Source: A Multi-Country Analysis.Geohealth. 2022 Nov 1;6(11):e2022GH000605. doi: 10.1029/2022GH000605. eCollection 2022 Nov. Geohealth. 2022. PMID: 36381499 Free PMC article.
-
Heavy Rainfall Events and Diarrheal Diseases: The Role of Urban-Rural Geography.Am J Trop Med Hyg. 2020 Sep;103(3):1043-1049. doi: 10.4269/ajtmh.19-0768. Am J Trop Med Hyg. 2020. PMID: 32700663 Free PMC article.
-
Combined Sewer Overflows and Gastrointestinal Illness in Atlanta, 2002-2013: Evaluating the Impact of Infrastructure Improvements.Environ Health Perspect. 2022 May;130(5):57009. doi: 10.1289/EHP10399. Epub 2022 May 17. Environ Health Perspect. 2022. PMID: 35580035 Free PMC article.
-
Rainfall events and daily mortality across 645 global locations: two stage time series analysis.BMJ. 2024 Oct 9;387:e080944. doi: 10.1136/bmj-2024-080944. BMJ. 2024. PMID: 39384295 Free PMC article.
