. 2019 Feb 20;70(4):1375-1388.
doi: 10.1093/jxb/ery457.

The Arabidopsis AMOT1/EIN3 gene plays an important role in the amelioration of ammonium toxicity

Affiliations

The Arabidopsis AMOT1/EIN3 gene plays an important role in the amelioration of ammonium toxicity

Guangjie Li et al. J Exp Bot. .

Abstract

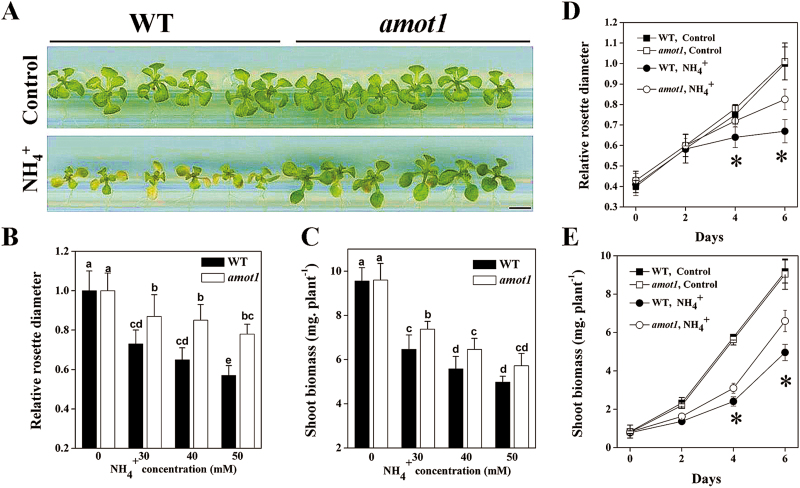
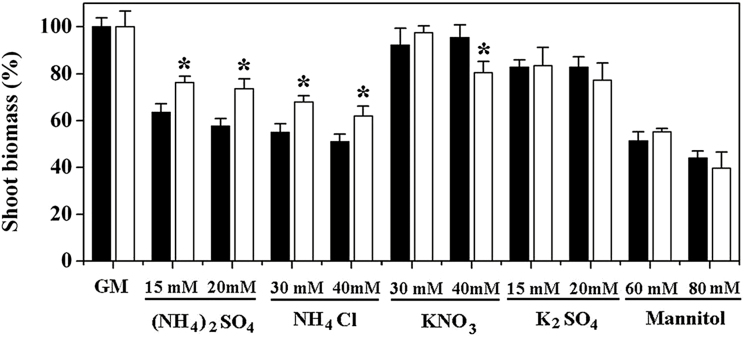
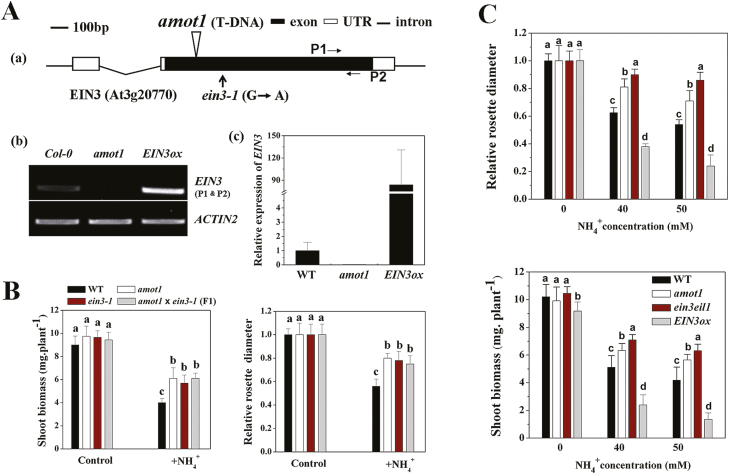
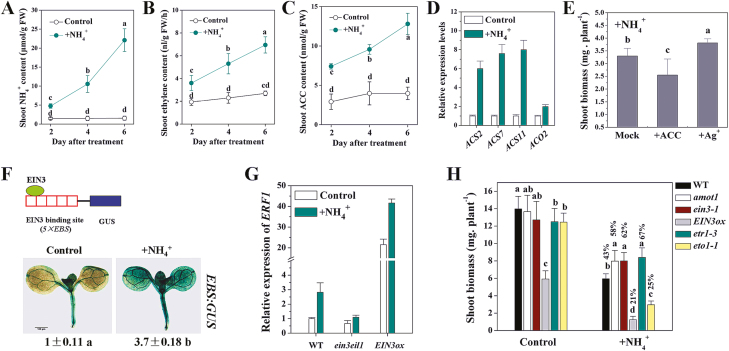
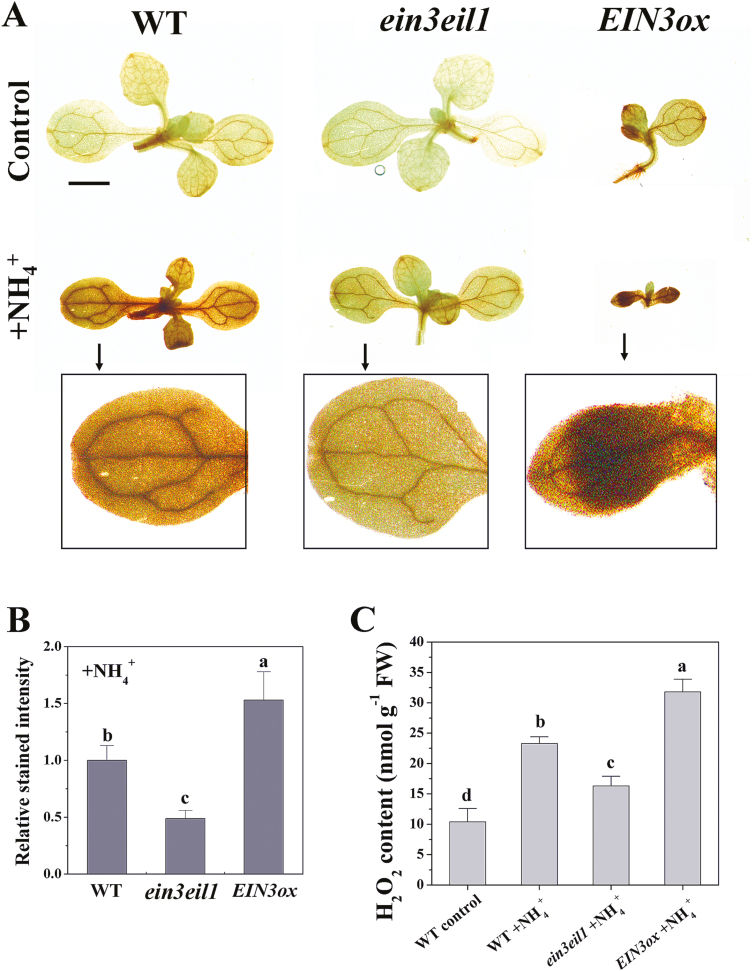
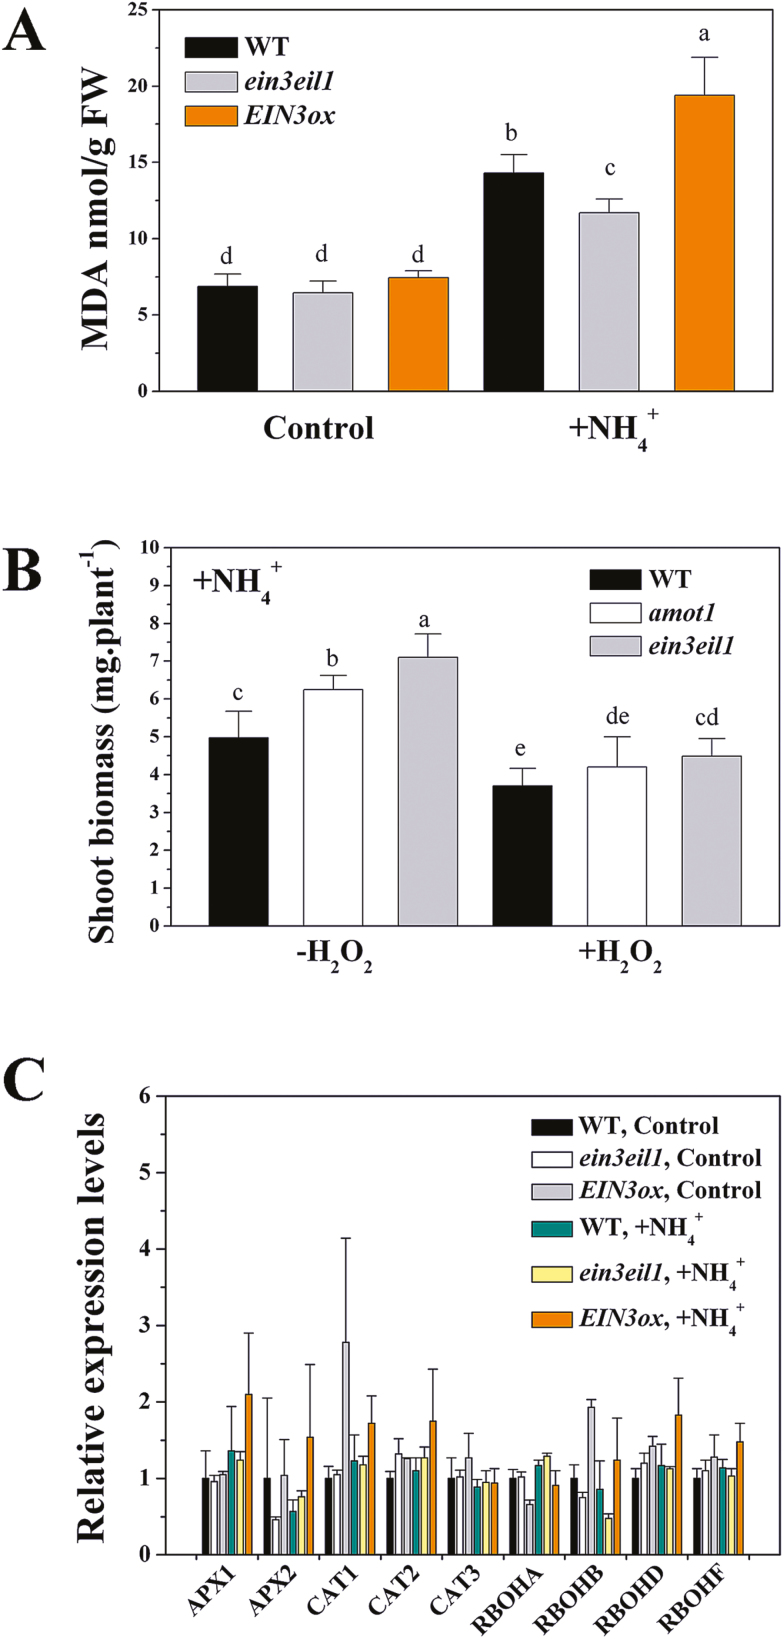
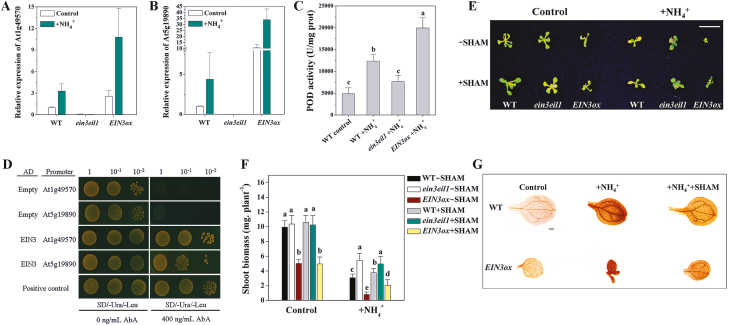
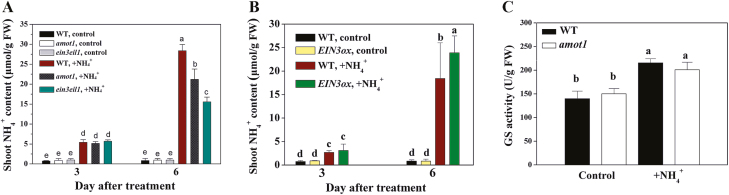
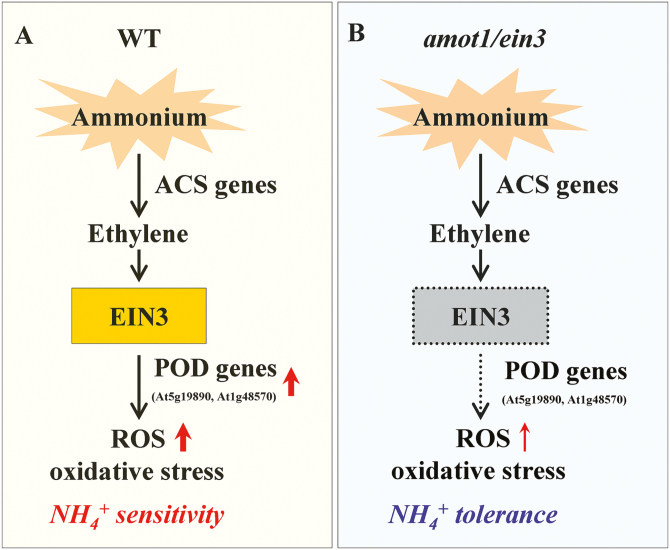
Ammonium (NH4+) toxicity inhibits shoot growth in Arabidopsis, but the underlying mechanisms remain poorly characterized. Here, we show that a novel Arabidopsis mutant, ammonium tolerance 1 (amot1), exhibits enhanced shoot growth tolerance to NH4+. Molecular cloning revealed that amot1 is a new allele of EIN3, a key regulator of ethylene responses. The amot1 mutant and the allelic ein3-1 mutants show greater NH4+ tolerance than the wild type. Moreover, transgenic plants overexpressing EIN3 (EIN3ox) are more sensitive to NH4+ toxicity The ethylene precursor 1-aminocyclopropane-1-carboxylic acid (ACC) increases shoot sensitivity to NH4+, whereas the ethylene perception inhibitor Ag+ decreases sensitivity. NH4+ induces ACC and ethylene accumulation. Furthermore, ethylene-insensitive mutants such as etr1-3 and ein3eil1 display enhanced NH4+ tolerance. In contrast, the ethylene overproduction mutant eto1-1 exhibits decreased ammonium tolerance. AMOT1/EIN3 positively regulates shoot ROS accumulation, leading to oxidative stress under NH4+ stress, a trait that may be related to increased expression of peroxidase-encoding genes. These findings demonstrate the role of AMOT1/EIN3 in NH4+ tolerance and confirm the strong link between NH4+ toxicity symptoms and the accumulation of hydrogen peroxide.

Keywords: amot1 mutant; AMOT1/EIN3; Ammonium stress; Arabidopsis; H2O2; peroxidases.


Figures

Fig. 1.
Fig. 1.
Isolation and characterization of the ammonium-tolerant amot1 mutant. (A) Appearance of Arabidopsis thaliana wild-type (WT) and amot1 mutant plants following treatment with NH4+. Five-day-old plants were transferred to control and 40 mM NH4+ concentration for 6 d, and then pictures were taken. Scale bars=0.5 cm. (B and C) Relative rosette diameter and fresh shoot weight of A. thaliana WT and amot1 mutant plants following treatment with various NH4+ concentrations for 6 d. The rosette diameter on control nutrient solution was considered as 1. Values are the means ±SD, n=8–11. Different letters indicate statistical differences at P<0.05 (one-way ANOVA with Duncan post-hoc test). (D and E) Relative rosette diameter and fresh shoot weight of A. thaliana WT and amot1 mutant plants following treatment with 40 mM NH4+ for 0, 2, 4, and 6 d. Values are the means ±SD, n=6–10. Asterisks indicate statistical differences between the WT and amot1 under NH4+ treatment at the indicated times (independent samples t-test, *P<0.05). (This figure is available in color at JXB online.)
Fig. 2.
Fig. 2.
Specificity of the amot1 mutant to NH4+. WT and amot1 seedlings were grown for 5 d on growth medium (GM) and then transferred to medium supplemented with salts and osmotica as indicated. Shoot fresh weight was measured 6 d after transfer. Growth on control nutrient (GM) was considered as 100%. Values are the means ±SD, n=10–14. Asterisks indicate statistical differences between the mutant and WT (independent samples t-test, *P<0.05).
Fig. 3.
Fig. 3.
Molecular characterization of the Arabidopsis thaliana amot1 mutant. (A) (a) Diagram illustrating the genomic coding sequence of the Arabidopsis AMOT1/EIN3 gene and the locations of the mutant alleles amot1 and ein3-1. UTR, untranslated region. (b) RT-PCR analysis of EIN3 transcripts in WT, EIN3ox, and the amot1 mutant plants. The ACTIN2 gene was used as an internal control. (c) Expression of EIN3 in WT, EIN3ox, and the amot1 mutant plants analyzed by qRT-PCR analysis. Values are means ±SD of three replicates. ACTIN2 was used as the internal reference gene, and EIN3 expression of the WT was considered as 1. (B) amot1 is allelic to the ein3-1 mutant. WT, amot1, ein3-1, and F1 progeny from crosses between amot1 and ein3-1 were grown on 40 mM NH4+ for 6 d. The relative rosette diameter on control nutrient solution was considered as 1. Values are the means ±SD, n=7–12. (C) Effect of various NH4+ concentrations on relative rosette diameter, and fresh shoot weight of WT, ein3eil1, amot1, and EIN3ox seedlings. Five-day-old plants were transferred to control and 40 mM NH4+ concentration for 6 d. Values are the means ±SD, n=5–8. Different letters indicate statistical differences at P<0.05 (one-way ANOVA analysis with Duncan post-hoc test). (This figure is available in color at JXB online.)
Fig. 4.
Fig. 4.
Effects of ethylene on shoot growth tolerance to NH4+. (A) NH4+ content in Arabidopsis shoots for the duration of the NH4+ treatment. (B) Ethylene evolution in Arabidopsis shoots for the duration of the NH4+ treatment. (C) 1-Aminocyclopropane-1-carboxylic acid (ACC) content in Arabidopsis shoots for the duration of the NH4+ treatment. Seedlings at 5 d after germination were exposed to NH4+ for varying treatment times, and NH4+ content (A), ethylene evolution (B), and ACC content were determined. Values are means ±SD of three replicates. Different letters indicate statistical differences at P<0.05 (one-way ANOVA with Duncan post-hoc test). (D) Effect of NH4+ treatment on shoot ACS and ACO genes expression by qRT-PCR for 6 h. Values are means ±SD of three replicates. CBP20 was used as the internal reference gene, and the control was considered as 1. (E) Effect of supplied ethylene inhibitors 30 μM AgNO3 and 25 μM ACC on shoot biomass of WT seedlings grown in 40 mM NH4+ treatment medium. Values are the means ±SD, n=10–12. (F) Schematic diagram of the EIN3 activity reporter system showing the EIN3 protein, five tandem repeats of the EBS (5×EBS), and the GUS gene. Expression of 5×EBS:GUS in leaves of the WT under control conditions and 24 h NH4+ treatment. One representative sample from each treatment (10 plants) is shown. GUS staining intensity was quantified using Image J software, and the control was considered as 1. Values are means ±SD of three replicates. (G) Effect of NH4+ treatment on shoot ERF1 gene expression of WT, ein3eil1, and EIN3ox lines by qRT-PCR for 6 h. Values are means ±SD of three replicates. ACTIN2 was used as the internal reference gene, and the WT control was considered as 1. (H) Effect of NH4+ treatment for 6 d on shoot fresh weight of WT, amot1, ein3-1, EIN3ox, etr1-3, and eto1-1 seedlings. Values are the means ±SD, n=12. Different letters indicate statistical differences at P<0.05 of control and NH4+ treatment, respectively (one-way ANOVA with Duncan post-hoc test).
Fig. 5.
Fig. 5.
Effects of EIN3 on NH4+-induced H2O2 accumulation in shoots. (A) In situ detection of WT, ein3eil1, and EIN3ox leaf H2O2. Seedlings at 5 d were exposed to 40 mM NH4+ for 3 d, and then DAB staining of shoots was performed. Scale bars=1 mm. The inserts show images of partial enlargement, as indicated by arrows. (B) The mean relative DAB staining intensity in the WT, ein3eil1, and EIN3ox of the NH4+-treated shoots in (A), and the WT was considered as 1. Values are the means ±SD, n=10–15. (C) H2O2 concentration in the WT, EIN3ox, and ein3eil1 shoot tissue. Seedlings at 5 d were exposed to 40 mM NH4+ for 3 d, and the contents of H2O2 were determined as described in the Materials and methods. Values are means ±SD of three replicates. Different letters indicate statistical differences at P<0.05 (one-way ANOVA with Duncan post-hoc test).
Fig. 6.
Fig. 6.
Effects of EIN3 on NH4+-induced lipid peroxidation in shoots and related gene expression. (A) Lipid peroxidation (MDA content) in the WT, ein3eil1, and EIN3ox shoot tissue. Seedlings at 5 d were exposed to 40 mM NH4+ for 6 d. Values are means ±SD of three replicates. (B) Effect of external H2O2 on shoot biomass of WT, ein3eil1, and amot1 plants under NH4+ treatment. Five-day-old seedlings were transferred to medium supplemented with NH4+ alone or in combination with 2 mM H2O2 for 6 d. n=7–10. (C) Effect of NH4+ on gene expression of WT, EIN3ox, and ein3eil1 shoot tissue by qRT-PCR for 6 h. Values are means ±SD of three replicates. ACTIN2 was used as the internal reference gene, and the WT control was considered as 1. Different letters indicate statistical differences at P<0.05 (one-way ANOVA with Duncan post-hoc test).
Fig. 7.
Fig. 7.
EIN3 increases activity of PODs through transcriptional regulation of POD genes. (A and B) qRT-PCR analysis of the expression of two POD genes (At5g19890 and At1g48570) in WT, EIN3ox, and ein3eil1 shoot tissue after NH4+ treatment for 6 h. Values are means ±SD of three replicates. ACTIN2 was used as the internal reference gene, and the WT control was considered as 1. (C) Measurement of POD activity of WT, EIN3ox, and ein3eil1 shoot tissue. Seedlings were exposed to 40 mM NH4+ for 5 d. Values are means ±SD of three replicates. (D) Y1H assay showing the EIN3 binding to the promoter of the two POD genes. The yeast expression plasmid pGADT7-EIN3 was reintroduced into the yeast strain Y1H Gold carrying the pAbAi-At1g49570 or pAbAi-At5g19890 vectors. The transformants (with or without dilutions) were screened for their growth on yeast synthetic defined medium (SD/-Ura -Leu) in the presence of 400 ng ml–1 AbA (antibiotic) for stringent selection. The empty vectors pGADT7 and p53-AbAi/pGAD-p53 were used as a negative and positive control, respectively. (E and F) Effect of salicylhydroxamic acid (SHAM) on the shoot biomass of the WT, EIN3ox, and ein3eil1. Five-day-old seedlings were transferred to medium alone or in combination with 10 μM SHAM for 6 d. A photograph of representative seedlings is shown in (E). Scale bars=1 cm. The shoot biomass is shown in (F). Values are the means ±SD, n=12. Different letters indicate statistical differences at P<0.05 of control and NH4+ treatment, respectively (one-way ANOVA with Duncan post-hoc test). (G) Effect of SHAM on the NH4+-induced H2O2 accumulation in shoots of WT and EIN3ox. Seedlings at 5 d were exposed to 40 mM NH4+ with or without 10 μM SHAM for 3 d, and then DAB staining of shoots was performed. Scale bars=200 μm.
Fig. 8.
Fig. 8.
Effects of NH4+ treatment on shoot NH4+ content and GS activity. (A) NH4+ contents in the shoot tissues of WT, ein3eil1, and amot1 seedlings. Five-day-old WT, ein3eil1, and amot1 seedlings were grown on growth medium and transferred to fresh medium with control or NH4+ for 3 d and 6 d of growth, and then NH4+ tissue content was determined. Values are means ±SD of three replicates. (B) NH4+ contents in the shoot tissues of WT and EIN3ox seedlings. Five-day-old WT and EIN3ox seedlings were grown on growth medium and transferred to fresh medium with control or NH4+ for 3 d and 6 d of growth, and then NH4+ tissue content was determined. Values are means ±SD of three replicates. (C) GS activities in the shoots of WT and amot1 seedlings. Five-day-old WT and amot1 seedlings were grown on growth medium and transferred to fresh medium with control or NH4+ for 6 d, and then GS activity was determined. Values are means ±SD of three replicates. Different letters indicate statistical differences at P<0.05 (one-way ANOVA with Duncan post-hoc test).
Fig. 9.
Fig. 9.
A proposed model for ethylene–EIN3 function in shoot NH4+ sensitivity. Based on our study and previous reports (Chao et al., 1997; G. Li et al., 2013; Podgorska et al., 2013, 2015), we established a model for ethylene–EIN3 function in shoot NH4+ sensitivity. (A) In the wild type, NH4+ stress enhanced the expression of ACS and ACO genes, encoding ACS and ACO, the two key enzymes responsible for ethylene synthesis. Under NH4+ stress, ethylene is perceived and transduced, affecting the transcription factor EIN3, and initiating the ethylene response. EIN3 regulates ROS accumulation, which leads to oxidative stress in Arabidopsis shoots under NH4+ stress. The expression of EIN3-mediated POD genes (e.g. At5g19890 and At1g48570) is involved in NH4+ stress-induced shoot ROS accumulation. (B) In the amot1/ein3 mutant, expression of the AMOT1/EIN3-dependent POD genes (e.g. At5g19890 and At1g48570) in the shoot is blocked under NH4+ stress. Ethylene regulation of ROS accumulation and oxidative stress is lowered. Orthogons in orange represent known EIN3 functions, and orthogons in gray with dashed lines represent the inhibition of EIN3 functions due to the amot1/ein3 mutation. Red arrows indicate increased POD gene expression, ROS accumulation, and oxidative stress, and thick and thin red arrows indicate, respectively, a high or low ROS accumulation and oxidative stress.

Similar articles

Cited by

References

    1. Adams DO, Yang SF. 1979. Ethylene biosynthesis: identification of 1-aminocyclopropane 1-carboxylic acid as an intermediate in the conversion of methionine to ethylene. Proceedings of the National Academy of Sciences, USA 76, 170–174. - PMC - PubMed
    1. Alonso JM, Stepanova AN. 2004. The ethylene signaling pathway. Science 306, 1513–1515. - PubMed
    1. Alonso JM, Stepanova AN, Solano R, Wisman E, Ferrari S, Ausubel FM, Ecker JR. 2003. Five components of the ethylene-response pathway identified in a screen for weak ethylene-insensitive mutants in Arabidopsis. Proceedings of the National Academy of Sciences, USA 100, 2992–2997. - PMC - PubMed
    1. An F, Zhao Q, Ji Y, et al. . 2010. Ethylene-induced stabilization of ETHYLENE INSENSITIVE3 and EIN3-LIKE1 is mediated by proteasomal degradation of EIN3 binding F-box 1 and 2 that requires EIN2 in Arabidopsis. The Plant Cell 22, 2384–2401. - PMC - PubMed
    1. Apel K, Hirt H. 2004. Reactive oxygen species: metabolism, oxidative stress, and signal transduction. Annual Review of Plant Biology 55, 373–399. - PubMed

Publication types

MeSH terms