

Earliest Evidence of Preclinical Diabetic Retinopathy Revealed Using Optical Coherence Tomography Angiography Perfused Capillary Density
- PMID: 30689991
- PMCID: PMC6612596
- DOI: 10.1016/j.ajo.2019.01.012
Earliest Evidence of Preclinical Diabetic Retinopathy Revealed Using Optical Coherence Tomography Angiography Perfused Capillary Density
Abstract
Purpose: To compare perfused capillary density (PCD) in diabetic patients and healthy controls using optical coherence tomography angiography (OCTA).
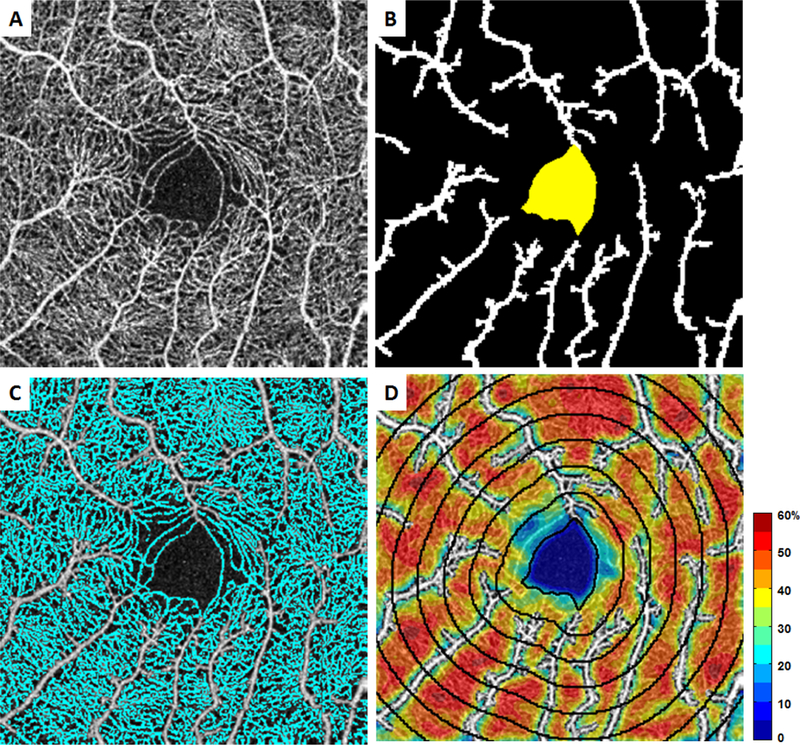
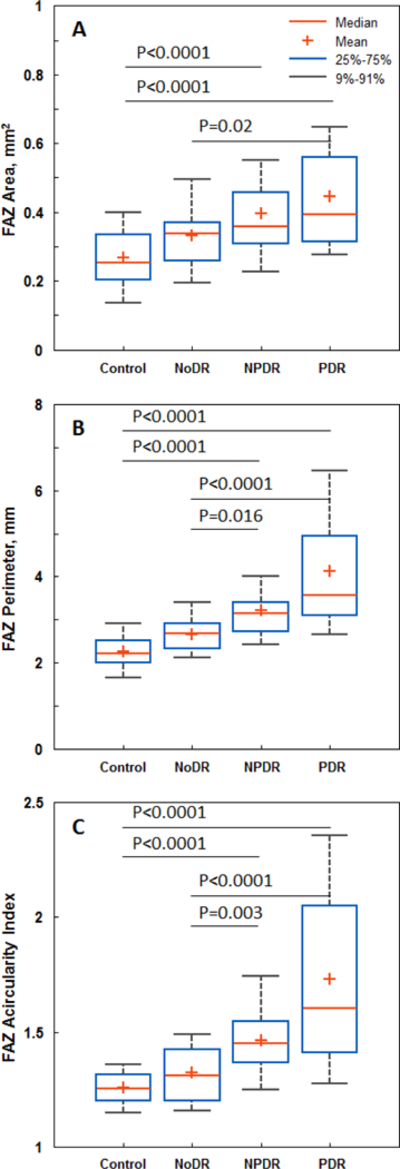
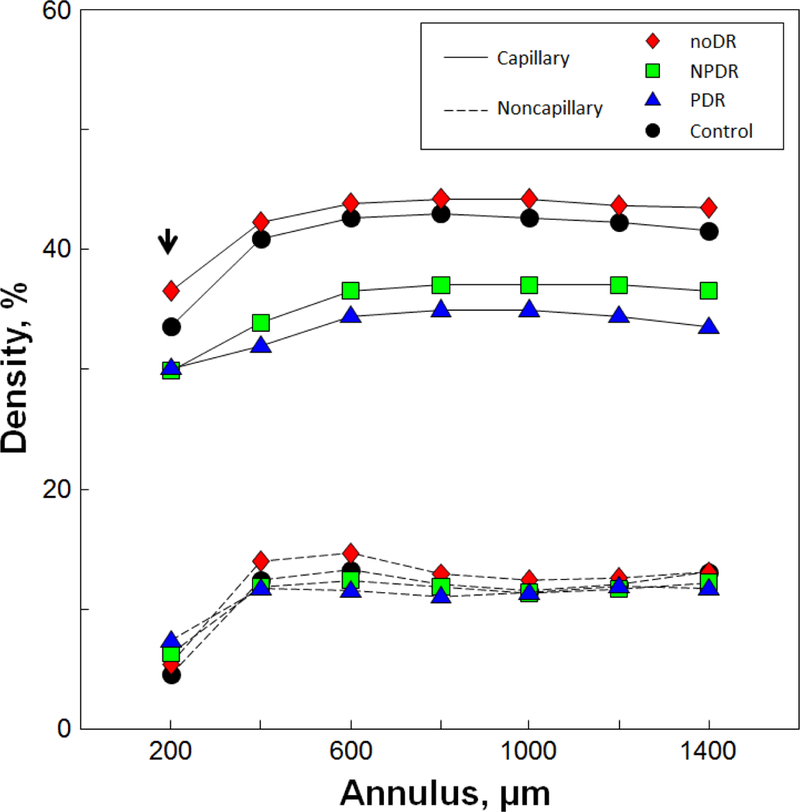
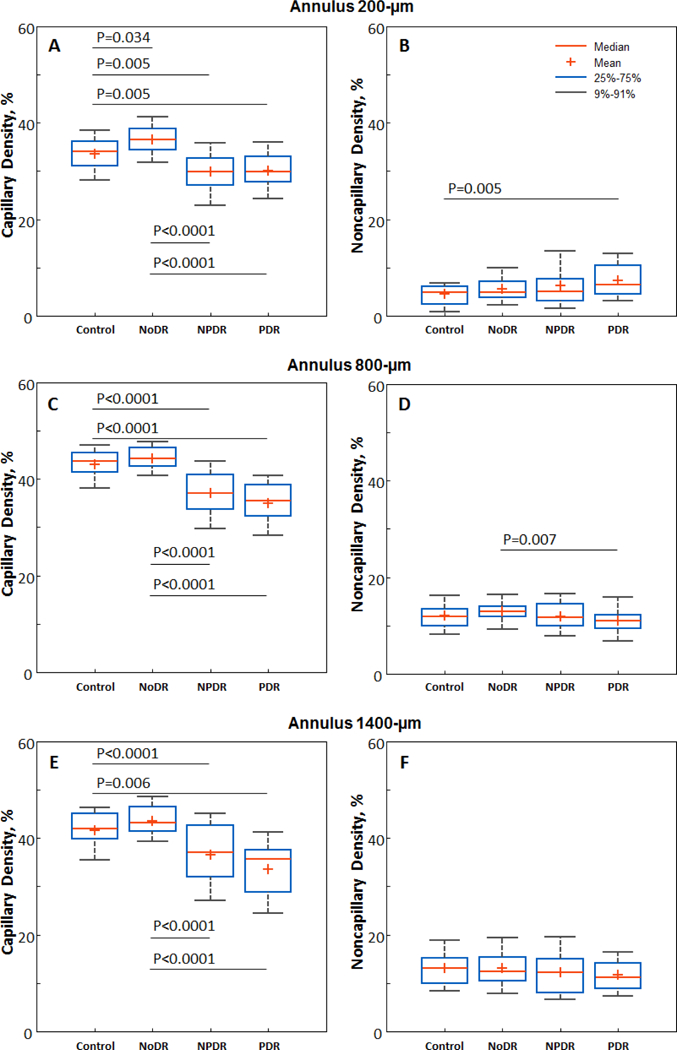
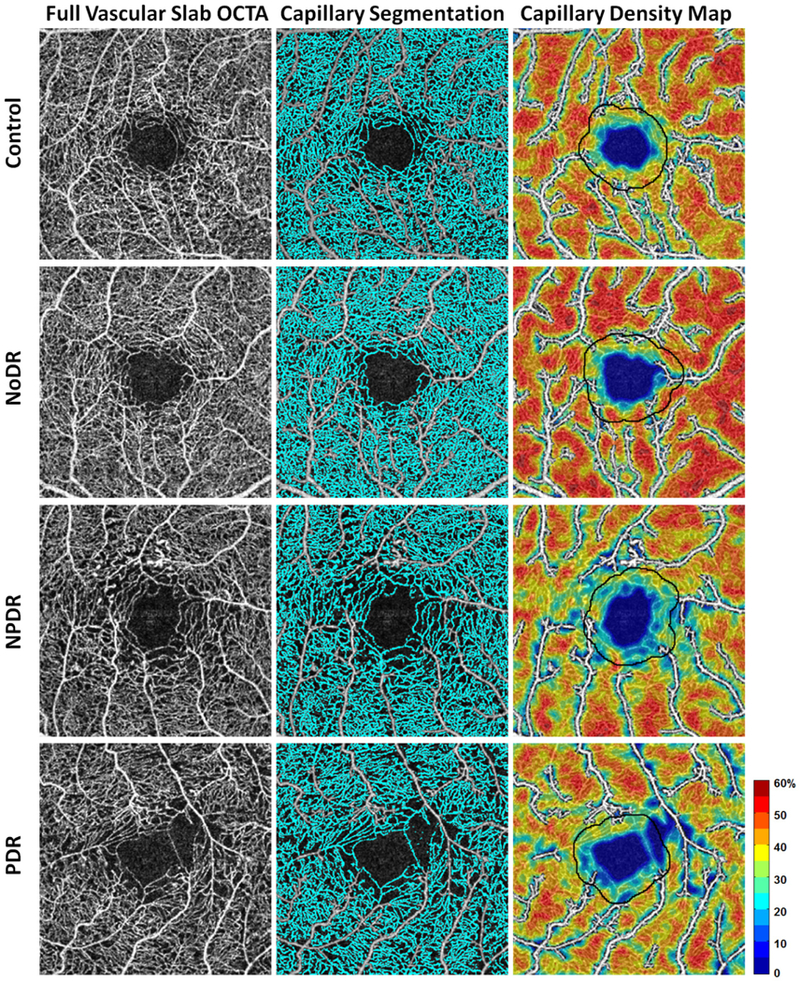
Methods: Forty controls, 36 diabetic subjects without clinical retinopathy (NoDR), 38 with nonproliferative retinopathy (NPDR), and 38 with proliferative retinopathy (PDR) were imaged using spectral-domain optical coherence tomography. A 3 × 3-mm full-thickness parafoveal OCTA scan was obtained from each participant. Following manual delineation of the foveal avascular zone (FAZ), FAZ area, perimeter, and acircularity index were determined. Seven consecutive equidistant 200-μm-wide annular segments were drawn at increasing eccentricities from the FAZ margin. Annular PCD (%) was defined as perfused capillary area divided by the corresponding annulus area after subtraction of noncapillary blood vessel areas. Nonparametric Kruskal-Wallis testing with Bonferroni correction was performed in pairwise comparisons of group PCD values.
Results: The NoDR group demonstrated consistently higher PCD compared to the control group in all 7 annuli, reaching statistical significance (36.6% ± 3.30% vs 33.6% ± 3.98%, P = .034) at the innermost annulus (FAZ margin to 200 μm out). The NPDR and PDR groups demonstrated progressively decreasing PCD. Differences in FAZ metrics between the NoDR and control groups did not reach statistical significance.
Conclusions: Relative to healthy controls, increased PCD values in the NoDR group likely represent an autoregulatory response to increased metabolic demand, while the decrease in PCD that follows in NPDR and PDR results largely from an incremental loss of capillary segments. These findings, consistent with previous studies, demonstrate the potential of OCTA as a clinical tool for earlier objective detection of preclinical diabetic retinopathy. NOTE: Publication of this article is sponsored by the American Ophthalmological Society.
Copyright © 2019. Published by Elsevier Inc.
Figures
References
-
- Ogurtsova K, da Rocha Fernandes JD, Huang Y, et al. IDF Diabetes Atlas: Global estimates for the prevalence of diabetes for 2015 and 2040. Diabetes Res Clin Pract June 2017;128:40–50. - PubMed
-
- Bourne RR, Stevens GA, White RA, et al. Causes of vision loss worldwide, 1990–2010: a systematic analysis. Lancet Glob Health December 2013;1(6):e339–349. - PubMed
-
- Maffi P, Secchi A. The Burden of Diabetes: Emerging Data. Dev Ophthalmol 2017;60:1–5. - PubMed
Publication types
MeSH terms
Grants and funding
LinkOut - more resources
Full Text Sources
Medical
