. 2019 Jan 25;19(3):499.
doi: 10.3390/s19030499.

Single-Trial Cognitive Stress Classification Using Portable Wireless Electroencephalography

Affiliations

Single-Trial Cognitive Stress Classification Using Portable Wireless Electroencephalography

Justin A Blanco et al. Sensors (Basel). .

Abstract

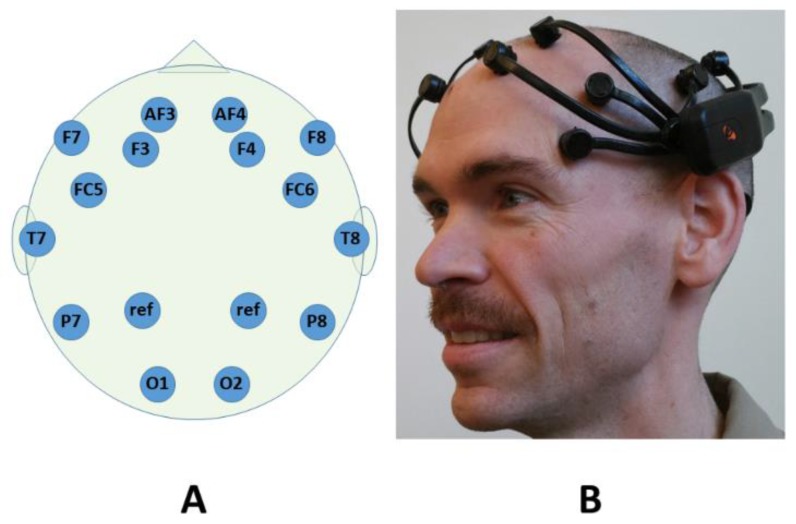
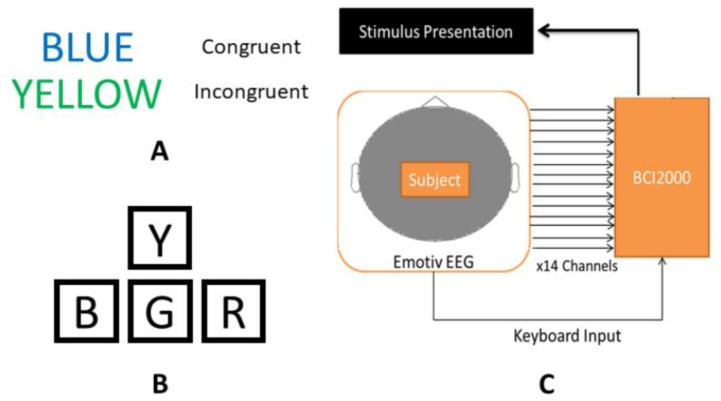
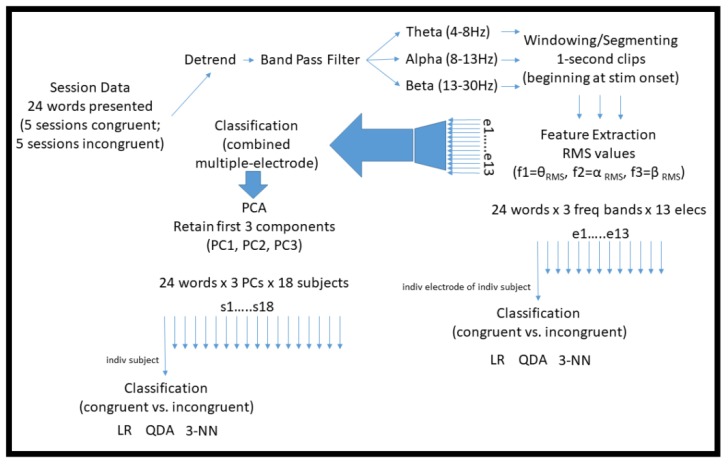
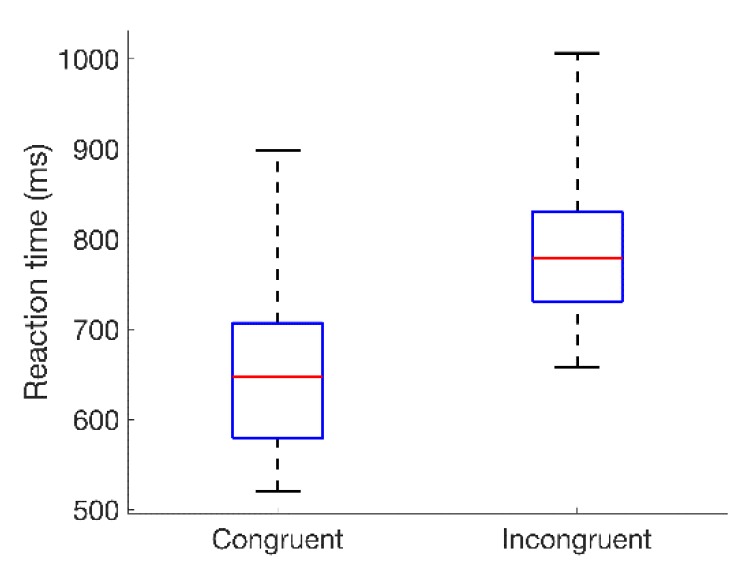
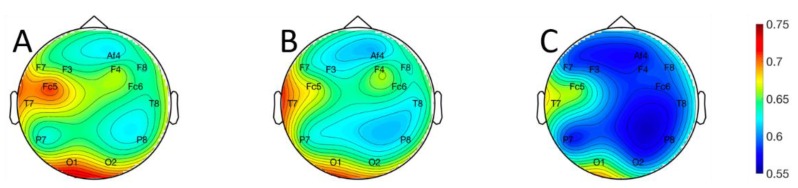
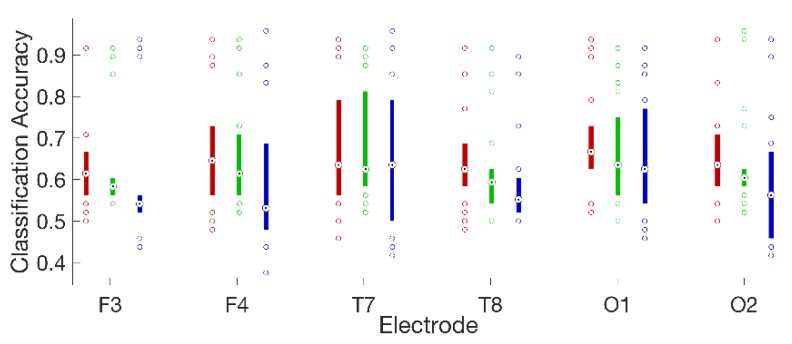
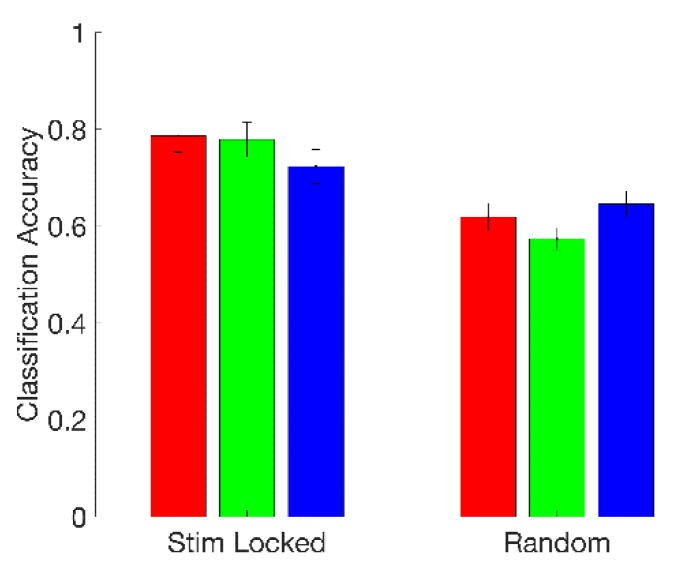
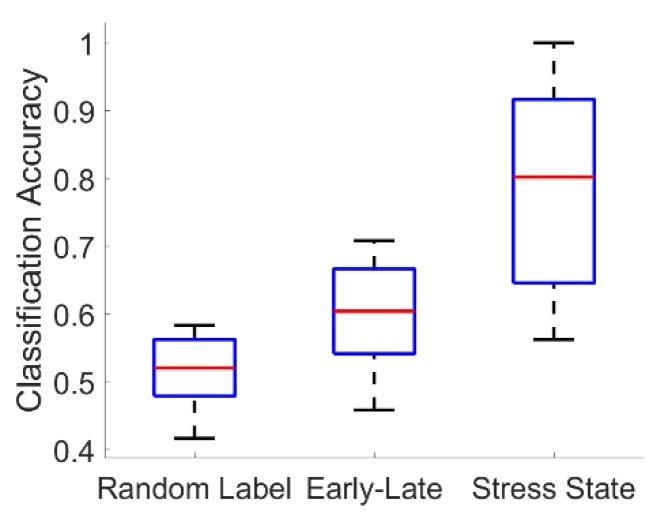
This work used a low-cost wireless electroencephalography (EEG) headset to quantify the human response to different cognitive stress states on a single-trial basis. We used a Stroop-type color⁻word interference test to elicit mild stress responses in 18 subjects while recording scalp EEG. Signals recorded from thirteen scalp locations were analyzed using an algorithm that computes the root mean square voltages in the theta (4⁻8 Hz), alpha (8⁻13 Hz), and beta (13⁻30 Hz) bands immediately following the initiation of Stroop stimuli; the mean of the Teager energy in each of these three bands; and the wideband EEG signal line-length and number of peaks. These computational features were extracted from the EEG signals on thirteen electrodes during each stimulus presentation and used as inputs to logistic regression, quadratic discriminant analysis, and k-nearest neighbor classifiers. Two complementary analysis methodologies indicated classification accuracies over subjects of around 80% on a balanced dataset for the logistic regression classifier when information from all electrodes was taken into account simultaneously. Additionally, we found evidence that stress responses were preferentially time-locked to stimulus presentation, and that certain electrode⁻feature combinations worked broadly well across subjects to distinguish stress states.

Keywords: Biomedical signal processing; Brain–computer interface; Cognitive stress; Electroencephalography; Stroop test.


Conflict of interest statement

The authors declare no conflict of interest. The funders had no role in the design of the study; in the collection, analyses, or interpretation of data; in the writing of the manuscript, or in the decision to publish the results.

Figures

Figure 1
Figure 1
Scalp electrode locations (A) covered by the Emotiv Epoc system; and the Emotiv Epoc system as it would be worn by a subject (B). The electrode labeling convention follows the Modified Combinatorial 10–20 Standard [24].
Figure 2
Figure 2
Experimental design components: examples of congruent and incongruent Stroop color–word stimuli (A); schematic of modified arrow keys on a standard keyboard, used to record subject responses to Stroop stimuli (B); and diagram of the hardware and software configuration used for data collection (C).
Figure 3
Figure 3
Diagram illustrating the main computational techniques used to pre-process and classify the raw EEG data in the initial analysis methodology described in Section 2.2.1, Section 2.2.2, Section 2.2.3, Section 2.2.4, Section 2.2.5 and Section 2.2.6.
Figure 4
Figure 4
Box-and-whisker plots summarizing the distributions of reaction times for all 18 subjects to congruent and incongruent color–word stimuli. Values represented are median (across sessions) average reaction times relative to the onset of the color–word stimulus, with averages taken across the 24-word presentations in each session. Red lines indicate the medians of each distribution; blue boxes span the first to third quartiles; and whiskers extend to the extreme values.
Figure 5
Figure 5
Topographical plots of classification performance averaged across all 18 subjects for the: (A) logistic regression; (B) quadratic discriminant analysis; and (C) three-nearest neighbor classifiers. Values represented by the color maps are the proportion of correctly labeled examples. Values at non-electrode locations were obtained via biharmonic spline interpolation [33]. The electrode labeling convention follows the Modified Combinatorial 10–20 Standard [24].
Figure 6
Figure 6
Box plots summarizing the distributions of classification accuracies across all 18 subjects for the logistic regression (red); quadratic discriminant analysis (green); and three-nearest neighbor classifiers (blue), on three laterally symmetric pairs of frontal (F3 and F4), temporal (T7 and T8), and occipital (O1 and O2) electrodes. Medians are shown as black dots inside colored circles and boxes span the interquartile range. Values falling outside the interquartile range are plotted as unfilled circles to explicitly show the number of subjects at the extremes of each distribution.
Figure 7
Figure 7
Fused-feature classification mean accuracy across subjects for logistic regression (red), quadratic discriminant analysis (green), and 3-NN (blue), when 1-s feature extraction windows were triggered by the onset of the color–word stimulus (“Stim Locked”) and when 1-s feature extraction windows were taken at random times (“Random”). Error bars are two standard errors in length.
Figure 8
Figure 8
Summary of representative fused-feature classification results. Boxplots show the distribution of classifier accuracies across all 18 subjects for a chance logistic regression classifier formed by randomly permuting the congruent and incongruent labels (“Random Label”); a null logistic regression classifier formed by training to discriminate early versus late segments in congruent experimental sessions (“Early-Late”); and the actual logistic regression stress-state classifier trained to discriminate congruent from incongruent segments (“Stress State”).
Figure 9
Figure 9
First principal component loadings. Visualization of the average first principal component loadings for nine randomly selected subjects (one subject per row). Each row consists of 39 colored panels, one for each of the 39 electrode–RMS feature combinations used for classification. The panels are colored in proportion to the contribution of their corresponding feature to the first principal component; they are ordered in three blocks of 13 corresponding to the 13 analyzed electrodes, with the leftmost block representing the theta RMS feature, the middle block representing the alpha RMS feature, and the rightmost block representing the beta RMS feature. Within each block, the electrode ordering is as follows: F7, F3, Fc5, T7, P7, O1, O2, P8, T8, Fc6, F4, F8, and Af4. For example, the leftmost panel in all rows represents θ RMS on electrode F7 and the rightmost panel β RMS on Af4. Lighter color panels indicate electrode–RMS feature combinations with stronger positive weightings. The orange arrow indicates one particular combination that has relatively high-magnitude weight across subjects; the black arrow indicates one with relatively low-magnitude weight.
Figure 10
Figure 10
Histograms showing the distributions of RMS voltage across trials (color–word stimulus presentations) in one congruent (grey hatched) and one incongruent (white) experimental session pair, for one electrode–RMS feature combination that shows relatively good class separation (A) and one that shows relatively poor class separation (B). The electrode–RMS feature combinations illustrated in (A,B) correspond to the orange and black arrows, respectively, in Figure 9. Data in (A,B) are from two different subjects. Outliers in both panels are trimmed to avoid scaling issues that hamper visualization.

References

    1. Renaud P., Blondin J.P. The stress of Stroop performance: Physiological and emotional responses to color-word interference, task pacing, and pacing speed. J. Psychophysiol. 1997;27:87–97. doi: 10.1016/S0167-8760(97)00049-4. - DOI - PubMed
    1. Sichel J.L., Chandler K.A. The color-word interference test: The effects of varied color-word combinations upon verbal response latency. J. Psychol. 1969;72:219–231. doi: 10.1080/00223980.1969.10543502. - DOI
    1. Calibo T.K., Blanco J.A., Firebaugh S.L. Cognitive stress recognition; Proceedings of the 2013 IEEE International Instrumentation and Measurement Technology Conference (I2MTC); Minneapolis, MN, USA. 6–9 May 2013; pp. 1471–1475.
    1. Staal M. Stress, Cognition, and Human Performance: A Literature Review and Conceptual Framework. NASA Ames Research Center; Mountain View, CA, USA: 2004.
    1. Gaillard A.W.K. Comparing the concepts of mental load and stress. Ergonomics. 1993;36:991–1005. doi: 10.1080/00140139308967972. - DOI - PubMed

LinkOut - more resources