. 2019:616:289-311.
doi: 10.1016/bs.mie.2018.10.022. Epub 2019 Jan 14.

Kinetic characterization of Cas9 enzymes

Affiliations

Kinetic characterization of Cas9 enzymes

Mu-Sen Liu et al. Methods Enzymol. 2019.

Abstract

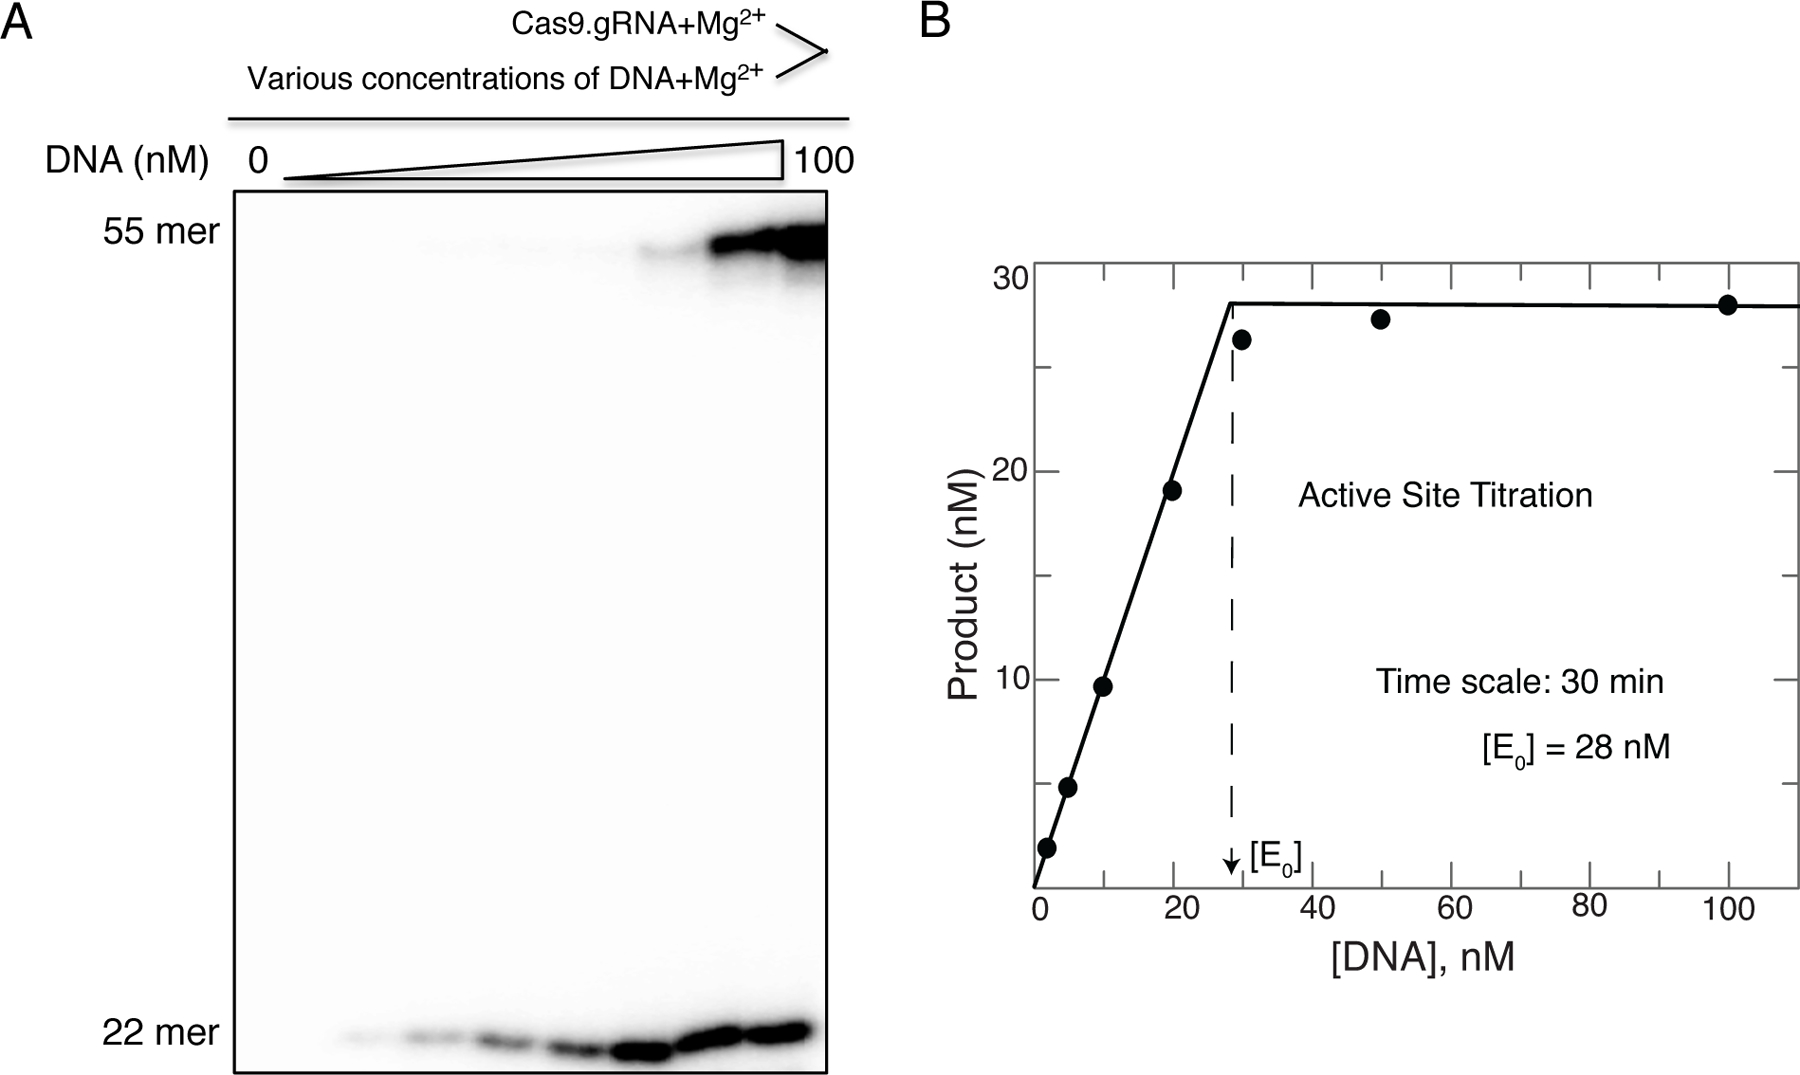
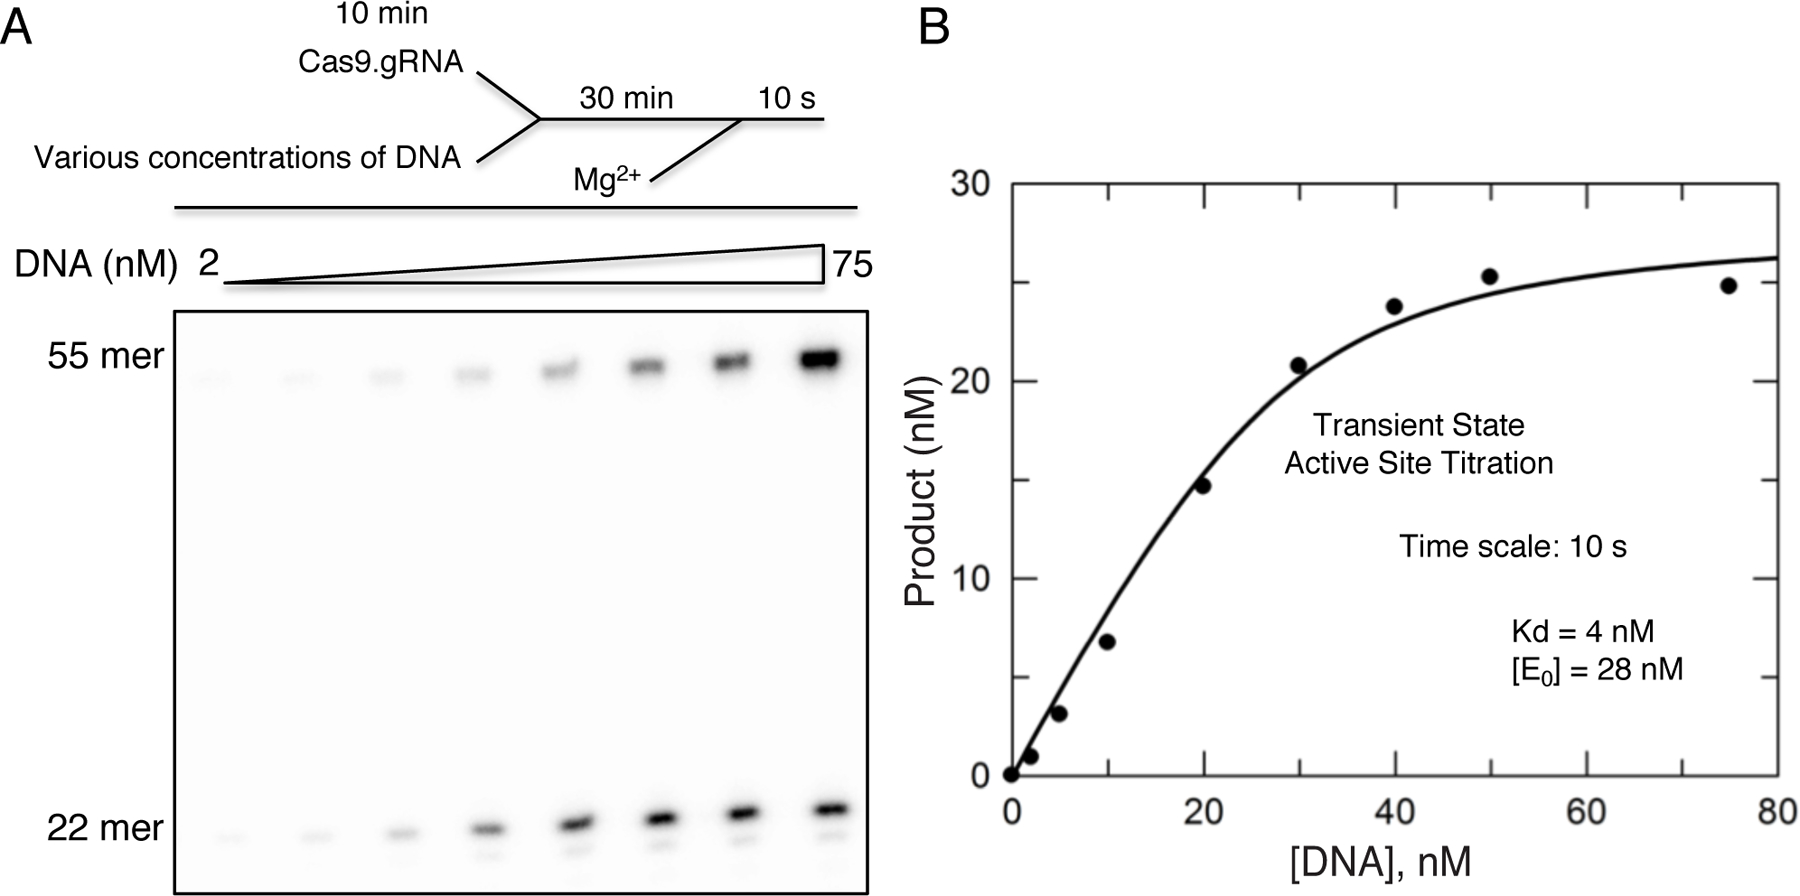
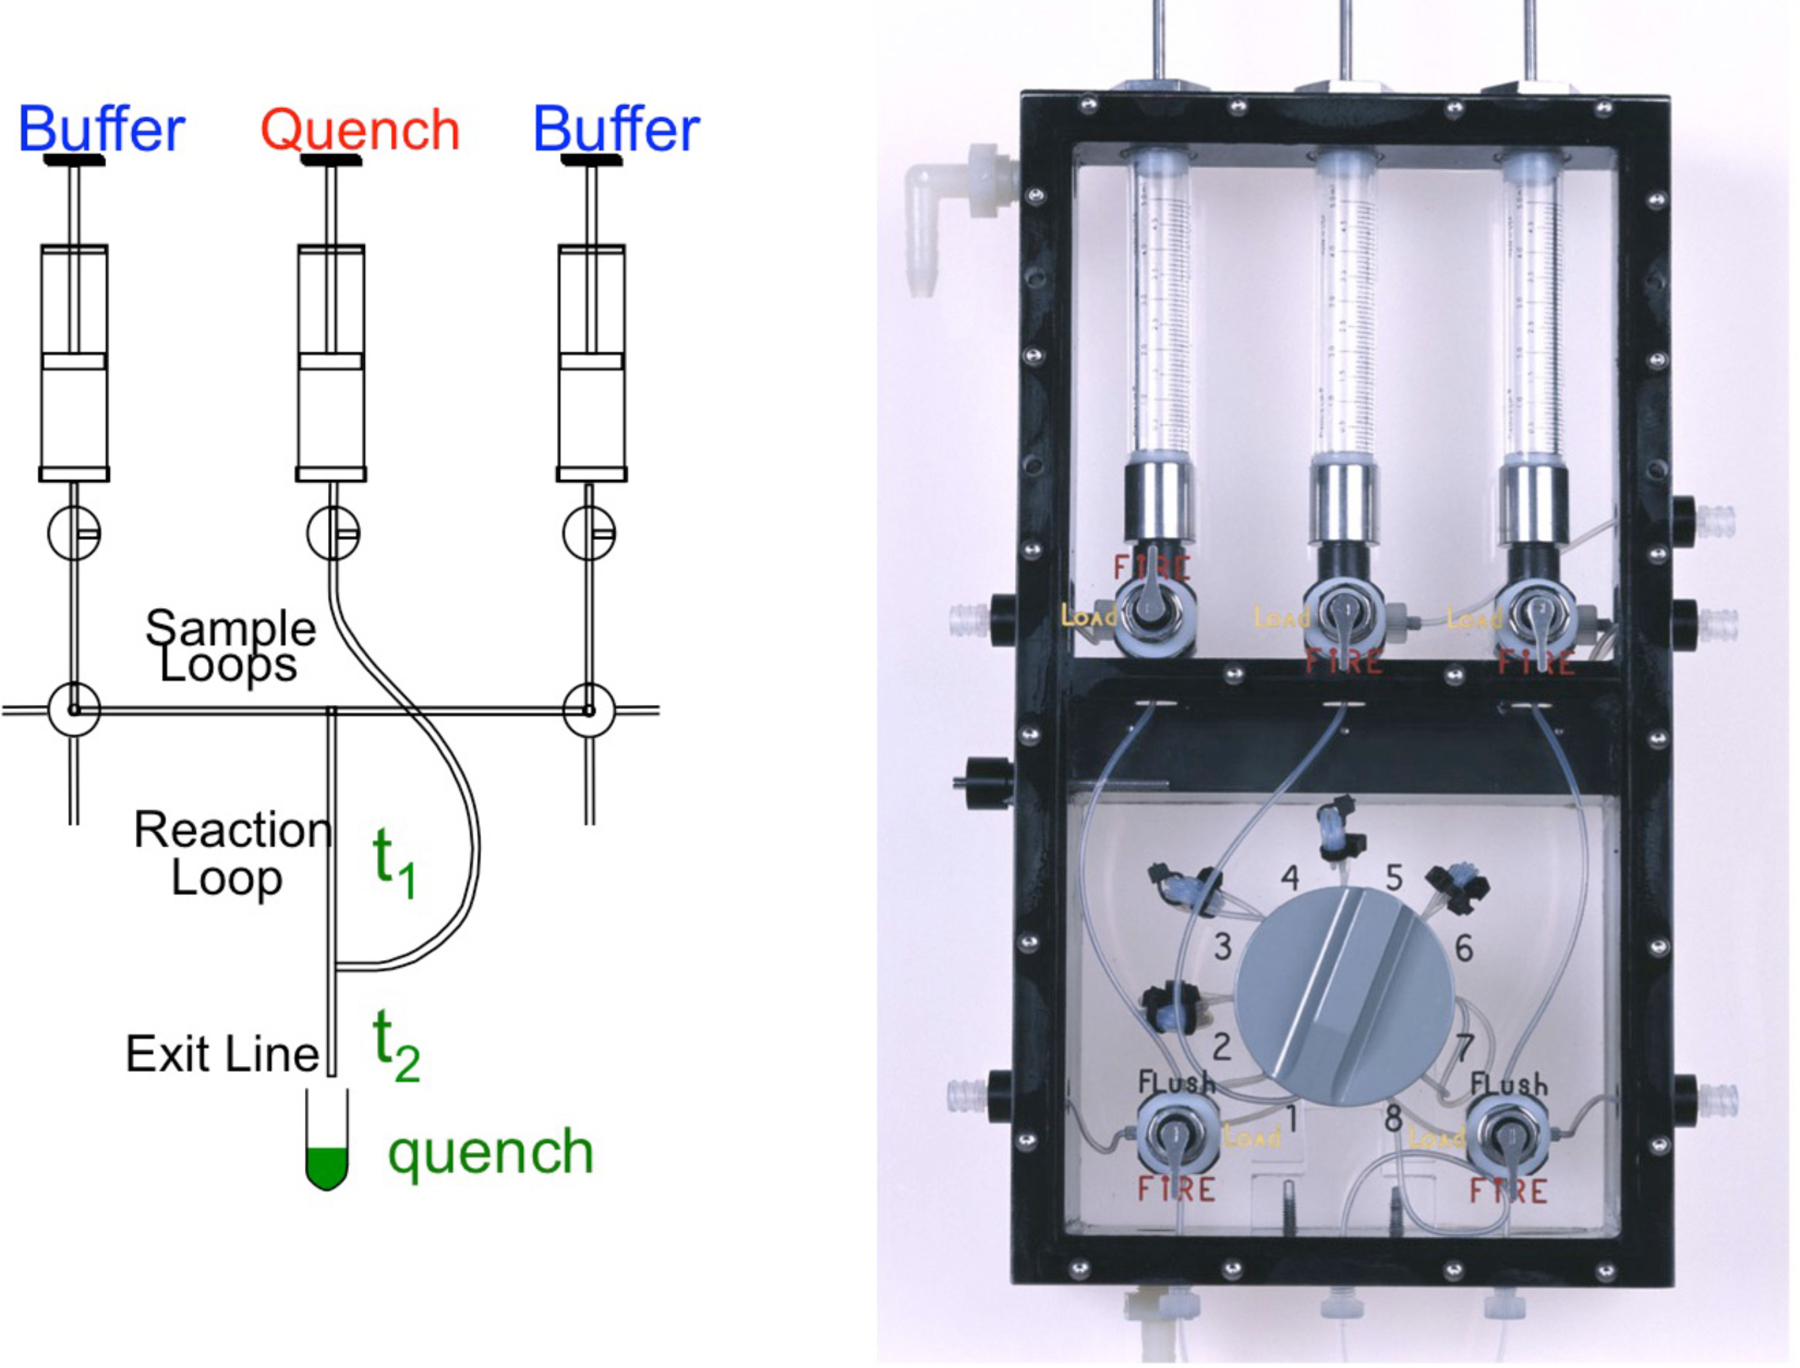
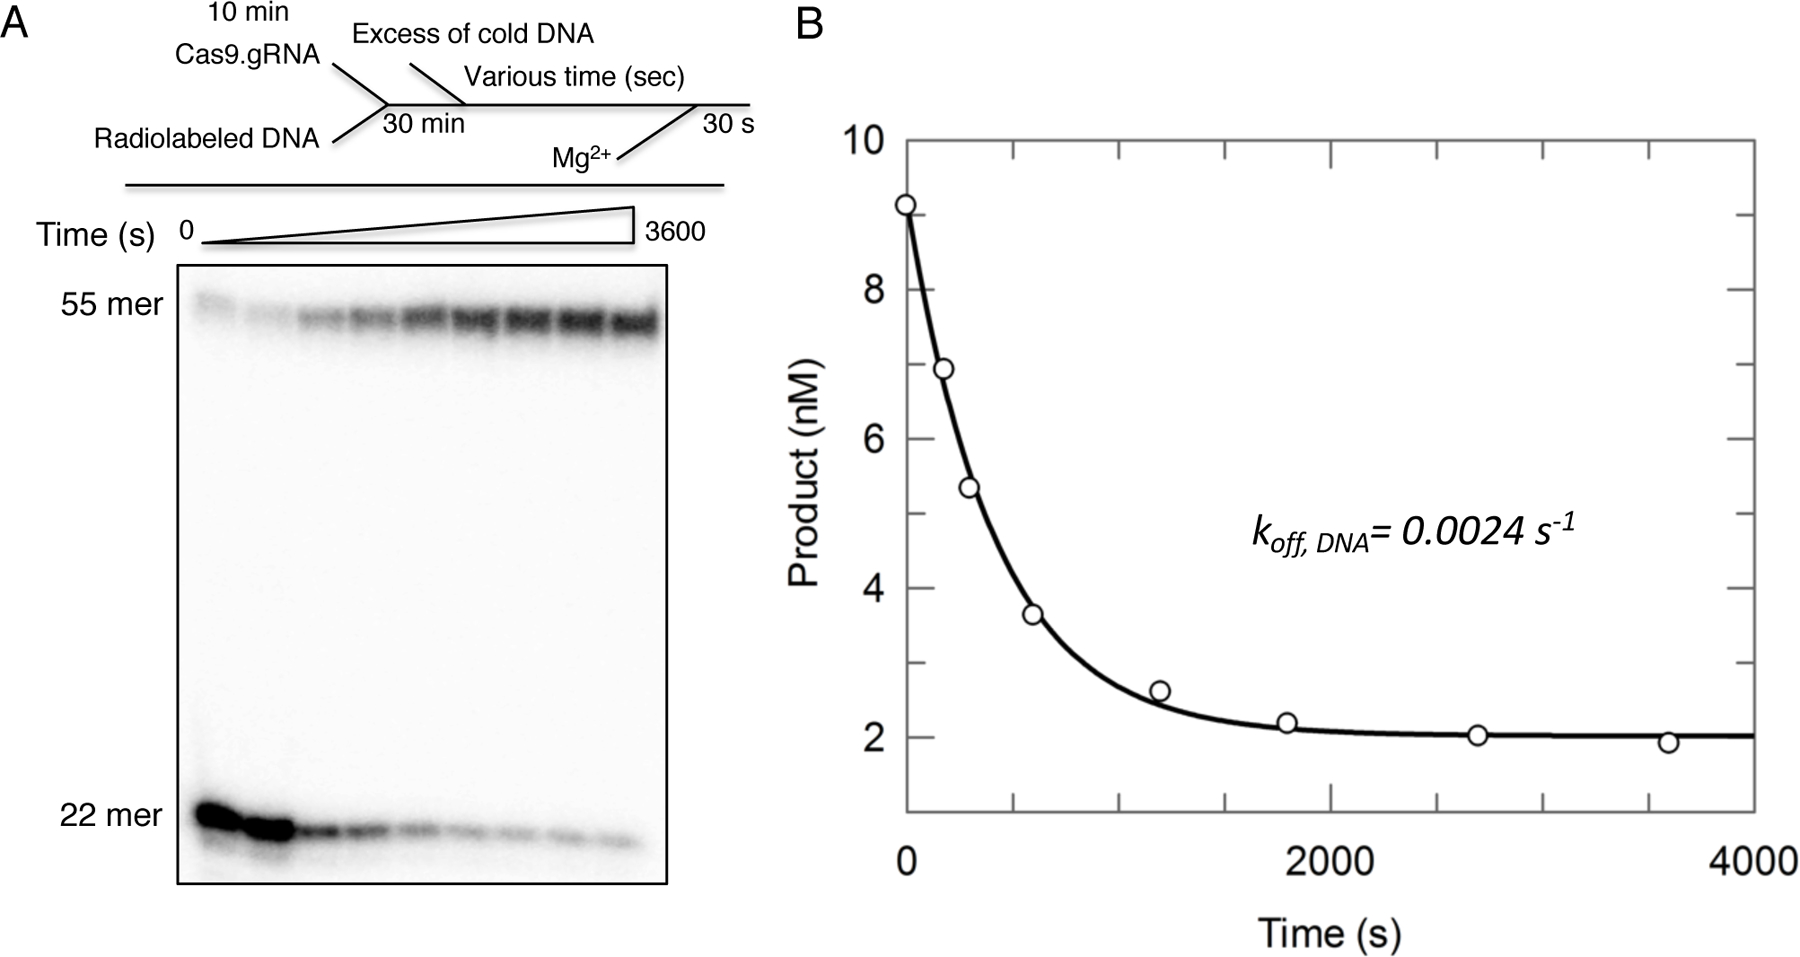
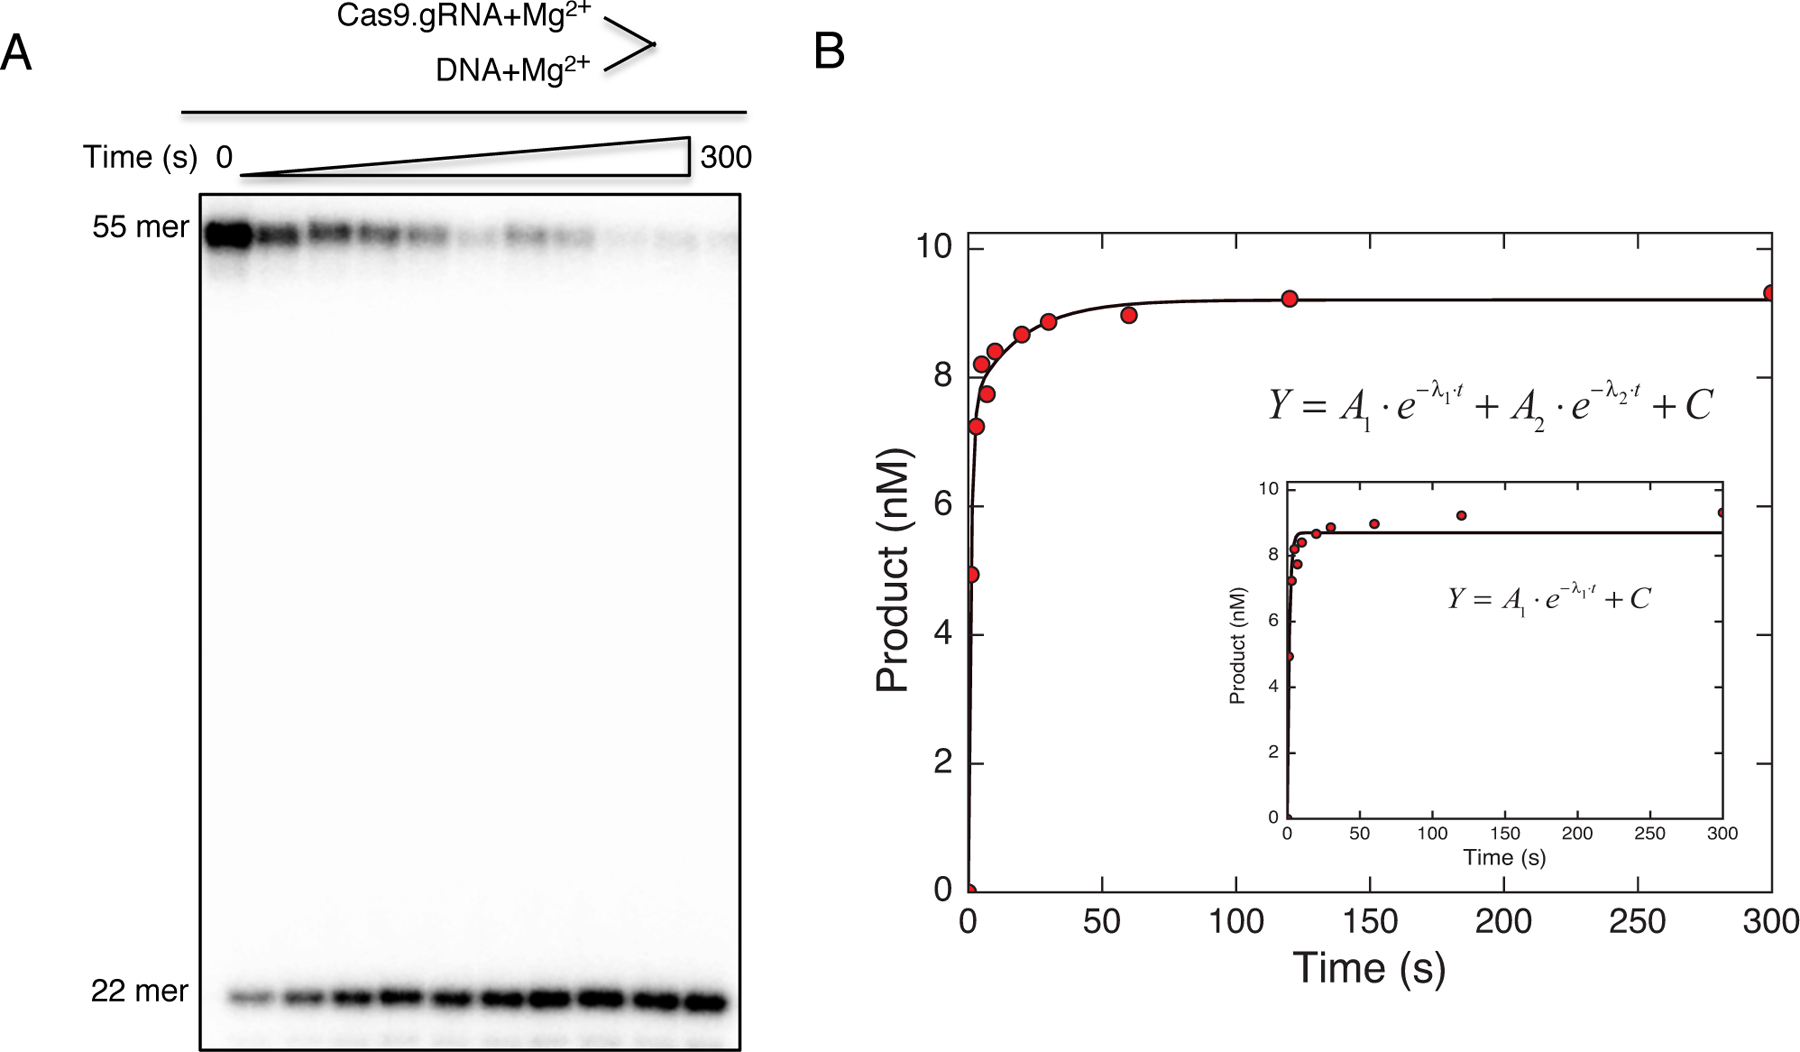
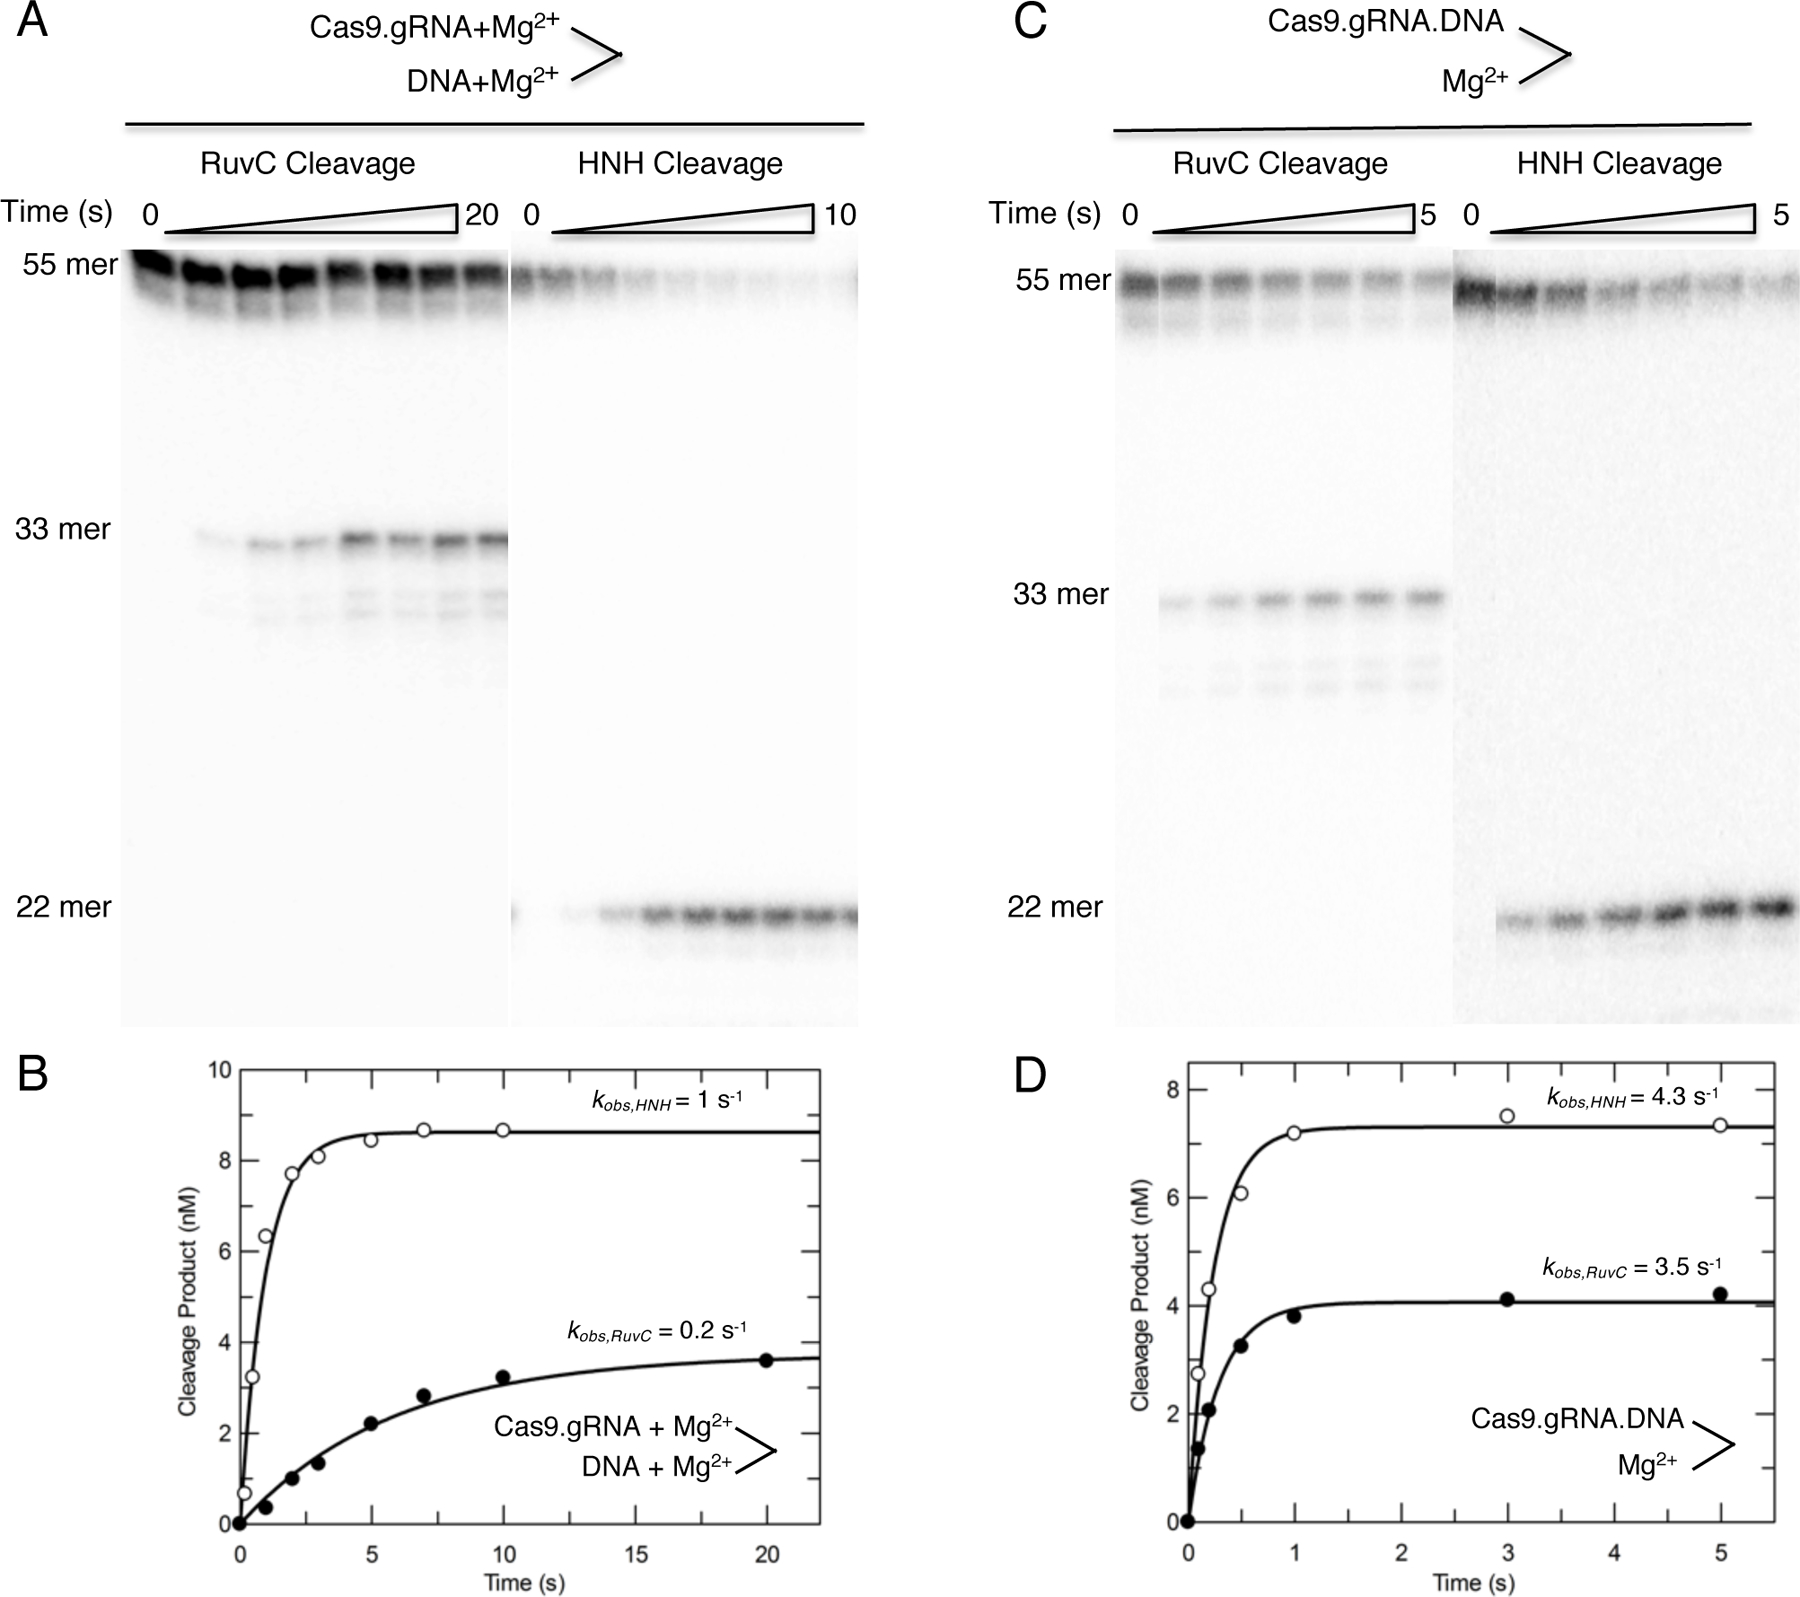
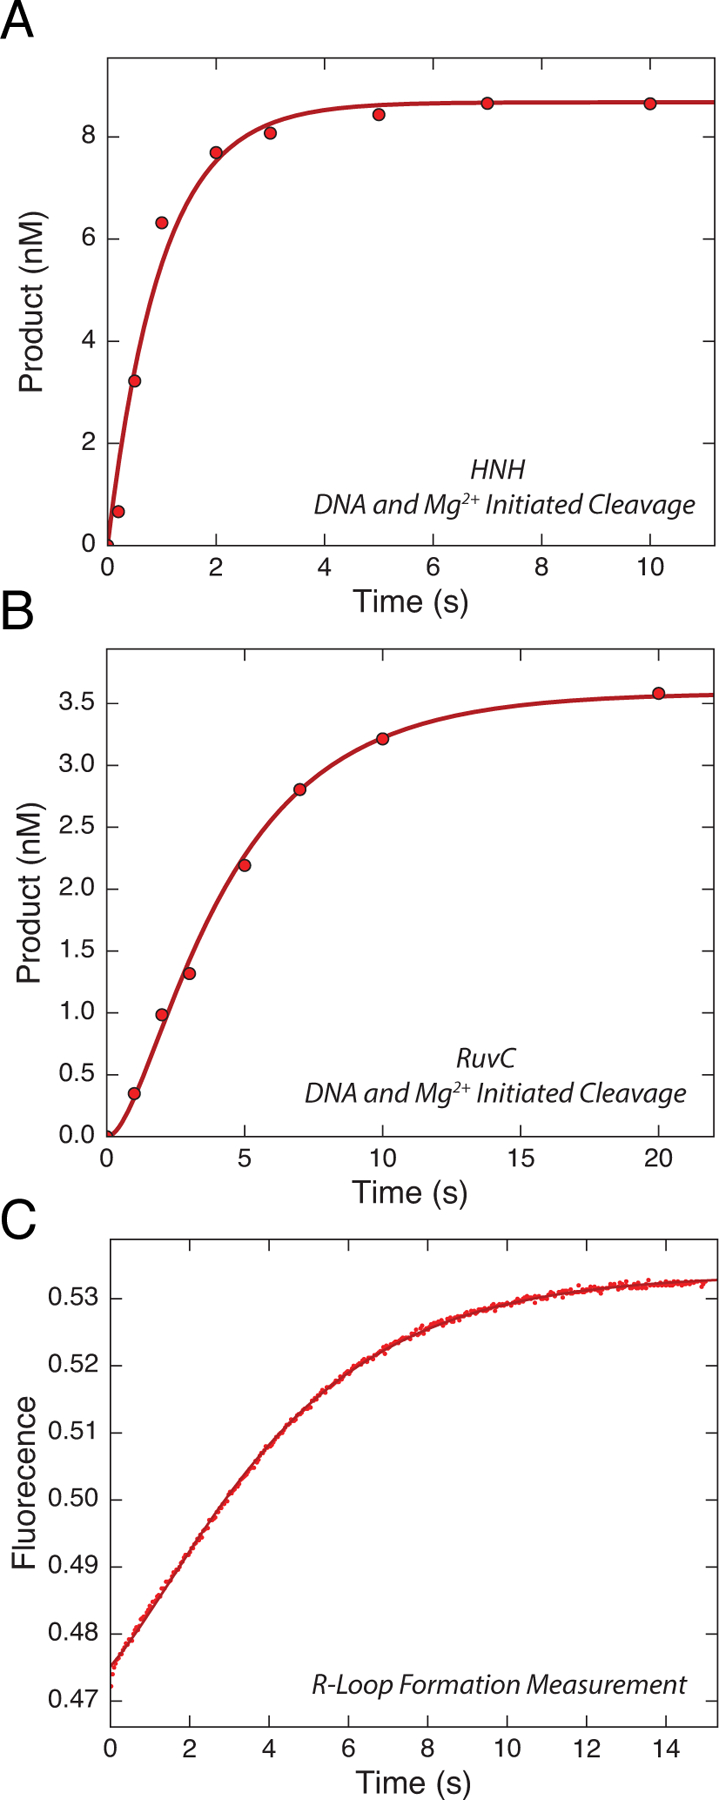
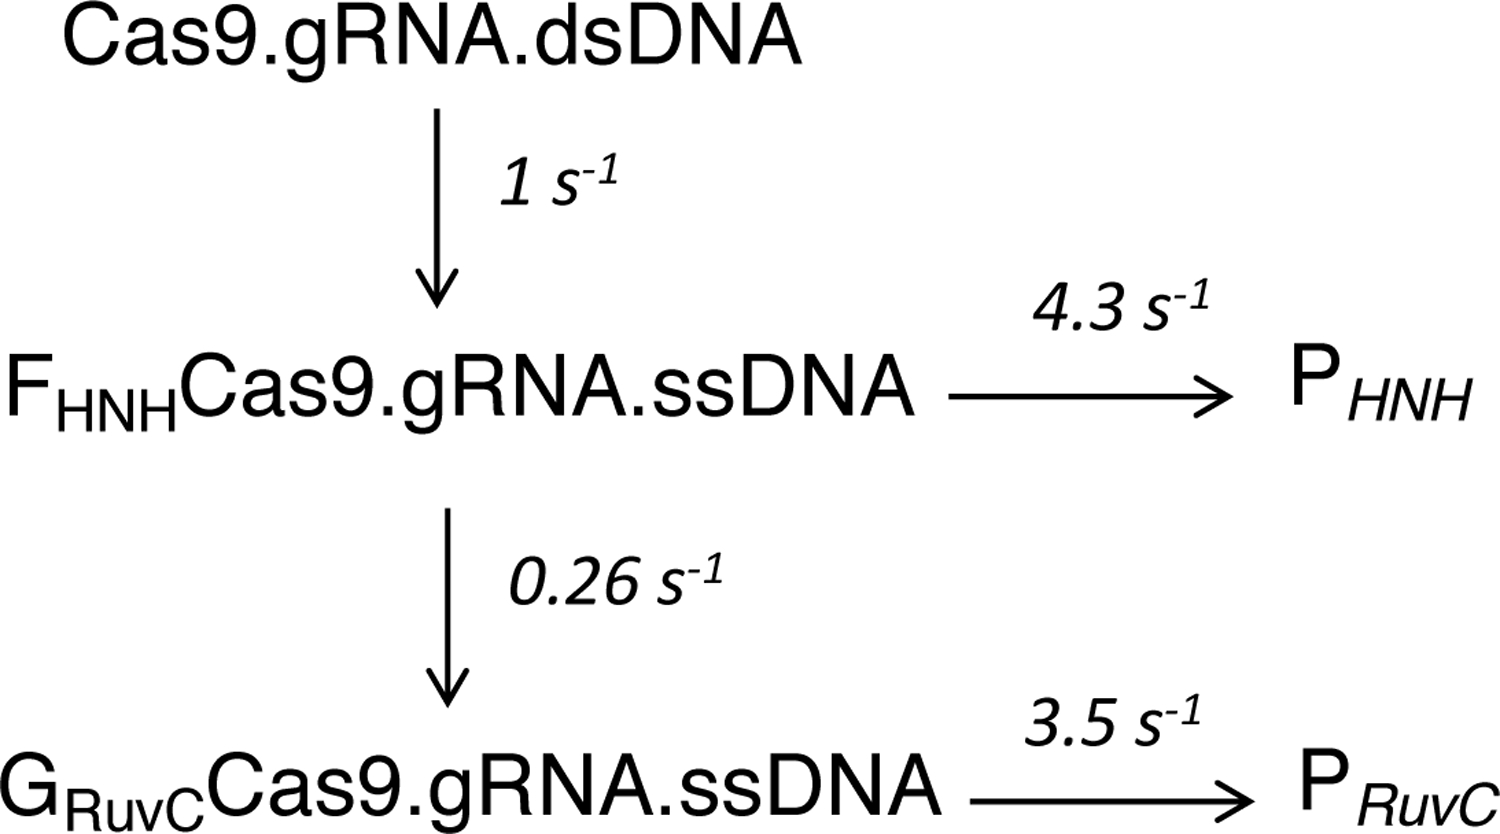
Bacterial adaptive immune systems employ clustered regularly interspaced short palindromic repeats (CRISPR) along with their CRISPR-associated genes (Cas) to form CRISPR RNA (crRNA)-guided surveillance complexes, which target foreign nucleic acids for destruction. Cas9 is unique in that it is composed of a single polypeptide that utilizes both a crRNA and a trans-activating crRNA (tracrRNA) or a single guide RNA to create double-stranded breaks in sequences complementary to the RNA via the HNH and RuvC nuclease domains. Cas9 has become a revolutionary tool for gene-editing applications. Here, we describe methods for studying the cleavage activities of Cas9. We describe protocols for rapid quench-flow and stopped-flow kinetics and interpretation of the results. The protocols detailed here will be paramount for understanding the mechanistic basis for specificity of this enzyme, especially in efforts to improve accuracy for clinical use.

Keywords: CRISPR; Cas9; Enzyme kinetics; Genome editing.


Conflict of interest statement

Financial conflict of interest statement: KAJ is President of KinTek Corporation, which provided the stopped-flow and quench-flow instruments and KinTek Explorer software used in this study.

Figures

Figure 1.
Figure 1.
(A) Our active-site titration assay was carried out by mixing a fixed concentration (100 nM) Cas9.gRNA (1:1 ratio) with varying concentrations of γ32P-labeled TS DNA duplex in the presence of Mg2+, then allowing the reaction to reach completion for 30 min. The scheme is shown above the gel image. (B) The plot of product formation as function of DNA concentration was fit using the quadratic equation. Our results showed 28 nM of Cas9.gRNA is active. The figure is adapted from Gong et al. 2018.
Figure 2.
Figure 2.
(A) Transient state active-site titration experiment was performed by pre-mixing a fixed concentration (100 nM) of Cas9.gRNA (1:1 ratio) with varying concentrations of γ32P-labeled TS DNA duplex for 30 min in the absence of Mg2+ to allow the Cas9.gRNA.DNA to reach equilibrium. The reaction was initiated by the addition of Mg2+ and allowed to proceed for 10 s. The reaction scheme is shown above the gel image. (B) The plot of product formation as a function of DNA concentration was fit using the quadratic equation. The result revealed that the Kd for DNA binding was 4 nM and the active-site concentration was 28 nM of Cas9.gRNA. This figure is adapted from Gong et al. 2018.
Figure 3.
Figure 3.
Rapid chemical-quench-flow apparatus. We show the schematic (left) and photograph of the syringe/valve chamber of a KinTek RQF-3 instrument. The two samples are loaded into the left and right hand Sample Loops, then after changing the valve position, a computer controlled motor drives the syringes containing Buffer to force the reactants to mix. Reaction occurs as the mixed samples flow through the Reaction Loop and is terminated by mixing with solution from the Quench syringe. The sample is then expelled into a collection tube so that it can be analyzed to determine the concentration of product for a particular time point. The time of reaction is varied by changing the length of the Reaction Loop using the 8-way valve shown in the photograph at the right, and by slightly altering the flow rate.
Figure 4.
Figure 4.
(A) The DNA dissociation rate measurement was conducted by preincubating radiolabeled DNA duplex and Cas9.gRNA for 30 min in the absence of Mg2+. Following by addition of 20X excess of cold trap DNA for varying incubation time points (0, 1, 5, 10 ,20, 30, 45, and 60 min), after adding Mg2+ to start the reaction for 30 sec. The scheme is shown above the gel image. (B) The plot of product formation as a function of time was fit by the single-exponential decay equation to define the DNA dissociation rate from Cas9.gRNA (koff,DNA = 0.0024 s−1). This figure is adapted from Gong et al. 2018.
Figure 5.
Figure 5.
(A) Cas9 cleavage pioneer assay was started by mixing radiolabeled DNA duplex and Mg2+ simultaneously to Cas9.gRNA, and the reaction was stopped at various time points. The scheme is shown above the gel image. (B) The plot of product formation as a function of time was fit by the double-exponential equation to obtain the cleavage rates for the initial fast phase and slow phase. Therefore, the reaction is biphasic. This figure is adapted from Gong et al. 2018.
Figure 6.
Figure 6.
(A) The HNH and RuvC time dependence experiments in Figure 5 were repeated over a shorter time scale. Cas9.gRNA was mixed simultaneously with DNA and Mg2+ to initiate the cleavage reaction. The scheme is shown above the gel image. (B) The plot of product formation as function of time was fit by a single-exponential equation to define the cleavage rates of 1 s−1 and 0.2 s−1 for the HNH and RuvC domains, respectively. (C) The experiments in (A) were repeated; however, Cas9.gRNA was preincubated with DNA for 30 min in the absence of Mg2+ followed by addition of Mg2+ to initiate the reaction. The scheme is shown above the gel image. (D) The plot of product formation as function of time was fit by a single-exponential equation to define the cleavage rates of 4.3 s−1 and 3.5 s−1 for the HNH and RuvC domains, respectively. These figures are adapted from Gong et al. 2018.
Figure 7.
Figure 7.
Analyzing and fitting the data globally using KinTek Explorer. (A) and (B) Time dependence of HNH and RuvC cleavage, measured in Fig 5A. (C) R-loop formation was measured by mixing Cas9.gRNA with DNA, where 2-AP was incorporated at position −9 nt distal to the PAM on the NTS, using stopped-flow fluorescence methods. The increase of fluorescence intensity as a function of time was biphasic defining two steps in R-loop formation. By inputting the rates of (A)-(C) into KinTek Explorer we were able to globally fit to the model shown in scheme 1. These figures are adapted from Gong et al. 2018. The KinTek Explorer mechanism file containing these data is included as a supplement.
Scheme 1
Scheme 1
Model for two-step R-loop formation.

References

    1. Anders C and Jinek M (2014) ‘In vitro enzymology of Cas9’, Methods Enzymol, 546, pp. 1–20. - PMC - PubMed
    1. Anders C, Niewoehner O, Duerst A and Jinek M (2014) ‘Structural basis of PAM-dependent target DNA recognition by the Cas9 endonuclease’, Nature, 513(7519), pp. 569–73. - PMC - PubMed
    1. Chen B, Gilbert LA, Cimini BA, Schnitzbauer J, Zhang W, Li GW, Park J, Blackburn EH, Weissman JS, Qi LS and Huang B (2013) ‘Dynamic imaging of genomic loci in living human cells by an optimized CRISPR/Cas system’, Cell, 155(7), pp. 1479–91. - PMC - PubMed
    1. Doudna JA and Charpentier E (2014) ‘Genome editing. The new frontier of genome engineering with CRISPR-Cas9’, Science, 346(6213), pp. 1258096. - PubMed
    1. Gilbert LA, Larson MH, Morsut L, Liu Z, Brar GA, Torres SE, Stern-Ginossar N, Brandman O, Whitehead EH, Doudna JA, Lim WA, Weissman JS and Qi LS (2013) ‘CRISPR-mediated modular RNA-guided regulation of transcription in eukaryotes’, Cell, 154(2), pp. 442–51. - PMC - PubMed

Publication types

Substances

LinkOut - more resources