. 2019 Mar 25;87(4):e00783-18.
doi: 10.1128/IAI.00783-18. Print 2019 Apr.

Intracellular Degradation of Helicobacter pylori VacA Toxin as a Determinant of Gastric Epithelial Cell Viability

Affiliations

Intracellular Degradation of Helicobacter pylori VacA Toxin as a Determinant of Gastric Epithelial Cell Viability

Nora J Foegeding et al. Infect Immun. .

Abstract

Helicobacter pylori VacA is a secreted pore-forming toxin that induces cell vacuolation in vitro and contributes to the pathogenesis of gastric cancer and peptic ulcer disease. We observed that purified VacA has relatively little effect on the viability of AGS gastric epithelial cells, but the presence of exogenous weak bases such as ammonium chloride (NH4Cl) enhances the susceptibility of these cells to VacA-induced vacuolation and cell death. Therefore, we tested the hypothesis that NH4Cl augments VacA toxicity by altering the intracellular trafficking of VacA or inhibiting intracellular VacA degradation. We observed VacA colocalization with LAMP1- and LC3-positive vesicles in both the presence and absence of NH4Cl, indicating that NH4Cl does not alter VacA trafficking to lysosomes or autophagosomes. Conversely, we found that supplemental NH4Cl significantly increases the intracellular stability of VacA. By conducting experiments using chemical inhibitors, stable ATG5 knockdown cell lines, and ATG16L1 knockout cells (generated using CRISPR/Cas9), we show that VacA degradation is independent of autophagy and proteasome activity but dependent on lysosomal acidification. We conclude that weak bases like ammonia, potentially generated during H. pylori infection by urease and other enzymes, enhance VacA toxicity by inhibiting toxin degradation.

Keywords: Helicobacter pylori; VacA; cell death; cell survival; pore-forming toxins.


Figures

FIG 1
FIG 1
Loss of cell viability requires treatment with both VacA and supplemental NH4Cl. (A to F) AGS cells were treated once a day for 5 days with 5 μg/ml of VacA in the absence (−) or presence (+) of 5 mM NH4Cl. Transmitted-light micrographs were collected after each successive day of VacA intoxication to assess for vacuolation. Scale bar, 50 μm. (G) Quantification of cellular ATP levels from the images shown in panels A to F and in Fig. S1A to F using an ATPlite 1step Luminescence Assay. Values represent luminescence signal normalized to that of the control (−NH4Cl −VacA) cells. (H) AGS cells were treated once a day for 5 days with 20 μg/ml of VacA in the absence or presence of 5 mM NH4Cl. After 5 days, cells were fixed and stained with 5% crystal violet to assess for the presence of cells.
FIG 2
FIG 2
Treatment with NH4Cl does not promote VacA trafficking to mitochondria. AGS cells were treated with a pulse of 488-VacA (1 h at 4°C for the 0-min time point; 5 min at 37°C for all other time points), washed, incubated for various lengths of time in the absence or presence of 5 mM NH4Cl, and then fixed and stained with anti-MTC02 (mitochondria). (A) Representative image of a cell at the 24-h time point in the presence of NH4Cl. The image is a single, nondeconvolved z-slice. Scale bars, 2 μm (zoom) and 10 μm (all other images). (B to D) The Pearson correlation coefficient was used to quantify colocalization of VacA with MTC02 in the absence (−) and presence (+) of NH4Cl. (D) Combined data. Open circles indicate absence of NH4Cl and closed circles indicate presence of NH4Cl. Each data point represents the Pearson’s coefficient of an individual cell measured using ImageJ from a single, nondeconvolved z-slice (n ≥ 10 cells per condition per experiment from two independent experiments). For panels B to D, error bars indicate standard deviations. For panels B and C, the means for each data set are statistically different as determined by ANOVA (P ≤ 0.0001). ***, P ≤ 0.001, by Dunnett’s multiple-comparison test. (D) ns (not significant), P > 0.05; *, P = 0.0206 as determined by an unpaired, two-tailed t test.
FIG 3
FIG 3
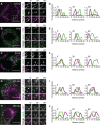
Analysis of VacA localization in living cells. (A to C) Live-cell imaging of AGS cells transfected with Mito-RFP. Cells were treated with a pulse of 488-VacA for 5 min at 37°C and then washed and incubated at 37°C in medium supplemented with 5 mM NH4Cl. Movies were collected at 0.5 h, 4 h, and 24 h post-VacA treatment, as indicated. Panels at left show a single frame of the cell being imaged; at right are sequential images of the regions boxed in the left-hand panels. Time is indicated in seconds relative to the initial frame. Images are single z-slices. Scale bars, 10 μm (left images) and 2 μm (right images). (D to F) Line scans of the regions indicated by yellow dashed lines shown in merged panels A to C (right images). The magenta line represents normalized Mito-RFP fluorescence intensity. The green line represents normalized 488-VacA fluorescence intensity. In panels D and F, the initial frame reveals VacA appearing near mitochondria, but subsequent frames reveal VacA moving away from mitochondria. In panel E, the frames reveal VacA initially appearing away from mitochondria, moving near mitochondria, and then moving back away from mitochondria. (G and H) Live-cell imaging of AGS cells transfected with mCh-Rab5a (G) or mCh-Rab7 (H), treated with a pulse of 488-VacA for 1 h at 4°C, and then washed and incubated at 37°C. Movies were collected at 20 min and 45 min posttreatment, as indicated. Panels at left show a single frame of the cell being imaged. At right are sequential images of regions boxed in the left-hand panels. Time is indicated in seconds relative to initial frames. Images are single z-slices. Scale bars, 10 μm (left images) and 2 μm (right images). (I and J) Line scans of the regions indicated by yellow dashed lines shown in merged panels G and H (right images). The magenta line represents normalized mCh-Rab5a (I) or mCh-Rab7 (J) fluorescence intensity, appearing as two peaks due to their membrane localization. The green line represents normalized 488-VacA fluorescence intensity. Frames reveal a stable colocalization of VacA with early (Rab5a) and late (Rab7) endosomes.
FIG 4
FIG 4
NH4Cl inhibits intracellular VacA degradation. (A) Sum intensity z-section projections of AGS cells treated with a pulse of 488-VacA for 5 min at 37°C and then washed and incubated for 24 h in the absence or presence of 5 mM NH4Cl. DNA, blue. Intensities for the 488 channel are scaled identically according to a look-up table. Scale bar, 20 μm. (B) Quantification of the images shown in panel A. Error bars indicate standard deviations (n ≥ 50 cells per condition). ****, P < 0.0001 as determined by an unpaired, two-tailed t test. (C and D) Western blots of whole-cell lysates prepared from AGS cells treated for 5 min at 37°C with VacA and then washed and incubated for various lengths of time in the absence (−) or presence (+) of 25 mM NH4Cl. The blot was probed with antibodies targeting VacA or tubulin (DM1α); 100- and 58-kDa references are marked on the left. (E) Western blot of whole-cell lysates prepared from AGS cells treated for 1 h at 4°C with VacA and then washed and incubated for 0.5 or 24 h in the absence or presence of 5 mM NH4Cl. The blot was probed with antibodies targeting VacA and tubulin (DM1α); 100- and 58-kDa references are marked on the left. (F) Quantification of the blot shown in panel E. Error bars indicate standard deviations (n = 4). *, P = 0.0163; **, P = 0.0016; ****, P < 0.0001, as determined by a paired, two-tailed t test. (G) Transmitted-light micrographs of cells used in the experiments shown in panels C and D at each successive time point. Scale bar, 20 μm.
FIG 5
FIG 5
VacA accumulates in lysosomes and autophagosomes/autolysosomes in both the absence and presence of NH4Cl. AGS cells were treated with a pulse of 488-VacA (1 h at 4°C for the 0-min time point; 5 min at 37°C for all other time points), washed, and incubated for various lengths of time in the absence or presence of 5 mM NH4Cl and then fixed and stained with anti-LAMP1 (lysosomes) or anti-LC3 (autophagosomes/autolysosomes) antibody. (A) Representative images of cells at the 24-h time point in the presence of NH4Cl. Images are single, nondeconvolved z-slices. Scale bars, 2 μm (zoom images) and 10 μm (all other images). (B to E) The Pearson correlation coefficient was used to quantify colocalization of VacA with LAMP1 and LC3 in the absence (−) and presence (+) of NH4Cl. Open circles indicate the absence of NH4Cl, and closed circles indicate the presence of NH4Cl. Each data point represents the Pearson’s coefficient of an individual cell measured using ImageJ from a single, nondeconvolved z-slice. Error bars indicate standard deviations (n ≥ 10 cells per condition per experiment from two independent experiments). The means for each data set are statistically different (P ≤ 0.0001) as determined by an ANOVA. **, P ≤ 0.01; ***, P ≤ 0.001, as determined by a Dunnett’s multiple-comparison test.
FIG 6
FIG 6
VacA degradation is independent of autophagy but dependent on lysosome acidification. (A to O) Cells were treated for 1 h at 4°C with VacA and then washed and incubated for 0.5 or 24 h in the absence or presence of respective inhibitors. Cell lysates were collected to assess VacA levels using Western blot analysis. Transmitted-light images were collected at the 24-h time point to assess for vacuolation. (A) Representative Western blot of whole-cell lysates prepared from AGS cells treated with VacA in the absence or presence of 10 mM 3-MA. (B) Quantification of the blot shown in panel A (n = 3). Error bars indicate standard deviations. ***, P = 0.0006; **, P = 0.0018; ns (not significant), P = 0.4227, by a paired, two-tailed t test. (C) Transmitted-light micrographs of cells used in the experiment shown in panel A after 24 h of VacA treatment. (D) Representative Western blot of whole-cell lysates prepared from a scrambled control cell line and two AGS ATG5 KD cell lines treated with VacA. (E) Quantification of the blot shown in panel D. Error bars indicate standard deviations (n = 3). ***, P < 0.001 (paired, two-tailed t test); ns (not significant), P = 0.9211 (by ANOVA). (F) Transmitted-light micrographs of cells used in the experiment shown in panel D after 24 h of VacA treatment. (G) Representative Western blot of whole-cell lysates prepared from parental HeLa and HeLa ATG16L1 KO cells treated with VacA. (H) Quantification of the blot shown in panel G. Error bars indicate standard deviations (n = 3). ****, P < 0.0001; **, P = 0.0013; ns, P = 0.5992, by a paired, two-tailed t test. (I) Transmitted-light micrographs of cells used in the experiment shown in panel G after 24 h of VacA treatment. (J) Representative Western blot of whole-cell lysates prepared from AGS cells treated with VacA in the absence or presence of 100 μM chloroquine (CQ). (K) Quantification of the blot shown in panel J. Error bars indicate standard deviations (n = 4). ****, P < 0.0001; *, P = 0.0275; ns, P = 0.1839, by a paired, two-tailed t test. (L) Transmitted-light micrographs of cells used in experiment shown in panel J after 24 h of VacA treatment. (M) Representative Western blot of whole-cell lysates prepared from AGS cells treated with VacA in the absence or presence of 10 nM bafilomycin A1 (Baf A1). (N) Quantification of the blot shown in panel M. Error bars indicate standard deviations (n = 3). ****, P < 0.0001; ns, P = 0.1532, paired, two-tailed t test. (O) Transmitted-light micrographs of cells used in the experiment shown in panel M after 24 h of VacA treatment. All blots were probed with antibodies targeting VacA and tubulin (DM1α); 100- and 58-kDa references are marked on the left. Scale bar, 20 μm.
FIG 7
FIG 7
Proposed model for the cellular response to VacA intoxication. In a healthy cell, VacA is internalized, trafficked to the lysosome, and degraded. If lysosome activity is inhibited, VacA can accumulate in the lysosome, and cells exhibit vacuolation and eventually cell death.

Similar articles

Cited by

References

    1. Hooi JKY, Lai WY, Ng WK, Suen MMY, Underwood FE, Tanyingoh D, Malfertheiner P, Graham DY, Wong VWS, Wu JCY, Chan FKL, Sung JJY, Kaplan GG, Ng SC. 2017. Global prevalence of Helicobacter pylori infection: systematic review and meta-analysis. Gastroenterology 153:420–429. doi:10.1053/j.gastro.2017.04.022. - DOI - PubMed
    1. Suerbaum S, Michetti P. 2002. Helicobacter pylori infection. N Engl J Med 347:1175–1186. doi:10.1056/NEJMra020542. - DOI - PubMed
    1. Peek RM, Blaser MJ. 2002. Helicobacter pylori and gastrointestinal tract adenocarcinomas. Nat Rev Cancer 2:28–37. doi:10.1038/nrc703. - DOI - PubMed
    1. Foegeding NJ, Caston RR, McClain MS, Ohi MD, Cover TL. 2016. An overview of Helicobacter pylori VacA toxin biology. Toxins (Basel) 8:173. doi:10.3390/toxins8060173. - DOI - PMC - PubMed
    1. Kim I-J, Blanke SR. 2012. Remodeling the host environment: modulation of the gastric epithelium by the Helicobacter pylori vacuolating toxin (VacA). Front Cell Infect Microbiol 2:37. doi:10.3389/fcimb.2012.00037. - DOI - PMC - PubMed

Publication types

MeSH terms