. 2019 Feb 1;33(3-4):150-165.
doi: 10.1101/gad.320481.118. Epub 2019 Jan 28.

Autophagy modulates lipid metabolism to maintain metabolic flexibility for Lkb1-deficient Kras-driven lung tumorigenesis

Affiliations

Autophagy modulates lipid metabolism to maintain metabolic flexibility for Lkb1-deficient Kras-driven lung tumorigenesis

Vrushank Bhatt et al. Genes Dev. .

Abstract

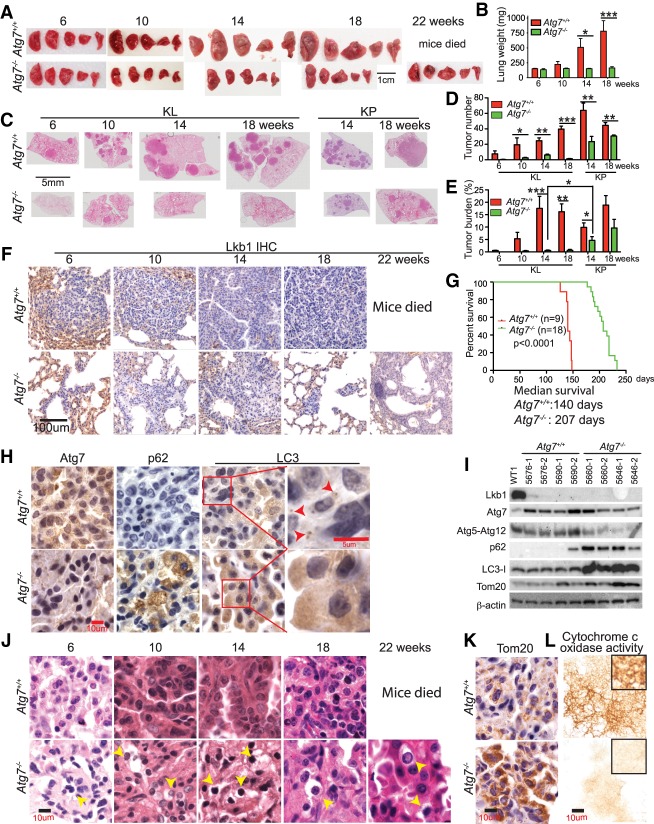
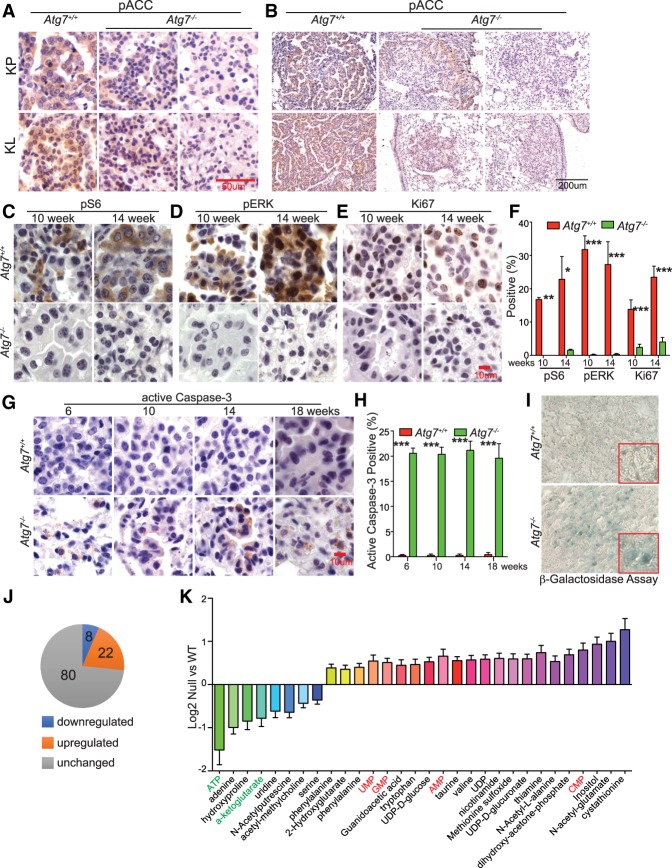
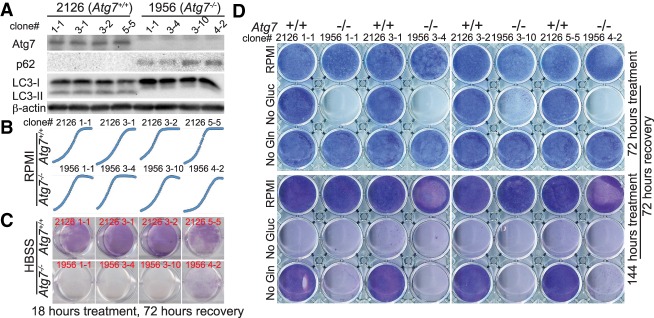
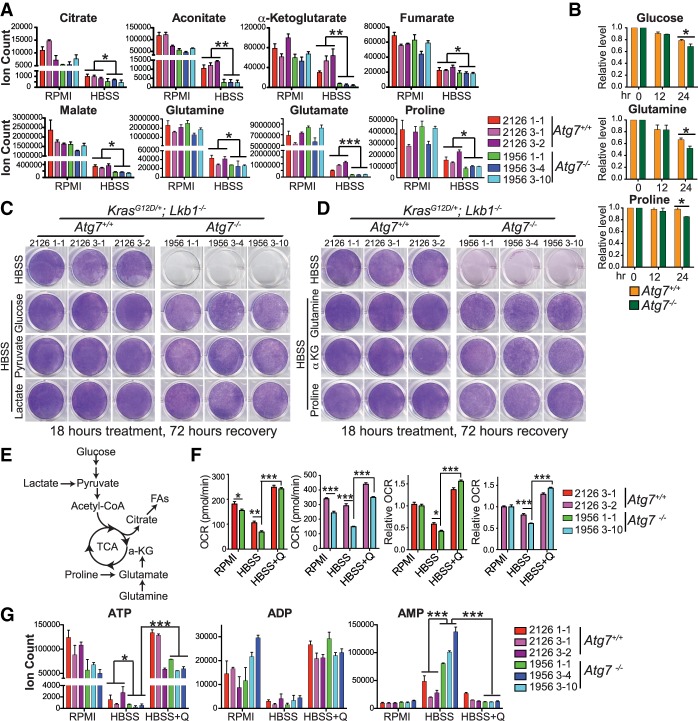
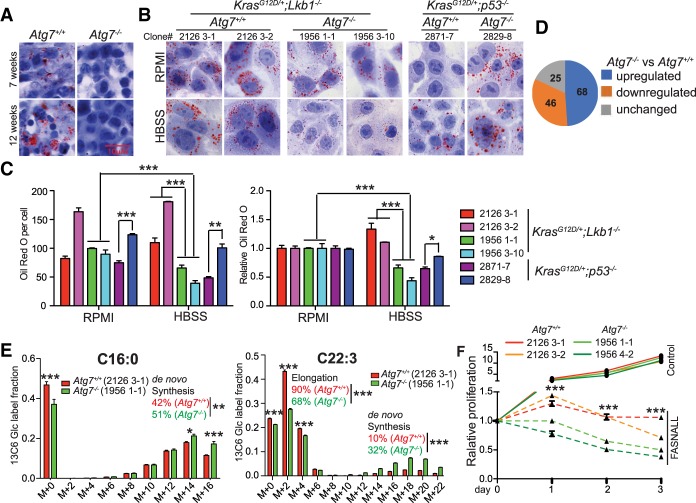
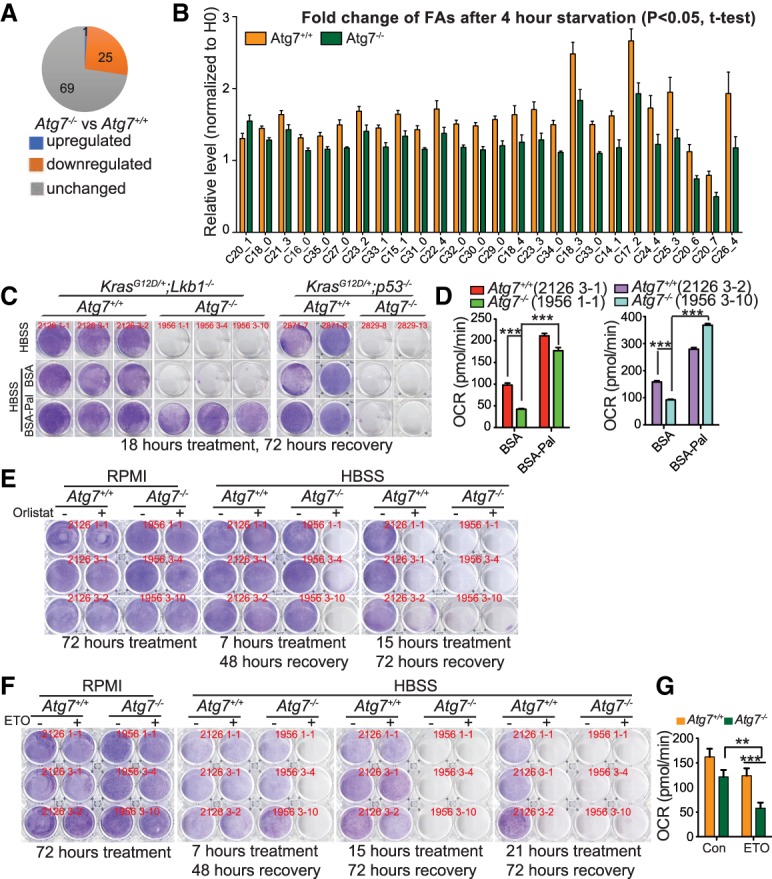
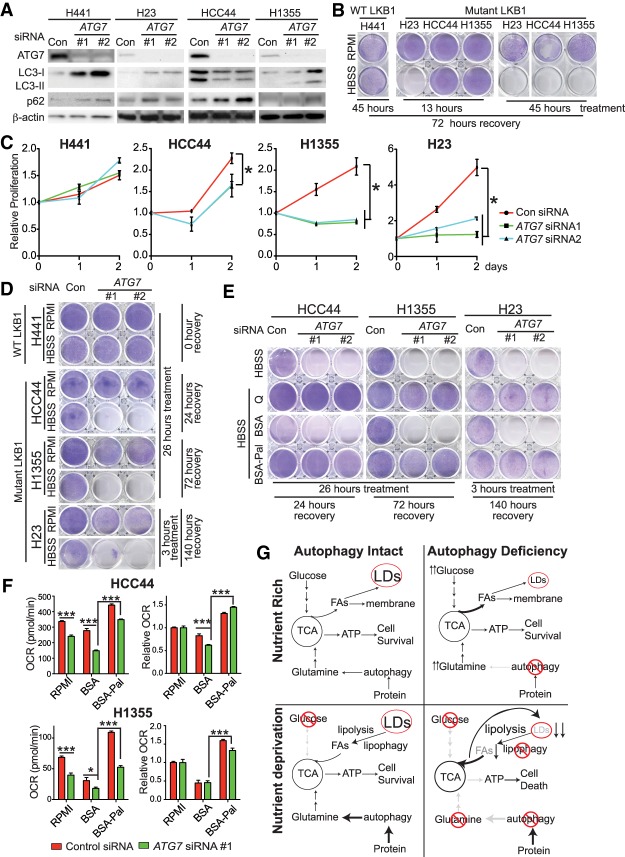
Loss of tumor suppressor liver kinase B1 (LKB1) promotes cancer cell proliferation but also leads to decreased metabolic plasticity in dealing with energy crises. Autophagy is a protective process involving self-cannibalization to maintain cellular energy homeostasis during nutrient deprivation. We developed a mouse model for Lkb1-deficient lung cancer with conditional deletion of essential autophagy gene Atg7 to test whether autophagy compensates for LKB1 loss for tumor cells to survive energy crises. We found that autophagy ablation was synthetically lethal during Lkb1-deficient lung tumorigenesis in both tumor initiation and tumor growth. We further found that autophagy deficiency causes defective intracellular recycling, which limits amino acids to support mitochondrial energy production in starved cancer cells and causes autophagy-deficient cells to be more dependent on fatty acid oxidation (FAO) for energy production, leading to reduced lipid reserve and energy crisis. Our findings strongly suggest that autophagy inhibition could be a strategy for treating LKB1-deficient lung tumors.

Keywords: LKB1; autophagy; energy metabolism; lipid metabolism; non-small cell lung cancer.


Figures

Figure 1.
Figure 1.
Autophagy is required for Lkb1-deficient Kras mutant lung tumor initiation and progression. (A) Representative gross lung pathology at the indicated times. (B) Graph of wet lung weight at the indicated times. (C) Representative histology of scanned lung sections at the indicated times after Lenti-Cre infection. (D,E) Quantification of tumor number (D) and tumor burden (E) from C. (F) Representative IHC of Lkb1 at the indicated times. (G) Kaplan-Meier survival curve of mice bearing KL tumors that were intranasally infected with Lenti-Cre. P < 0.0001, log-rank test. (H) Representative IHC of Atg7, p62, and LC3 shows autophagy ablation in Atg7−/− tumors (red arrows indicate autophagosome in Atg7+/+ tumors) at 10 wk after Lenti-Cre infection. (I) Western blot of Lkb1, Atg7, Atg5-Atg12, p62, LC3, Tom20, and β-actin of KL lung tumors at 18 wk after Lenti-Cre infection. (J) Representative hematoxylin and eosin (H&E) staining of lung tumors shows increased necrotic cells (yellow arrows) in Atg7−/− tumors at the indicated times. (K) Representative IHC of Tom20 shows accumulation of mitochondria in Atg7-deficient tumors at 18 wk after Lenti-Cre infection. (L) Cytochrome c oxidase activity in tumors at 18 wk after Lenti-Cre infection. For all of the graphs, the error bar indicates ±SEM. (*) P < 0.05; (**) P < 0.01; (***) P < 0.001. See also Supplemental Figures S2 and S3.
Figure 2.
Figure 2.
Autophagy deficiency impairs oncogenic signaling. (A,B) Representative IHC of pACCS79 in KP and KL tumors at 18 wk after Lenti-Cre infection at high magnification (A) and low magnification (B). (CE) Representative IHC of pS6, pERK, and Ki67 at the indicated times. (F) Quantification of pS6, pERK, and Ki67 from CE. (G) Representative IHC of active caspase-3 at the indicated times. (H) Quantification of active caspase-3 from G. (I) Representative images of positive β-galactosidase staining at 18 wk after Lenti-Cre infection. (J) Comparison of metabolites between Atg7+/+ and Atg7−/− KL tumors obtained by liquid chromatography/mass spectrometry (LC-MS). (K) Levels of metabolites that show a significant difference between Atg7+/+ and Atg7−/− KL tumors. For all of the graphs, the error bar indicates ±SEM. (*) P < 0.05; (**) P < 0.01; (***) P < 0.001. See also Supplemental Figure S3.
Figure 3.
Figure 3.
Autophagy-deficient KL TDCLs are sensitive to metabolic challenge. (A) Western blot of Atg7, p62, LC3, and β-actin in KL TDCLs. (B) Cell proliferation of KL TDCLs in nutrient-rich RPMI medium analyzed using IncuCyte live-cell analysis system. (C,D) Clonogenic survival assay of TDCLs following Hank's balanced salt solution (HBSS; no glucose) starvation (C) or glucose (Gluc) or glutamine (Gln) deprivation (D). See also Supplemental Figure S4.
Figure 4.
Figure 4.
Autophagy mediates substrate recycling for TCA metabolism to maintain energy homeostasis in starvation. (A) Levels of TCA cycle intermediates and derivatives in nutrient-rich RPMI and after 1 h of HBSS starvation. (B) Glucose, glutamine, and proline consumption of TDCLs in nutrient-rich RPMI conditions. Each bar represents the average of four clones from Atg7+/+ or Atg7−/− TDCLs. (C,D) Clonogenic survival assay of Atg7+/+ and Atg7−/− TDCLs in HBSS and HBSS supplemented with 2 g/L glucose, 1 mM sodium pyruvate, 2 mM lactate, 2 mM glutamine, 1 mM membrane-permeable α-ketoglutarate (α-KG) analog (dimethyl-α-KG), or 2 mM proline. (E) Schematic of carbon contribution to TCA cycle. (F) Basal oxygen consumption rate (OCR) and relative OCR of TDCLs after 1 h of treatment with RPMI, HBSS, or HBSS supplemented with glutamine (Q). (G) The levels of adenosine phosphates (ATP, ADP, and AMP) in Atg7+/+ and Atg7−/− cells in RPMI, HBSS, or HBSS supplemented with glutamine after 1 h of treatment. For all of the graphs, the error bar indicates ±SEM. (*) P < 0.05; (**) P < 0.01; (***) P < 0.001. See also Supplemental Figure S5.
Figure 5.
Figure 5.
Autophagy deficiency alters lipid metabolism. (A,B) Representative Oil Red O staining of KL tumors (A) and KL and KP TDCLs in RPMI and HBSS starvation (B). (C, left) Quantification of Oil Red O staining of TDCLs from ImageJ. (Right) Quantification of Oil Red O staining normalized to RPMI to show significant reduction of LDs in Atg7−/− KL TDCLs in starvation. (D) Comparison of lipids between Atg7+/+ and Atg7−/− cells in nutrient-rich conditions obtained by LC-MS. (E) [U13C6] glucose tracer labeling to FAs of TDCLs in steady state. (F) Cell proliferation rate in the absence or presence of 50 µM FA synthase inhibitor fasnall in a nutrient-rich RPMI condition. For all of the graphs, the error bar indicates ±SEM. (*) P < 0.05; (**) P < 0.01; (***) P < 0.001. See also Supplemental Figure S7.
Figure 6.
Figure 6.
Autophagy deficiency leads to excessive FAO of KL cells in starvation. (A) Comparison of saponified FAs between Atg7+/+ and Atg7−/− cells in HBSS starvation obtained by LC-MS. (B) Saponified FAs with significant change between Atg7+/+ and Atg7−/− cells in HBSS starvation. Each bar represents the average of four clones from Atg7+/+ or Atg7−/− TDCLs. (C) Clonogenic survival assay of Atg7+/+ and Atg7−/− cells in HBSS supplemented with 20 µM bovine serum albumin (BSA) or BSA-conjugated palmitate (BSA-Pal). (D) Basal OCR of TDCLs after 1 h of HBSS starvation supplemented with 20 µM BSA or BSA-Pal. (E) Clonogenic survival assay of TDCLs in HBSS starvation supplemented with vehicle control or 50 µM lipase inhibitor orlistat. (F) Clonogenic survival assay of Atg7+/+ and Atg7−/− KL cells in HBSS or HBSS supplemented with vehicle control or etomoxir (ETO). (G) OCR of TDCLs in the absence or presence of ETO in starvation. Each bar represents the average of four clones from Atg7+/+ or Atg7−/− TDCLs. For all of the graphs, the error bar indicates ±SEM. (**) P < 0.01; (***) P < 0.001.
Figure 7.
Figure 7.
KRAS-driven human lung cancer cells with mutant LKB1 require autophagy to support proliferation and survive starvation. (A) Western blot of ATG7, LC3, p62, and β-actin. (B) Clonogenic survival assay of human lung cancer cells in HBSS starvation. (C) Relative cell proliferation of human lung cancer cells without or with ATG7 knockdown in nutrient-rich RPMI medium. (D) Clonogenic survival assay of human lung cancer cells without or with ATG7 knockdown in HBSS starvation. (E) Clonogenic survival assay of LKB1 mutant human lung cancer cells without or with ATG7 knockdown in HBSS starvation supplemented with 2 mM glutamine or 20 µM BSA or BSA-Pal. (F) Basal OCR and relative OCR of LKB1 mutant human lung cancer cells without or with ATG7 knockdown after 1 h of treatment with RPMI or HBSS supplemented with 20 µM BSA or BSA-Pal. (G) Model of autophagy in supporting LKB1-deficient lung tumor growth. For all of the graphs, the error bar indicates ±SEM. (*) P < 0.05; (***) P < 0.001. See also Supplemental Figure S7.

References

    1. Amaravadi R, Kimmelman AC, White E. 2016. Recent insights into the function of autophagy in cancer. Genes Dev 30: 1913–1930. 10.1101/gad.287524.116 - DOI - PMC - PubMed
    1. Beloribi-Djefaflia S, Vasseur S, Guillaumond F. 2016. Lipid metabolic reprogramming in cancer cells. Oncogenesis 5: e189 10.1038/oncsis.2015.49 - DOI - PMC - PubMed
    1. Bensaad K, Favaro E, Lewis CA, Peck B, Lord S, Collins JM, Pinnick KE, Wigfield S, Buffa FM, Li JL, et al. 2014. Fatty acid uptake and lipid storage induced by HIF-1α contribute to cell growth and survival after hypoxia-reoxygenation. Cell Rep 9: 349–365. 10.1016/j.celrep.2014.08.056 - DOI - PubMed
    1. Bozic I, Antal T, Ohtsuki H, Carter H, Kim D, Chen S, Karchin R, Kinzler KW, Vogelstein B, Nowak MA. 2010. Accumulation of driver and passenger mutations during tumor progression. Proc Natl Acad Sci 107: 18545–18550. 10.1073/pnas.1010978107 - DOI - PMC - PubMed
    1. DuPage M, Dooley AL, Jacks T. 2009. Conditional mouse lung cancer models using adenoviral or lentiviral delivery of Cre recombinase. Nat Protoc 4: 1064–1072. 10.1038/nprot.2009.95 - DOI - PMC - PubMed

Publication types

MeSH terms

Substances