. 2019 Feb 12;116(7):2672-2680.
doi: 10.1073/pnas.1821022116. Epub 2019 Jan 28.

Ferroptosis as a target for protection against cardiomyopathy

Affiliations

Ferroptosis as a target for protection against cardiomyopathy

Xuexian Fang et al. Proc Natl Acad Sci U S A. .

Abstract

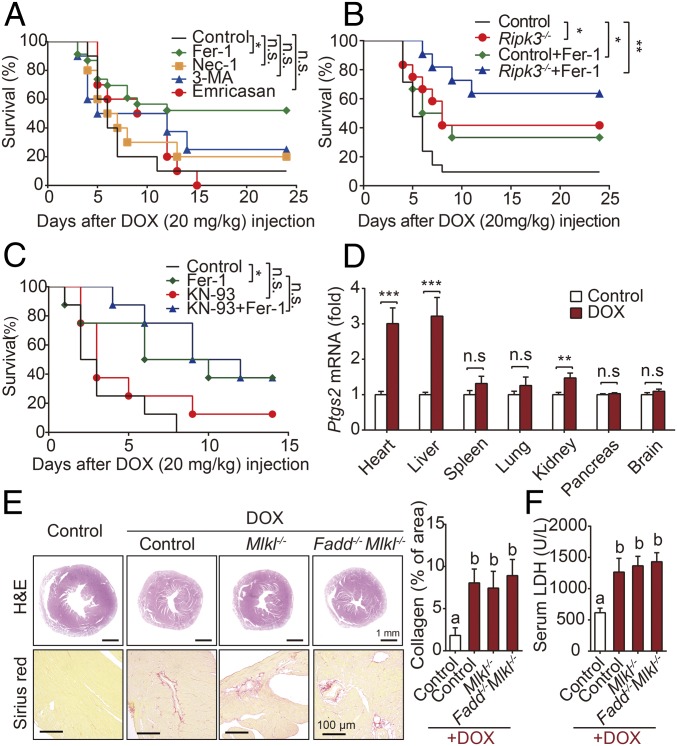
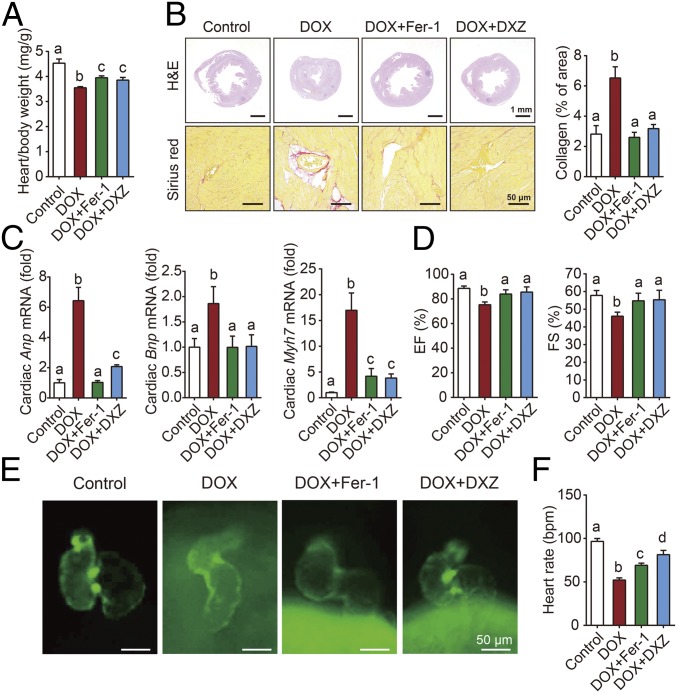
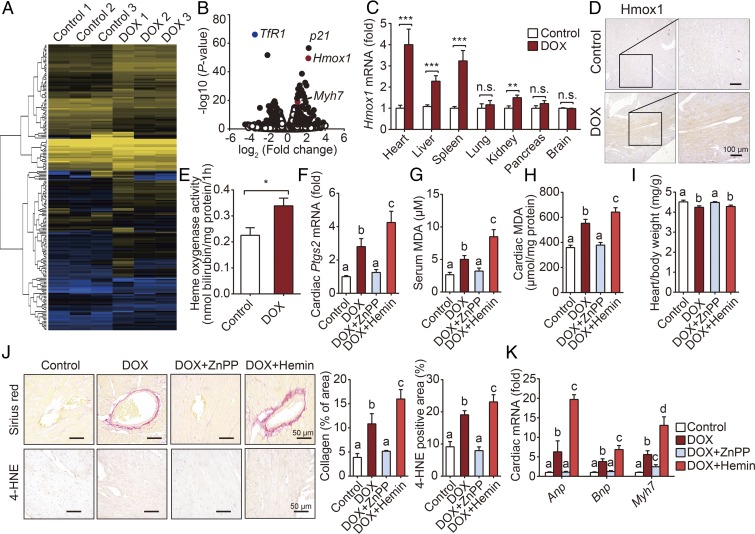
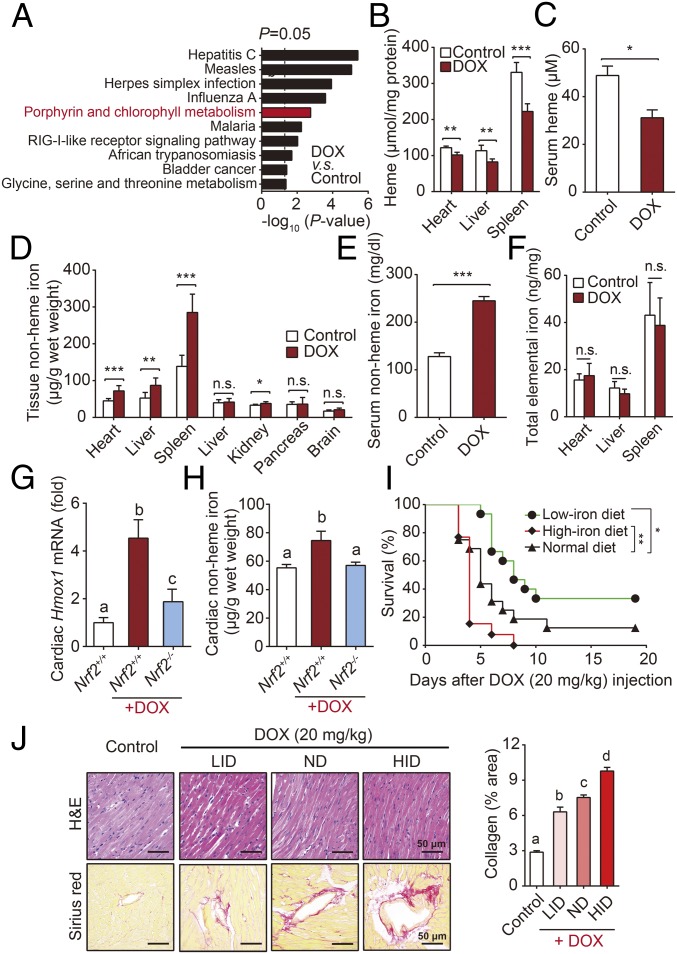
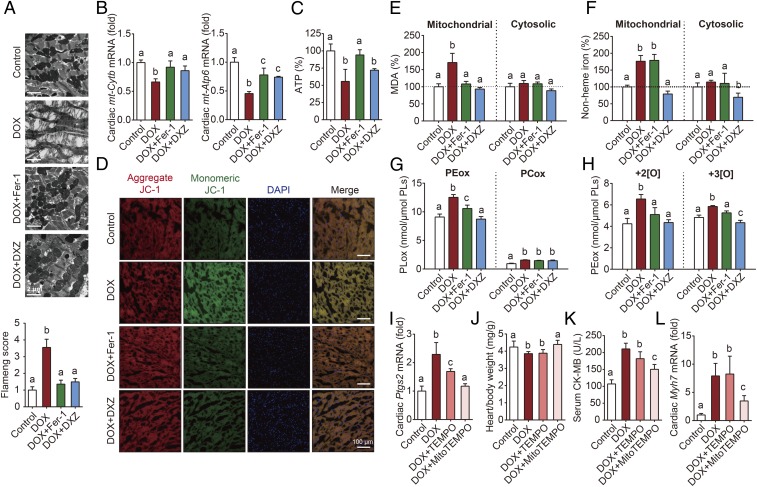
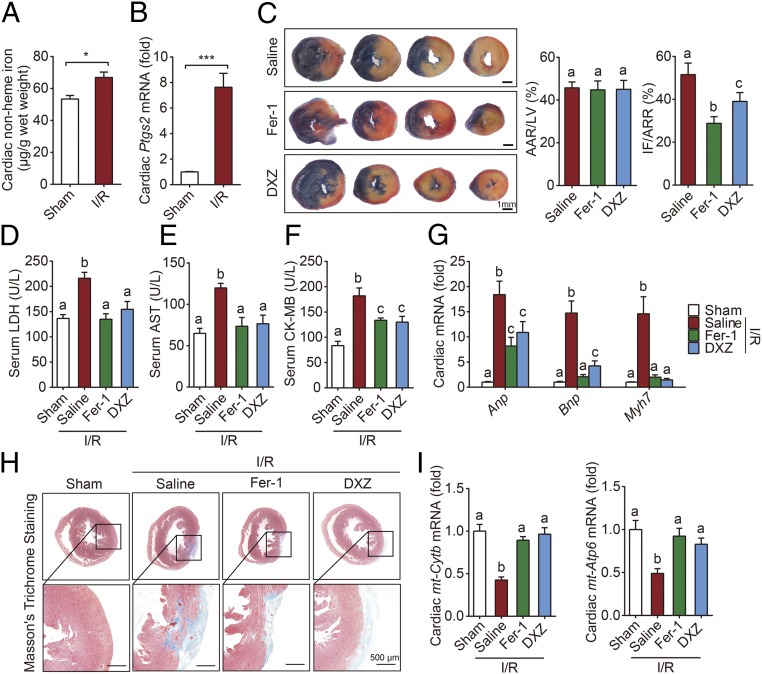
Heart disease is the leading cause of death worldwide. A key pathogenic factor in the development of lethal heart failure is loss of terminally differentiated cardiomyocytes. However, mechanisms of cardiomyocyte death remain unclear. Here, we discovered and demonstrated that ferroptosis, a programmed iron-dependent cell death, as a mechanism in murine models of doxorubicin (DOX)- and ischemia/reperfusion (I/R)-induced cardiomyopathy. In canonical apoptosis and/or necroptosis-defective Ripk3-/-, Mlkl-/-, or Fadd-/-Mlkl-/- mice, DOX-treated cardiomyocytes showed features of typical ferroptotic cell death. Consistently, compared with dexrazoxane, the only FDA-approved drug for treating DOX-induced cardiotoxicity, inhibition of ferroptosis by ferrostatin-1 significantly reduced DOX cardiomyopathy. RNA-sequencing results revealed that heme oxygenase-1 (Hmox1) was significantly up-regulated in DOX-treated murine hearts. Administering DOX to mice induced cardiomyopathy with a rapid, systemic accumulation of nonheme iron via heme degradation by Nrf2-mediated up-regulation of Hmox1, which effect was abolished in Nrf2-deficent mice. Conversely, zinc protoporphyrin IX, an Hmox1 antagonist, protected the DOX-treated mice, suggesting free iron released on heme degradation is necessary and sufficient to induce cardiac injury. Given that ferroptosis is driven by damage to lipid membranes, we further investigated and found that excess free iron accumulated in mitochondria and caused lipid peroxidation on its membrane. Mitochondria-targeted antioxidant MitoTEMPO significantly rescued DOX cardiomyopathy, supporting oxidative damage of mitochondria as a major mechanism in ferroptosis-induced heart damage. Importantly, ferrostatin-1 and iron chelation also ameliorated heart failure induced by both acute and chronic I/R in mice. These findings highlight that targeting ferroptosis serves as a cardioprotective strategy for cardiomyopathy prevention.

Keywords: cell death; ferroptosis; heart injury; iron; mitochondria.


Conflict of interest statement

The authors declare no conflict of interest.

Figures

Fig. 1.
Fig. 1.
Myocardial ferroptosis dominates DOX-induced mortality. (A) Kaplan–Meier survival curves of mice pretreated with saline (control), Fer-1 (a ferroptosis inhibitor), 3-MA (an autophagy inhibitor), emricasan (a pan-caspase inhibitor), or Nec-1 (a necroptosis inhibitor), followed by DOX (20 mg/kg, i.p.) on day 0 (n = 10–15 mice per group). (B) Kaplan–Meier survival curves of the indicated mice (control and Ripk3−/−) treated with or without Fer-1 followed by DOX (20 mg/kg, i.p.) (n = 10–12 mice per group). (C) Kaplan–Meier survival curves of the indicated mice treated with KN-93 and/or Fer-1 followed by DOX (20 mg/kg, i.p.) (n = 10–12 mice per group). (D) Relative levels of Ptgs2 mRNA were measured in the indicated organs injected with DOX (10 mg/kg, i.p.) or saline (control) for 4 d. (n = 8 mice per group). (E) Representative images and quantitative analyses of H&E and Sirius red staining of heart sections in control, Mlkl/, and Fadd−/−Mlkl−/− mice 4 d after control or DOX treatment (10 mg/kg, i.p.). (F) Serum LDH levels were measured in control, Mlkl/, and Fadd−/−Mlkl−/− mice 4 d after control or DOX treatment (n = 6–8 mice per group). Summary data are presented as the mean ± SEM. Significance in AC was calculated using the log-rank (Mantel–Cox) test. Significance in D was calculated using the Student’s t test; **P < 0.01; ***P < 0.001. Significance in E and F was calculated using a one-way ANOVA with Tukey’s post hoc test; groups labeled with different letters differed significantly (P < 0.05). *P < 0.05; n.s., not significant.
Fig. 2.
Fig. 2.
Fer-1 and DXZ prevent DOX-induced cardiomyopathy. (A) The heart/body weight ratio was measured in control mice and mice treated with DOX with or without Fer-1 or DXZ (n = 6 mice per group). (B) Cardiac sections were prepared from control mice and mice treated with DOX with or without Fer-1 or DXZ, and then stained with hematoxylin and eosin (H&E, Top) or Sirius red (Bottom). (C) Relative mRNA levels of the cardiac hypertrophy biomarkers Anp, Bnp, and Myh7 in control mice and mice treated with DOX with or without Fer-1 or DXZ (n = 6 mice per group). (D) Echocardiographic analyses of cardiac function in control mice and mice treated with DOX with or without Fer-1 or DXZ (n = 6 mice per group). EF, ejection fraction; FS, fractional shortening. (E) Representative fluorescence microscopy images of Tg(cmlc2: GFP) zebrafish embryos with green fluorescent protein (GFP) specifically expressed in the myocardial cells. Zebrafish [2 d postfertilization (dpf)] were exposed to 65 µM DOX in combination with Fer-1 (1 μM) and DXZ (200 μM) for 2 d. (F) Heart rate levels were measured in zebrafish (2 dpf) treated with DOX together with or without Fer-1 or DXZ for 2 d (n = 6–8 per group). Summary data are presented as the mean ± SEM. Significance was calculated using a one-way ANOVA with Tukey’s post hoc test; groups labeled with different letters differed significantly (P < 0.05).
Fig. 3.
Fig. 3.
Hmox1 is essential for DOX-induced ferroptosis and cardiotoxicity. (A) Heat map showing differentially expressed genes in cardiac tissue between control and DOX-treated mice. Low expression is depicted in blue, and high expression is depicted in yellow. (B) Volcano plot showing the up-regulated and down-regulated genes in response to DOX treatment measured using RNA-seq analysis. Solid symbols indicate genes in which the differential expression was statistically significant. (C) Hmox1 mRNA was measured in the indicated organs of control and DOX-treated mice and is expressed relative to the respective control group (n = 8 mice per group). (D) Representative images of Hmox1-stained heart sections from control mice and DOX-treated mice. (E) Heme oxygenase activity was measured in heart homogenates obtained from control and DOX-treated mice (n = 6 mice per group). (FH) Cardiac Ptgs2 mRNA (F), serum MDA (G), and cardiac MDA (H) levels were measured in control mice and mice treated with DOX with or without ZnPP or hemin (n = 6–7 mice per group). (I) Heart/body weight ratio was measured in control mice and mice treated with DOX with or without ZnPP or hemin (n = 6–7 mice per group). (J) Representative images (Left) and quantitative analyses (Right) of cardiac sections stained with Sirius red (to stain collagen; Top) and anti–4-HNE (Bottom) in control mice and mice treated with DOX with or without ZnPP or hemin. (K) Cardiac levels of Anp, Bnp, and Myh7 mRNA were measured in control mice and mice treated with DOX with or without ZnPP or hemin (n = 6–7 mice per group). Summary data are presented as the mean ± SEM. Significance in C and E was calculated using the Student’s t test; *P < 0.05; **P < 0.01; ***P < 0.001. Significance in FK was calculated using a one-way ANOVA with Tukey’s post hoc test; groups labeled with different letters differed significantly (P < 0.05).
Fig. 4.
Fig. 4.
Free iron released from heme degradation by Nrf2/Hmox1 pathway triggers cardiac injury. (A) KEGG pathway analysis of RNA-seq data. (B and C) Heme levels in the heart, liver, and spleen (B), and serum heme levels (C) were measured in mice injected with DOX (10 mg/kg, i.p.) or saline (control) for 4 d (n = 8 mice per group). (D and E) Nonheme iron levels in the heart, liver, spleen, lung, kidney, pancreas, and brain (D), and serum nonheme iron levels (E) were measured in mice injected with DOX (10 mg/kg, i.p.) or saline (control) for 4 d (n = 8 mice per group). (F) Total tissue iron levels were measured 4 d after DOX or control treatment (n = 8 mice per group). (G and H) Relative Hmox1 mRNA (G) and nonheme iron (H) levels in the hearts were measured in WT mice, DOX-treated Nrf2−/− and Nrf2+/+ mice, n = 4–6 mice per group. (I) Kaplan–Meier survival curves of mice fed a low-iron diet, normal diet, or high-iron diet, then injected with DOX (20 mg/kg, i.p.) (n = 13–16 mice per group). (J) Cardiac tissue sections were prepared from the mice in D and stained with H&E (Top) or Sirius red (Bottom). Control mice were fed a normal diet and were not treated with DOX. Summary data are presented as the mean ± SEM. Significance in BF was calculated using the Student’s t test; *P < 0.05; **P < 0.01; ***P < 0.001. Significance in G, H, and J was calculated using a one-way ANOVA with Tukey’s post hoc test; groups labeled with different letters differed significantly (P < 0.05). Significance in I was calculated using the log-rank (Mantel–Cox) test.
Fig. 5.
Fig. 5.
Mitochondrial iron overload and lipid peroxidation play a key role in DOX-induced myocardial ferroptosis. (A) Representative transmission electron microscopy images and corresponding relative Flameng scores (Bottom) for cardiac tissue obtained from control and mice treated with DOX with or without Fer-1 or DXZ. (B and C) Cardiac mt-Cytb and mt-Atp6 mRNA levels (B) and cardiac ATP (C) were measured in control mice and mice treated with DOX with or without Fer-1 or DXZ (n = 6–7 mice per group). (D) Representative images of cardiac JC-1 fluorescence in control mice and mice treated with DOX with or without Fer-1 or DXZ. (E and F) Cardiac mitochondrial and cytosolic MDA levels (E) and mitochondrial and cytosolic nonheme iron (F) were measured in control mice and mice treated with DOX with or without Fer-1 or DXZ (n = 6–7 mice per group). (G and H) Cardiac PEox and PCox (G) and dioxide and trioxide PEox species (H) were measured in control mice and DOX mice treated with or without Fer-1 or DXZ. (IL) Cardiac Ptgs2 mRNA (I), the heart/body weight ratio (J), serum CK-MB levels (K), and cardiac Myh7 mRNA (L) were measured in control mice and mice treated with DOX with or without TEMPO or MitoTEMPO (n = 6 mice per group). Summary data are presented as the mean ± SEM. Significance was calculated using a one-way ANOVA with Tukey’s post hoc test; groups labeled with different letters differed significantly (P < 0.05).
Fig. 6.
Fig. 6.
Blocking ferroptosis protects the heart against I/R injury. (A and B) Cardiac nonheme iron levels (A) and cardiac Ptgs2 mRNA levels (B) were measured in mice subjected to sham surgery or 30-min cardiac ischemia followed by 24 h of reperfusion (I/R) (n = 6–8 mice per group). (C) Representative images (Left) and quantitative data (Right) for infarct size (IF) and relative area at risk (AAR) in heart sections obtained from mice subjected to 30 min/24 h I/R injury and treated with saline (control), Fer-1, or DXZ. (DG) Serum LDH levels (D), AST levels (E), CK-MB levels (F), and cardiac Anp, Bnp, and Myh7 mRNA (G) measured in mice subjected to sham surgery or 30 min/24 h I/R injury and treated with saline, Fer-1, or DXZ (n = 6–8 mice per group). (H) Representative images of Masson’s trichrome staining of heart sections obtained from mice subjected to sham surgery or 30 min/4 wk I/R injury and treated with saline, Fer-1, or DXZ. (I) Cardiac mt-Cytb and mt-Atp6 mRNA levels were measured in mice subjected to sham surgery or 30 min/24 h I/R injury and treated with saline, Fer-1, or DXZ (n = 6–8 mice per group). Summary data are presented as the mean ± SEM. Significance in A and B was calculated using the Student’s t test; *P < 0.05; ***P < 0.001. Significance in CG and I was calculated using a one-way ANOVA with Tukey’s post hoc test; groups labeled with different letters differed significantly (P < 0.05).

Comment in

References

    1. Fuchs Y, Steller H. Programmed cell death in animal development and disease. Cell. 2011;147:742–758. - PMC - PubMed
    1. Conrad M, Angeli JP, Vandenabeele P, Stockwell BR. Regulated necrosis: Disease relevance and therapeutic opportunities. Nat Rev Drug Discov. 2016;15:348–366. - PMC - PubMed
    1. Dixon SJ, et al. Ferroptosis: An iron-dependent form of nonapoptotic cell death. Cell. 2012;149:1060–1072. - PMC - PubMed
    1. Stockwell BR, et al. Ferroptosis: A regulated cell death nexus linking metabolism, redox biology, and disease. Cell. 2017;171:273–285. - PMC - PubMed
    1. Linkermann A, et al. Synchronized renal tubular cell death involves ferroptosis. Proc Natl Acad Sci USA. 2014;111:16836–16841. - PMC - PubMed

Publication types

MeSH terms