. 2019 Feb 12;116(7):2488-2493.
doi: 10.1073/pnas.1818134116. Epub 2019 Jan 28.

Fluorescent reconstitution on deposition of PM2.5 in lung and extrapulmonary organs

Affiliations

Fluorescent reconstitution on deposition of PM2.5 in lung and extrapulmonary organs

Donghai Li et al. Proc Natl Acad Sci U S A. .

Abstract

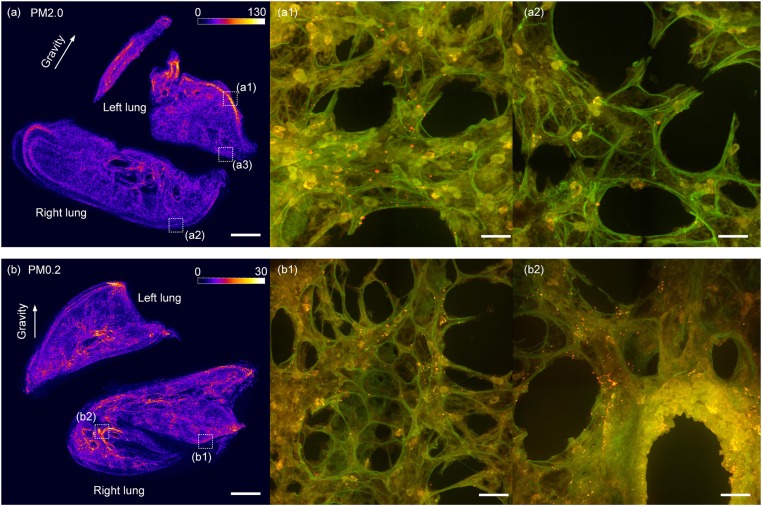
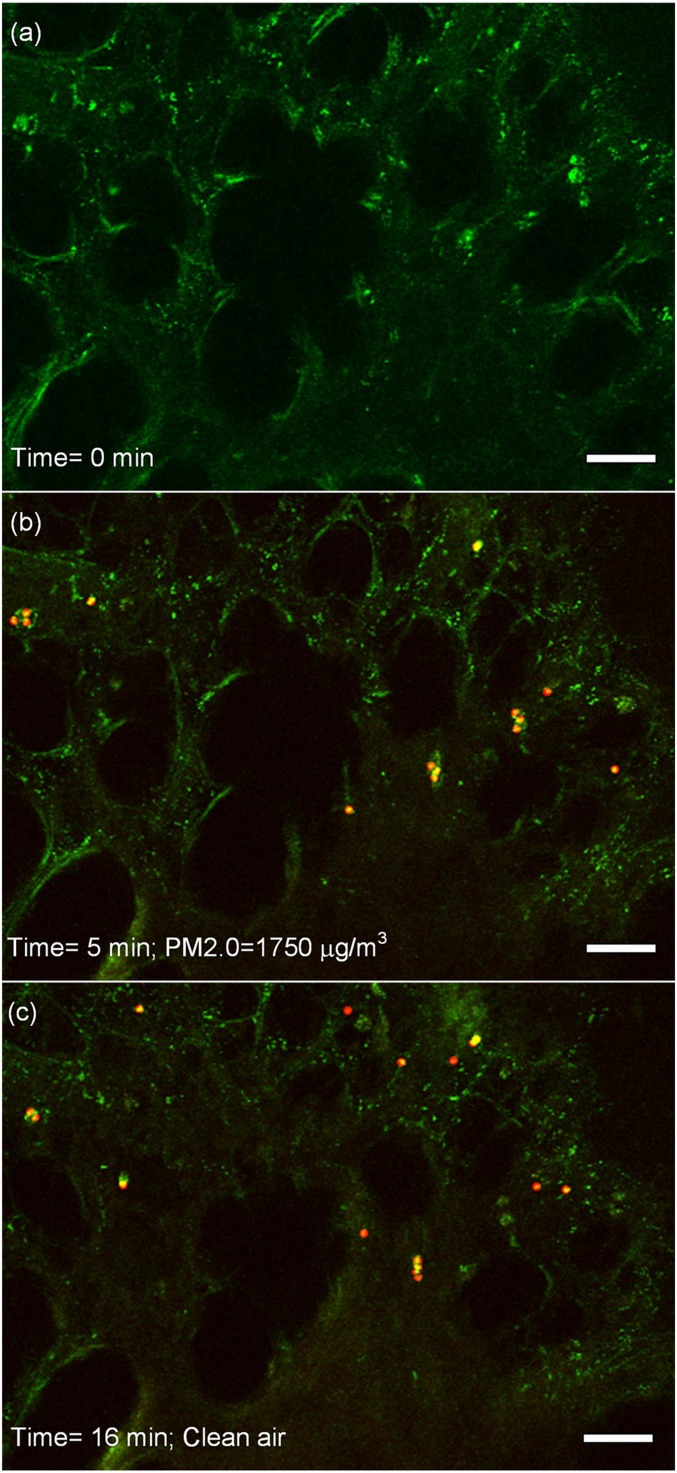
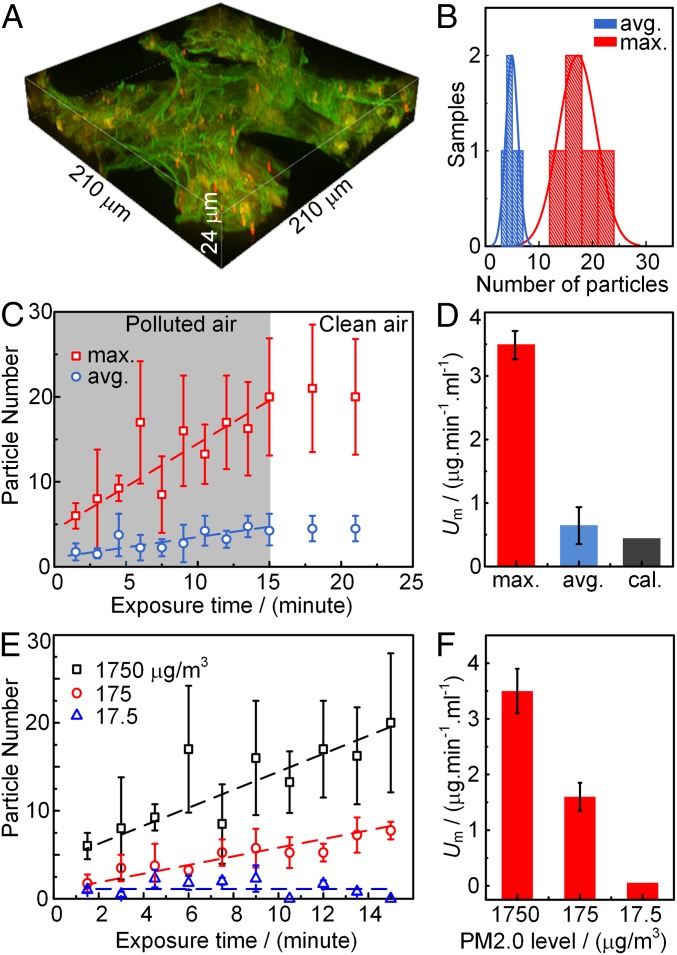
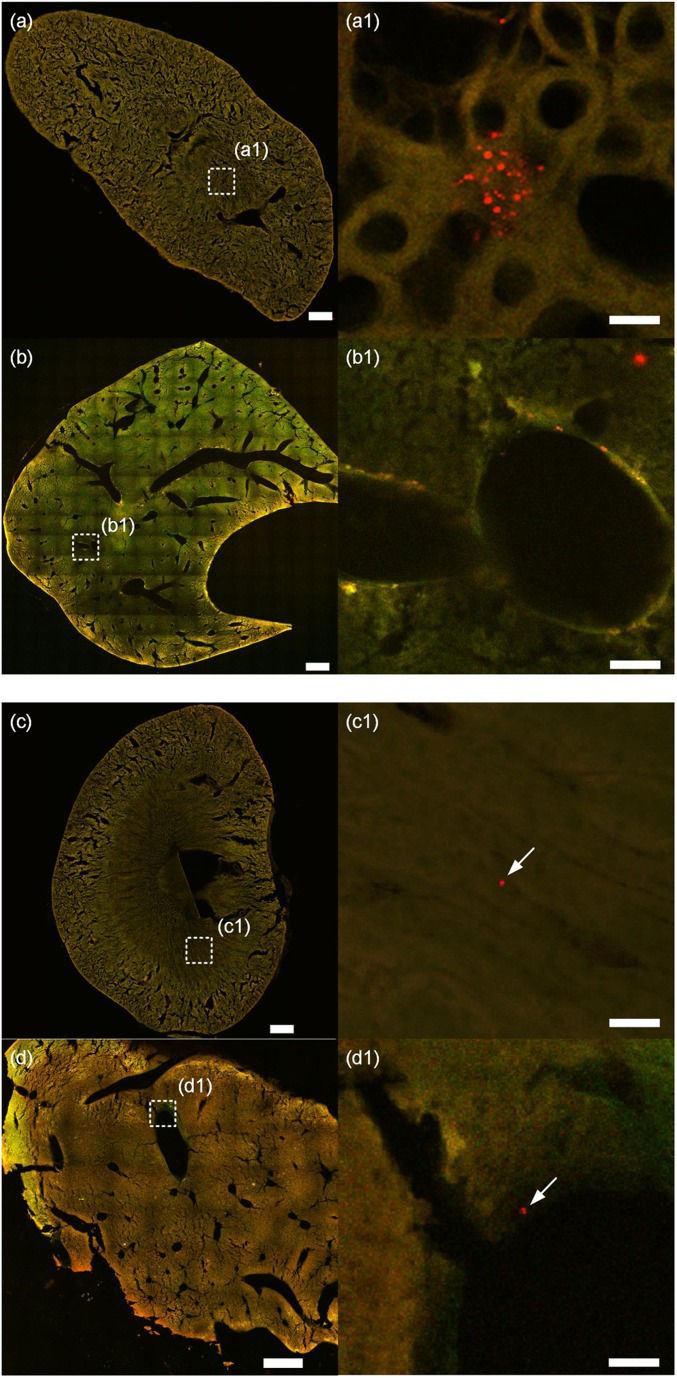
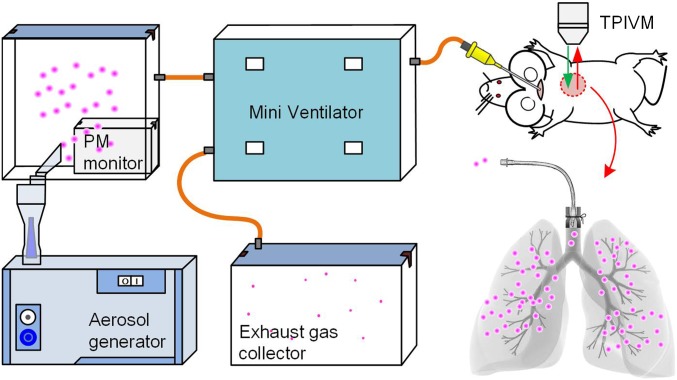
The deposition of PM2.5 (fine particulate matter in air with diameter smaller than 2.5 μm) in lungs is harmful to human health. However, real-time observation on the deposition of particles in the acinar area of the lung is still a challenge in experiments. Here, a fluorescent imaging method is developed to visualize the deposition process with a high temporal and spatial resolution. The observations reveal that the deposition pattern is nonuniform, and the maximum deposition rate in the acinar area differs significantly from the prediction of the widely used average deposition model. The method is also used to find single particles in the kidney and liver, though such particles are commonly believed to be too large to enter the extrapulmonary organs.

Keywords: PM2.5; air pollution; extrapulmonary organs; lung; particle deposition.


Conflict of interest statement

The authors declare no conflict of interest.

Figures

Fig. 1.
Fig. 1.
The fluorescent deposition patterns of PM2.0 and PM0.2 particles in lungs. A and B are the deposition patterns of PM2.0 and PM0.2 in a mouse lung by the fluorescent intensity, respectively. A1 and A2 show the high and low concentrations of PM2.0 particles in two local areas at the left and right edges, respectively, of a mouse lung. (B) A more uniform deposition pattern of PM0.2 in the lung with equivalent fluorescent intensity on the left and right edges of the lung. (B1) There are still a lot of PM0.2 particles in a local acinar area at the right edge of the right lung. (B2) More PM0.2 particles deposit in the bronchiole region. The red and the orange dots in A1, A2, B1, and B2 are fluorescent PM2.0 particles. (The scale bars in A and B are 1 mm, while in the other four images are 20 μm.)
Fig. 2.
Fig. 2.
The real-time observation on the deposition of PM2.0. The tissue has a green color, while the red and yellow dots are the particles. (A) The acinar region before the ventilation of particles, and no particles are seen. (B) The deposition of PM2.0 in the area at 5 min under the PM2.0 level of 1,750 μg/m3. (C) The deposition of PM2.0 in the area at 16 min. At this moment, the PM2.0 level is 0 μg/m3, and the clean air has already been ventilated for 1 min. The scale bars in the images are 20 μm. The video of the deposition process is provided in Movie S1. The deposition process of PM0.2 is also measured, and the images are provided in SI Appendix, Fig. S3.
Fig. 3.
Fig. 3.
The deposition rates of PM2.0 in the selected local areas. (A) The 3D image of the PM2.0 in a local area. (B) The statistic particle number in the local areas in the high-concentration region (max.) and in the medium concentration region (avg.) in 15 min. (C) The maximum and average deposition rates of PM2.0 in the two local areas. The dash lines are the best fitting of the deposition rate in the polluted air condition with PM2.0 level of 1,750 μg/m3. (D) The maximum (max.) and average (avg.) mass deposition rates of PM2.0 compared with the calculated (cal.) mass deposition rate from the average deposition model. (E) The maximum deposition rates of PM2.0 in the local area under three PM2.0 levels. (F) The maximum deposition rates of PM2.0 under three PM2.0 levels.
Fig. 4.
Fig. 4.
Deposition of PM0.2 and PM2.0 particles in extrapulmonary organs. A and B are the cross-section of a kidney and liver, respectively, with the deposition of PM0.2 particles. A1 is the amplified image of the region marked in A. Red dots are fluorescent particles, and the back ground pattern is the structure of the medullary renal tubule of kidney. B1 is the amplified image of the region in B. Fluorescent particles are found on the wall of the lobular sinus of the liver. C and D are the deposition of PM2.0 on the cross-section of kidney and liver, respectively. C1 is the amplified image of the region marked in C. A fluorescent particle is found on the background pattern of the medullary of the kidney. D1 is the amplified image of the region marked in D. A red fluorescent particle is found on the wall of a lobular sinus of the liver. (The scale bars in AD are 0.5 mm, in A1 and B1 are 10 μm, and in C1 and D1 are 20 μm.)
Fig. 5.
Fig. 5.
Schematics of the inhalation experiment in vivo. This inhalation experiment system consists of PMs generator, PMs monitor, mini ventilation, and a two-photon imaging microscope. A small incision was made in the trachea 3–4 mm below the throat, and a tracheal cannula was inserted and well sealed by the suture.

References

    1. Kaiser J. Epidemiology. Mounting evidence indicts fine-particle pollution. Science. 2005;307:1858–1861. - PubMed
    1. Rattanapinyopituk K, et al. Ultrastructural changes in the air-blood barrier in mice after intratracheal instillations of Asian sand dust and gold nanoparticles. Exp Toxicol Pathol. 2013;65:1043–1051. - PubMed
    1. Pyne S. Air pollution. Small particles add up to big disease risk. Science. 2002;295:1994. - PubMed
    1. Xu T, et al. Estimated individual inhaled dose of fine particles and indicators of lung function: A pilot study among Chinese young adults. Environ Pollut. 2018;235:505–513. - PubMed
    1. Raaschou-Nielsen O, et al. Air pollution and lung cancer incidence in 17 European cohorts: Prospective analyses from the European Study of Cohorts for Air Pollution Effects (ESCAPE) Lancet Oncol. 2013;14:813–822. - PubMed

Publication types

Substances

LinkOut - more resources