. 2019 Jan 28;10(1):470.
doi: 10.1038/s41467-018-08205-7.

Deconvolution of single-cell multi-omics layers reveals regulatory heterogeneity

Affiliations

Deconvolution of single-cell multi-omics layers reveals regulatory heterogeneity

Longqi Liu et al. Nat Commun. .

Abstract

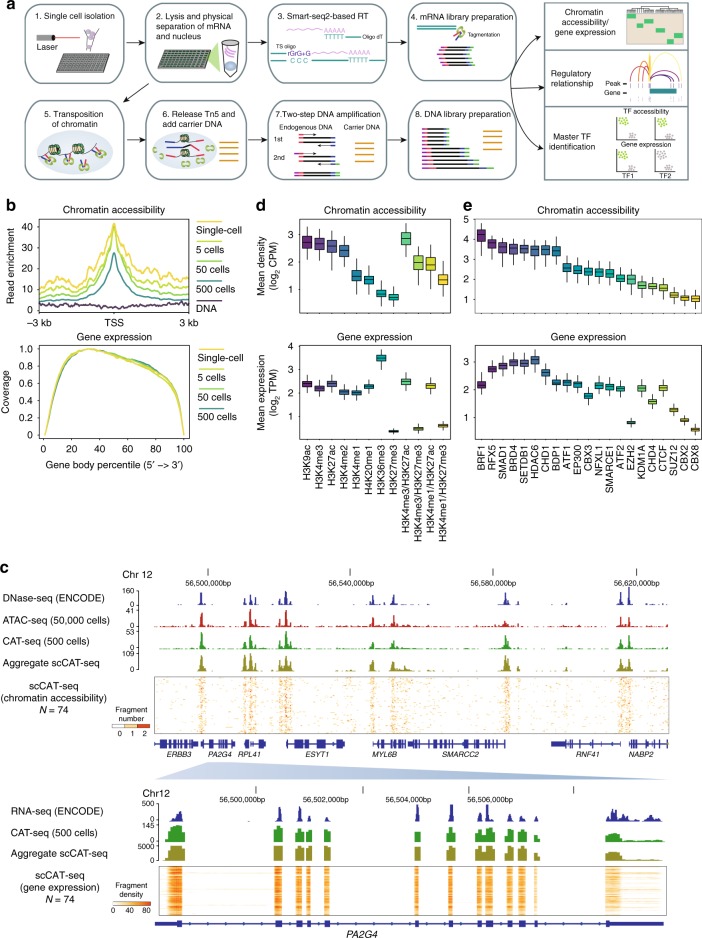
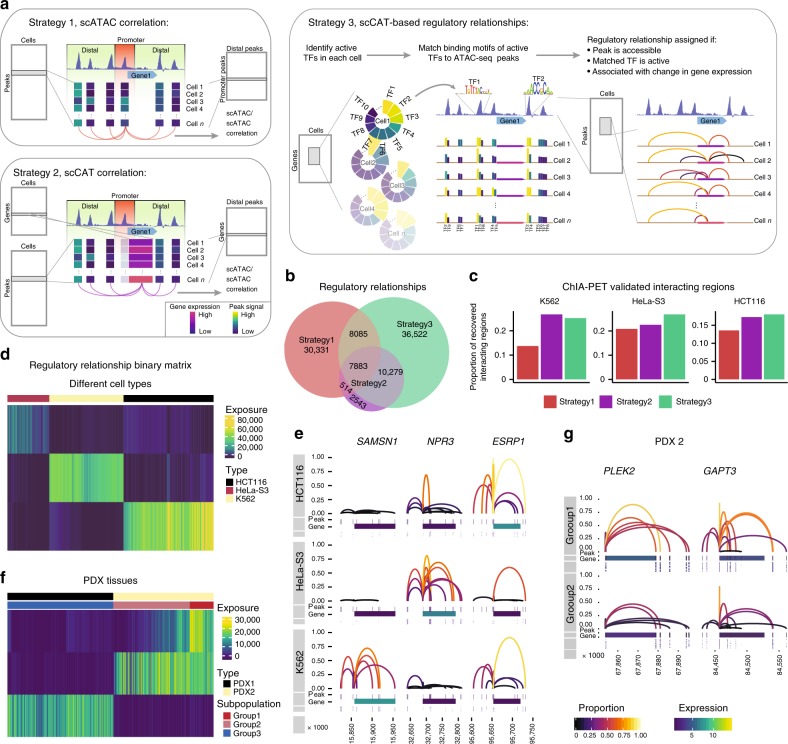
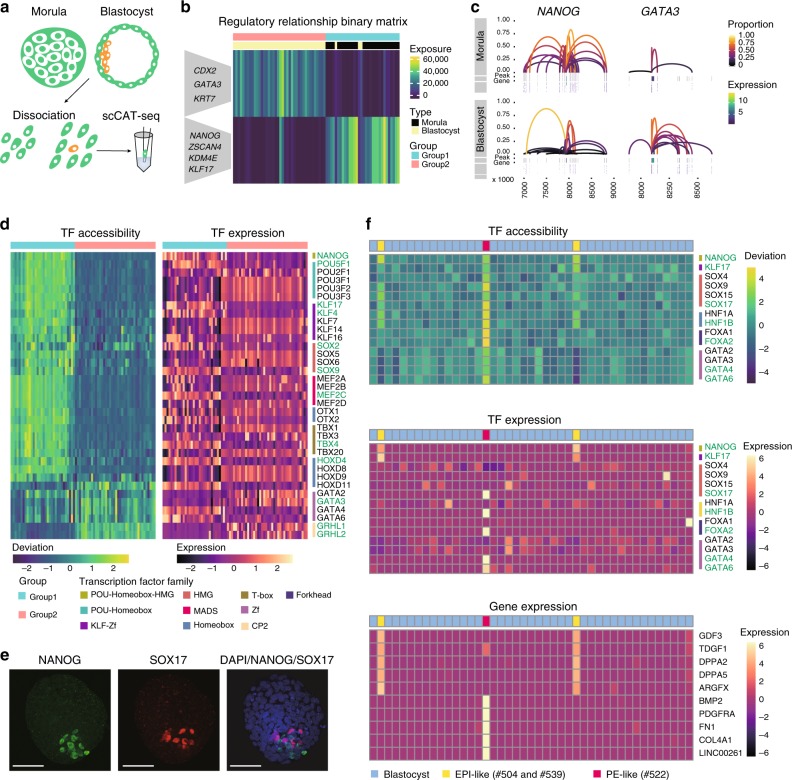
Integrative analysis of multi-omics layers at single cell level is critical for accurate dissection of cell-to-cell variation within certain cell populations. Here we report scCAT-seq, a technique for simultaneously assaying chromatin accessibility and the transcriptome within the same single cell. We show that the combined single cell signatures enable accurate construction of regulatory relationships between cis-regulatory elements and the target genes at single-cell resolution, providing a new dimension of features that helps direct discovery of regulatory patterns specific to distinct cell identities. Moreover, we generate the first single cell integrated map of chromatin accessibility and transcriptome in early embryos and demonstrate the robustness of scCAT-seq in the precise dissection of master transcription factors in cells of distinct states. The ability to obtain these two layers of omics data will help provide more accurate definitions of "single cell state" and enable the deconvolution of regulatory heterogeneity from complex cell populations.


Conflict of interest statement

The authors declare no competing interests.

Figures

Fig. 1
Fig. 1
scCAT-seq provides an accurate genome-wide measure of both chromatin accessibility and gene expression. a Overview of the scCAT-seq protocol. b Top panel: chromatin accessibility read enrichment around the transcription start site (TSS). Bottom panel: coverage of mRNA reads along the body of transcripts. Titration series (one single-cell, 5 cells, 50 cells, 500 cells) were marked by the indicated colors. All profiles were generated using the scCAT-seq protocol with the indicated number of cells as input. c A representative region showing a consistent pattern of chromatin accessibility and gene expression across datasets generated using different number of input cells. The bulk ATAC-seq track was generated using 50,000 K562 cells. The DNase-seq and bulk RNA-seq data of K562 cells were downloaded from ENCODE. The scCAT-seq tracks are chromatin accessibility (upper) and gene expression read density (bottom) from a total of 74 K562 single cells. d Top panel: mean chromatin accessibility read density around regions that are enriched by the indicated individual or combined histone modifications. Bottom panel: mean expression level of genes associated with regions that are enriched by the indicated individual or combined histone modifications. e Top panel: mean chromatin accessibility read density within regions that are bound by the indicated transcription factors. Bottom panel: mean expression level of genes associated with regions that are bound by the indicated transcription factors
Fig. 2
Fig. 2
Inferring regulatory relationships between CREs and genes by scCAT-seq. a Overview of three strategies for inferring regulatory relationships. Strategy 1: regulatory links for every gene were assigned when the Spearman correlation of the signal of peaks located at the promoter and distal peaks was above 0.25. Strategy 2: the regulatory links were assigned if the Spearman correlation between the gene expression and the signal of distal peaks was above 0.25. Strategy 3: active transcription factors for every cell were identified by SCENIC, then active regions were identified by matching the binding motifs of active transcription factors to accessible regions. Then regulatory relationships were assigned after applying a Wilcoxon test to determine if the presence of a nearby active accessible region was associated with a significant change in the target gene expression (P-value < 0.05). b Venn plot showing the number of overlapping regulatory relationships identified by the three strategies. c Proportion of ChIA-PET validated regulatory relationships identified by the three strategies in K562 (left), HeLa-S3 (middle), and HCT116 (right) single cells. d, f Heatmaps showing exposure scores of all cells to each signature identified by the NMF clustering of regulatory relationship binary matrices of cell lines (d) and PDXs (f). The exposure score represents the contributions of the signatures to the different samples. e, g Regulatory relationships for the indicated genes in single-cell groups of the cell lines (e) and PDX2 (g). Each panel contains three tracks: the top track shows the regulatory relationship between one peak and the gene (linking them with an arch), where the height and color of the arch show the proportion of cells that share the regulatory relationships; the middle track shows the genomic location of the gene and the associated peaks, where the color of the gene shows the mean expression in each cell type; the bottom track shows the accessible states (on and off) for each peak in each single cell
Fig. 3
Fig. 3
scCAT-seq enables precise characterization of single-cell identities in human pre-implantation embryos. a A workflow showing the generation of scCAT-seq profiles of human pre-implantation embryos. b Heatmap showing exposure scores of all cells to each signature identified by the NMF clustering of regulatory relationship binary matrix of human embryos. Example genes are shown. c Regulatory relationships for the indicated genes in single cells of the morula and blastocyst stage. d Heatmaps showing accessibility deviation (left) and expression level (right) of the indicated TFs. The TFs colored in green were the ones showing consistent patterns in accessibility and gene expression. e Immunofluorescence imaging of the human blastocyst stage embryo using the indicated antibodies (left to right: NANOG, SOX17 and merged DAPI/NANOG/SOX17). Scale bar represents 50 μm. f Top and middle panels: Heatmaps showing the accessibility deviation (top) and expression level (middle) of the indicated TFs in single cells of blastocyst-stage embryos. Bottom panel: heatmap showing the expression level of the indicated genes. The TFs coloured in green were the ones showing consistent patterns in accessibility and gene expression

References

    1. Shapiro E, Biezuner T, Linnarsson S. Single-cell sequencing-based technologies will revolutionize whole-organism science. Nat. Rev. Genet. 2013;14:618–630. doi: 10.1038/nrg3542. - DOI - PubMed
    1. Zong C, Lu S, Chapman AR, Xie XS. Genome-wide detection of single-nucleotide and copy-number variations of a single human cell. Science. 2012;338:1622–1626. doi: 10.1126/science.1229164. - DOI - PMC - PubMed
    1. Xu X, et al. Single-cell exome sequencing reveals single-nucleotide mutation characteristics of a kidney tumor. Cell. 2012;148:886–895. doi: 10.1016/j.cell.2012.02.025. - DOI - PMC - PubMed
    1. Hou Y, et al. Single-cell exome sequencing and monoclonal evolution of a JAK2-negative myeloproliferative neoplasm. Cell. 2012;148:873–885. doi: 10.1016/j.cell.2012.02.028. - DOI - PubMed
    1. Guo H, et al. Single-cell methylome landscapes of mouse embryonic stem cells and early embryos analyzed using reduced representation bisulfite sequencing. Genome Res. 2013;23:2126–2135. doi: 10.1101/gr.161679.113. - DOI - PMC - PubMed

Publication types