. 2019 Jan 28;9(1):1105.
doi: 10.1038/s41598-018-37196-0.

Discrete Structure of the Brain Rhythms

Affiliations

Discrete Structure of the Brain Rhythms

L Perotti et al. Sci Rep. .

Abstract

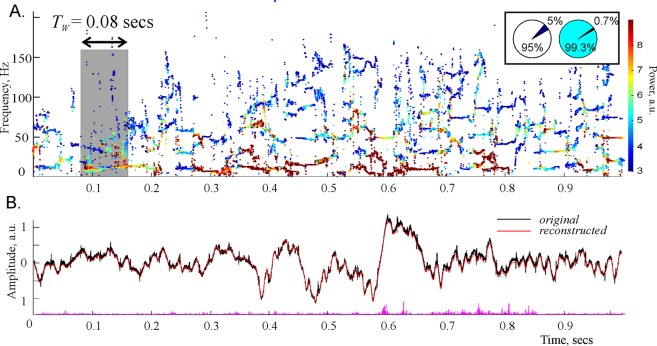
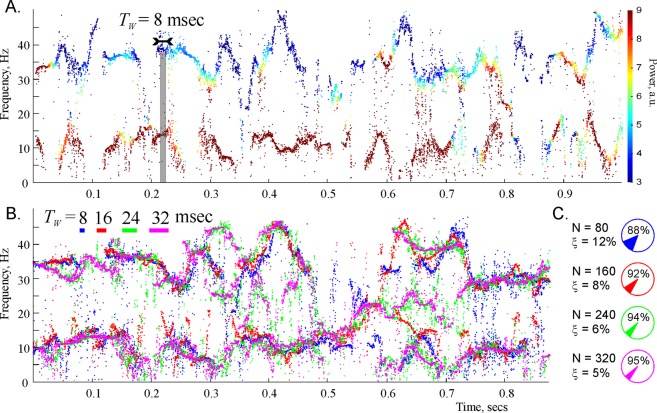
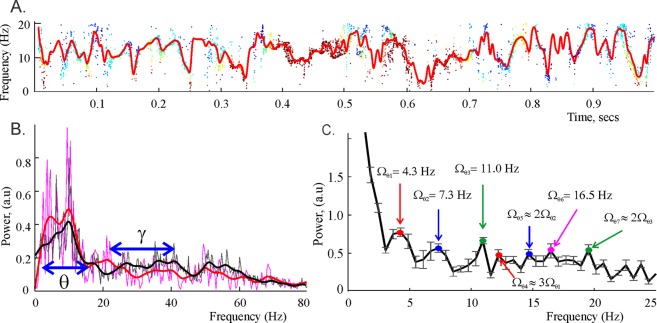
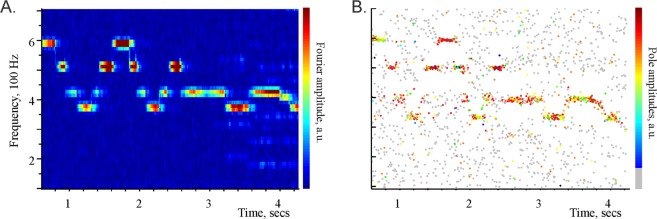
Neuronal activity in the brain generates synchronous oscillations of the Local Field Potential (LFP). The traditional analyses of the LFPs are based on decomposing the signal into simpler components, such as sinusoidal harmonics. However, a common drawback of such methods is that the decomposition primitives are usually presumed from the onset, which may bias our understanding of the signal's structure. Here, we introduce an alternative approach that allows an impartial, high resolution, hands-off decomposition of the brain waves into a small number of discrete, frequency-modulated oscillatory processes, which we call oscillons. In particular, we demonstrate that mouse hippocampal LFP contain a single oscillon that occupies the θ-frequency band and a couple of γ-oscillons that correspond, respectively, to slow and fast γ-waves. Since the oscillons were identified empirically, they may represent the actual, physical structure of synchronous oscillations in neuronal ensembles, whereas Fourier-defined "brain waves" are nothing but poorly resolved oscillons.


Conflict of interest statement

The authors declare no competing interests.

Figures

Figure 1
Figure 1
Padé spectrograms of the hippocampal LFP signal. (A) Discrete Padé Spectrogram (DPS) produced for the LFP signal recorded in the CA1 region of the rodent hippocampus at the sampling rate 10 kHz. At each moment of time, the vertical cross section of the spectrogram gives the instantaneous set of the regular frequencies. At consecutive moments of time, these frequencies produce distinct, contiguous traces, which can be regarded as timelines of discrete oscillatory processes—the spectral waves with varying frequencies ωq(t), amplitudes Aq(t) (shown by the color of dots) and phases ψq(t) (not shown). Note that the higher frequency spectral waves tend to have lower amplitudes. Highest amplitudes appear in the θ-region, i.e. in the frequency range between 4 and 12 Hz. The spectral waves above 100 Hz tend to be scarce and discontinuous, representing time-localized splashes of LFP. The width of the time window is TW = 0.08 sec (800 data points). The pie diagrams in the box show that stable harmonics constitute only 5% of their total number, but carry over 99% of the signal’s power. (B) The LFP signal reconstructed from the regular poles (red trace) closely matches the original signal (black trace) over its entire length, which demonstrates that the oscillon decomposition (2) provides an accurate representation of the signal. The difference between the original and the reconstructed signal is due to the removed noise component—the discarded “irregular” harmonics (the magenta “grass” along the x-axis). Although their number is large (about 90–99% of the total number of frequencies), their combined contribution is small—only about 10−3–10−4% of the signals power.
Figure 2
Figure 2
Spectral waves. (A) A detailed representation of the lower portion the spectrogram recomputed for TW = 0.08 sec (80 data points) exhibits clear oscillatory patterns. (B) The shape of the two lowest frequency spectral waves is stable with respect to the variation of time window size, TW. The strikes of different color in the top left corner represent the widths of the four TW-values used in DPT analysis. The corresponding reconstructed frequencies are shown by the dots of the same color. Although the frequencies obtained for different TWs do not match each other exactly, they outline approximately the same shape, which, we hypothesize, reflects the physical pattern of synchronized neuronal activity that produced the analyzed LFP signal. (C) Pie diagrams illustrate the numbers of data points N = 80, N = 160, N = 240, N = 320 and the mean numbers of the regular and the irregular (noisy) harmonics in each case.
Figure 3
Figure 3
Parameters of the spectral waves. (A) The red curve shows the smoothened θ spectral wave, obtained by interpolating the “raw” trace of the reconstructed frequencies shown on Fig. 2A over the uniformly spaced time points. (B) The power spectra produced by the Discrete Padé decomposition (DPT, red) and the standard Discrete Fourier decomposition (DFT, black) exhibit characteristic peaks around the mean frequency of the θ-oscillon, ωθ,0/2π ≈ 7.5 Hz. The height of the peaks defines the amplitudes, respectively, of the θ-oscillon in the DPT approach and of the θ-rhythm in DFT. A smaller peak at about 34 Hz corresponds to the mean frequency of the low γ oscillon, ωγl,0/2π34. The θ and the low γ frequency domains, marked by blue arrows, are defined by the amplitudes of the corresponding spectral waves. (C) The smoothened waves are used to compute the DFT transform and to extract the modulating frequencies Ωθ,1 ≈ 4.3 Hz, Ωθ,2 ≈ 7.3 Hz, Ωθ,3 ≈ 11 Hz, …, of the decomposition (4–5). The error margin in most estimates is ±0.5 Hz. Notice that there exist several approximate resonant relationships, e.g., Ωθ,4 ≈ 3Ωθ,1, Ωθ,5 ≈ 2Ωθ,2 and Ωθ,7 ≈ Ωθ,3, which suggest that the spectral θ-wave contains higher harmonics of a smaller set of prime frequencies.
Figure 4
Figure 4
Correspondence between the Discrete Fourier (left) and Padé (right) spectral decompositions. (A) Fourier spectrogram of a 10 second long excerpt from C. Debussy’s Preludes, Book 1: No. 8. La fille aux cheveux de lin, in which the individual notes are clearly audible. The high amplitude streaks (colorbar on the right) correspond to the notes (D#5, B4, G4, F4, G4, B4, D5, B4, G4, F4, G4, B4, G4, F4, G4, F4, …). (B) The Discrete Padé spectrogram of the same signal. The frequencies produced by large amplitude poles (see colorbar on the right) match the frequencies of their Fourier counterparts shown on the left. The frequencies produced the Froissart doubles form a very low amplitude background “dust,” shown in gray. Our main hypothesis is that the oscillons detected in the LFP signals by the DPT method may be viewed as “notes” within the neuronal oscillations.

References

    1. Buzsáki G, Anastassiou C, Koch C. The origin of extracellular fields and currents — EEG, ECoG, LFP and spikes. Nature Rev. Neurosci. 2012;13:407–420. doi: 10.1038/nrn3241. - DOI - PMC - PubMed
    1. Thut G, Miniussi C, Gross J. The Functional Importance of Rhythmic Activity in the Brain. Current Biology. 2012;22:R658–63. doi: 10.1016/j.cub.2012.06.061. - DOI - PubMed
    1. Boashash B. Time frequency signal analysis and processing: a comprehensive reference. Boston: Elsevier; 2003.
    1. Van Vugt, M. K., Sederberg, P. B. & Kahana, M. J. Comparison of spectral analysis methods for characterizing brain oscillations. J Neurosci Methods162, 49–63 (2007). - PMC - PubMed
    1. Kopell N, Kramer M, Malerba P, Whittington M. Are different rhythms good for different functions? Frontiers in Human Neurosci. 2010;4:187–96. doi: 10.3389/fnhum.2010.00187. - DOI - PMC - PubMed

Publication types