Comparative Study
. 2019 Jan 28;9(1):819.
doi: 10.1038/s41598-018-37316-w.

Differential anti-tumour effects of MTH1 inhibitors in patient-derived 3D colorectal cancer cultures

Affiliations
Comparative Study

Differential anti-tumour effects of MTH1 inhibitors in patient-derived 3D colorectal cancer cultures

Lizet M van der Waals et al. Sci Rep. .

Abstract

Reactive oxygen species (ROS) function as second messengers in signal transduction, but high ROS levels can also cause cell death. MTH1 dephosphorylates oxidized nucleotides, thereby preventing their incorporation into DNA and protecting tumour cells from oxidative DNA damage. Inhibitors of MTH1 (TH588 and (S)-crizotinib) were shown to reduce cancer cell viability. However, the MTH1-dependency of the anti-cancer effects of these drugs has recently been questioned. Here, we have assessed anti-tumour effects of TH588 and (S)-crizotinib in patient-derived 3D colorectal cancer cultures. Hypoxia and reoxygenation - conditions that increase intracellular ROS levels - increased sensitivity to (S)-crizotinib, but not to TH588. (S)-crizotinib reduced tyrosine phosphorylation of c-MET and ErbB3 whereas TH588 induced a mitotic cell cycle arrest, which was not affected by adding ROS-modulating compounds. Furthermore, we show that both compounds induced DNA damage that could not be prevented by adding the ROS inhibitor N-acetyl-L-cysteine. Moreover, adding ROS-modulating compounds did not alter the reduction in viability in response to TH588 and (S)-crizotinib. We conclude that TH588 and (S)-crizotinib have very clear and distinct anti-tumour effects in 3D colorectal cancer cultures, but that these effects most likely occur through distinct and ROS-independent mechanisms.


Conflict of interest statement

The authors declare no competing interests.

Figures

Figure 1
Figure 1
TH588 and (S)-crizotinib reduce cell viability of patient-derived colorectal cancer 3D cultures. (a) Western blot showing protein levels of MTH1 in L145, p25T and p26T three-dimensional colorectal cancer cultures (left) and the quantification (right). (b) Analysis of cell viability of p25T and p26T patient-derived organoid lines after a 3 d treatment with 5 μM TH588 or 5 μM (S)-crizotinib. Graph shows mean + s.d. and represents data from two independent experiments. (c) Analysis of cell viability of L145 CRC spheroids after a 3 d treatment with 10 μM of TH588 or (S)-crizotinib. Graph shows mean + s.d. and represents data from three independent experiments. ns, p > 0.05; *p ≤ 0.05; **p ≤ 0.01 (One-way ANOVA Bonferroni adjusted p-value).
Figure 2
Figure 2
(S)-crizotinib sensitivity is enhanced during hypoxia and after reoxygenation whereas colorectal cancer spheroids are not sensitized to TH588 under these conditions. (a) Graph showing percentage change in cell viability after a 3 d treatment with 10 μM of TH588 or (S)-crizotinib compared to DMSO-treated controls. Human L145 CRC spheroids were cultured under normoxia (21% O2) or transferred to a hypoxia chamber (0.1% O2). After 72 h, CRC spheroids were either maintained under hypoxia (hypoxia) or returned to normoxia (reoxygenation). Graph shows mean + s.d. and represent data from three independent experiments. ns, p > 0.05; *p ≤ 0.05; **p ≤ 0.01 (One-way ANOVA Bonferroni adjusted p-value). (b) Clonogenic capacity after treatment with TH588 or (S)-crizotinib (5 or 10 μM). L145 CRC spheroids were cultured as in (a). Graphs show mean + s.d. (n = 3 normoxia/n = 2 reoxygenation). ns, p > 0.05; *p ≤ 0.05; **p ≤ 0.01 (ANOVA Bonferroni adjusted p-value). H, hypoxia; N, normoxia; R, reoxygenation.
Figure 3
Figure 3
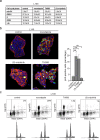
TH588 induces a mitotic arrest in human CRC spheroids. (a) Table showing the distribution of cells at the various phases of the cell cycle as determined by flow cytometry using DAPI staining. The values represent the mean percentage + s.d. and represent data from three independent experiments. (b) Immunofluorescent staining of the mitotic marker phospho-histone H3 (green), tubulin (red), F-actin (orange) and DAPI (blue) (left) and quantification of phospho-histone H3-positive cells (right). One representative Z-stack per condition is shown. A minimal of 1300 nuclei per condition were analysed. Graph shows mean + s.e.m. ns, p > 0.05; **p ≤ 0.01 (One-way ANOVA Bonferroni adjusted p-value) (c) Flow cytometry analysis of DNA content (DAPI staining) and mitotic cell population (phospho-histone H3) of CRC spheroids after exposure to the indicated drugs or DMSO (control) for 1 d. Representative flow cytometry plots are shown (logarithmic scale). Percentages per cell cycle phase are presented in (a). (a–c) All experiments were performed using L145 CRC spheroids. The following drug concentrations were used: 0.83 μM nocodazole, 10 μM TH588, 10 μM (S)-crizotinib. pH3, phospho-histone H3.
Figure 4
Figure 4
c-MET and ErbB3 phosphorylation is inhibited by (S)-crizotinib. (a) Detection of phospho-receptor tyrosine kinases in L145 CRC spheroids DMSO-treated (control) or exposed to 10 μM of (S)-crizotinib or 10 μM of (R)-crizotinib overnight as positive control. 300 μg of lysate was run on each array. Data shown are from a 10 min exposure to film. In the array, each RTK is spotted in duplicate. ► control and reference spots (b) Quantification of (a).
Figure 5
Figure 5
ROS-modulating compounds do not alter sensitivity to TH588 and (S)-crizotinib. (a) Western blot analysis of phospho-histone H3 protein levels in L145 CRC spheroids following 1d treatment with TH588 or (S)-crizotinib combined with the ROS-scavenging compound NAC or ROS-inducing compounds BSO/AUR or menadione, added 2 h prior, 5 h prior, or added during the last 5 h of incubation with TH588 or (S)-crizotinib, respectively. Uncropped images are provided in the Supplementary Data. Graph shows the quantification of the Western blot data. (b) Table showing the distribution of L145 cells at the various phases of the cell cycle after 1 d treatment as determined by flow cytometry using DAPI staining (n = 1). Some data (conditions without NAC) of Fig. 3a was reused in this table. (c) Flow cytometry plots of DAPI staining of L145 spheroids DMSO-treated or exposed to TH588 in the presence or absence of 0.5 mM NAC (logarithmic scale). (d) Western blot analysis of γH2AX levels following treatment with TH588 or (S)-crizotinib (1 d) in the presence or absence of NAC. L145 CRC spheroids exposed to two cycles of oxaliplatin were used as positive control (n = 1). Graph shows the quantification of the western blot data. (e) Analysis of L145 CRC spheroid viability following treatment with TH588 or (S)-crizotinib in the ± ROS-modulators. Graph shows mean + s.d. of three replicates (n = 1). (a–e) The following drug concentrations were used: 0.83 μM nocodazole, 25 μM menadione, 100 μM BSO, 1 μM AUR, 0.5 mM NAC, 10 μM TH588, 10 μM (S)-crizotinib, 2 cycles of 2.5 μM oxaliplatin. (f) Analysis of cell viability of organoid cultures after a 3 d treatment with 5 μM of TH588 or (S)-crizotinib in the presence or absence of 0.5 mM NAC. Graph shows mean + s.d. of three replicates (p25T) or mean + s.d. from two independent experiments (p26T). Cell viability in the presence of NAC was compared to without NAC for control, TH588- and (S)-crizotinib-treated p26T organoids and treatment was compared to DMSO-treated controls using a one-way ANOVA followed by Bonferroni’s post-hoc comparisons test. AUR, auranofin; BSO, L-buthionine-S,R-sulfoximine; NAC, N-acetyl-L-cysteine; pH3, phospho-histone H3; γH2AX, phospho-histone H2AX.

References

    1. Trachootham D, et al. Selective killing of oncogenically transformed cells through a ROS-mediated mechanism by beta-phenylethyl isothiocyanate. Cancer cell. 2006;10:241–252. doi: 10.1016/j.ccr.2006.08.009. - DOI - PubMed
    1. Cairns RA, Harris IS, Mak TW. Regulation of cancer cell metabolism. Nature reviews. Cancer. 2011;11:85–95. doi: 10.1038/nrc2981. - DOI - PubMed
    1. Schlaepfer IR, et al. Hypoxia induces triglycerides accumulation in prostate cancer cells and extracellular vesicles supporting growth and invasiveness following reoxygenation. Oncotarget. 2015;6:22836–22856. doi: 10.18632/oncotarget.4479. - DOI - PMC - PubMed
    1. van der Waals LM, et al. Increased Levels of Oxidative Damage in Liver Metastases Compared with Corresponding Primary Colorectal Tumors: Association with Molecular Subtype and Prior Treatment. The American journal of pathology. 2018;188:2369–2377. doi: 10.1016/j.ajpath.2018.06.008. - DOI - PubMed
    1. Schafer ZT, et al. Antioxidant and oncogene rescue of metabolic defects caused by loss of matrix attachment. Nature. 2009;461:109–113. doi: 10.1038/nature08268. - DOI - PMC - PubMed

Publication types

MeSH terms