. 2019 Jul;33(7):1635-1649.
doi: 10.1038/s41375-018-0368-6. Epub 2019 Jan 28.

Sequentially inducible mouse models reveal that Npm1 mutation causes malignant transformation of Dnmt3a-mutant clonal hematopoiesis

Affiliations

Sequentially inducible mouse models reveal that Npm1 mutation causes malignant transformation of Dnmt3a-mutant clonal hematopoiesis

Matthew A Loberg et al. Leukemia. 2019 Jul.

Abstract

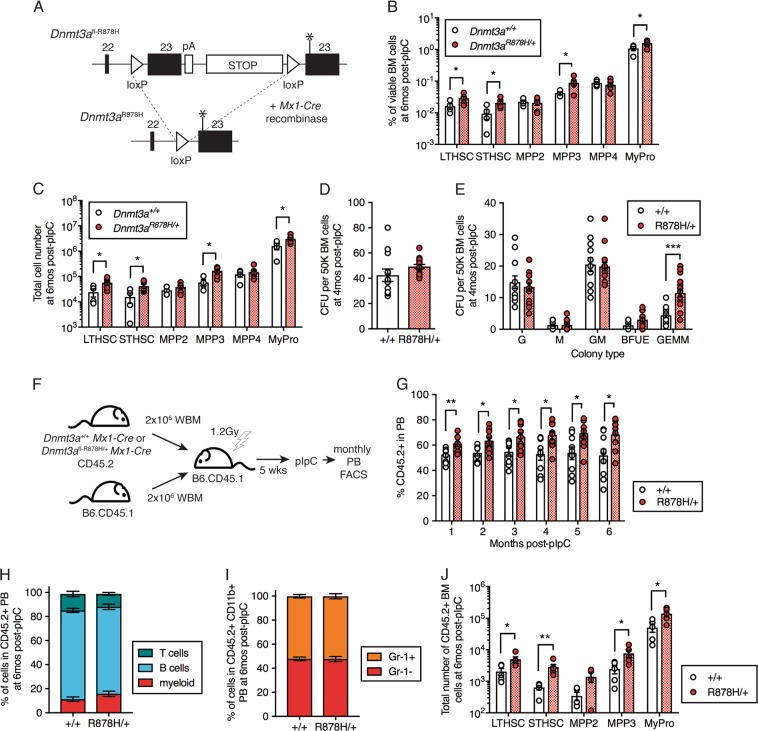
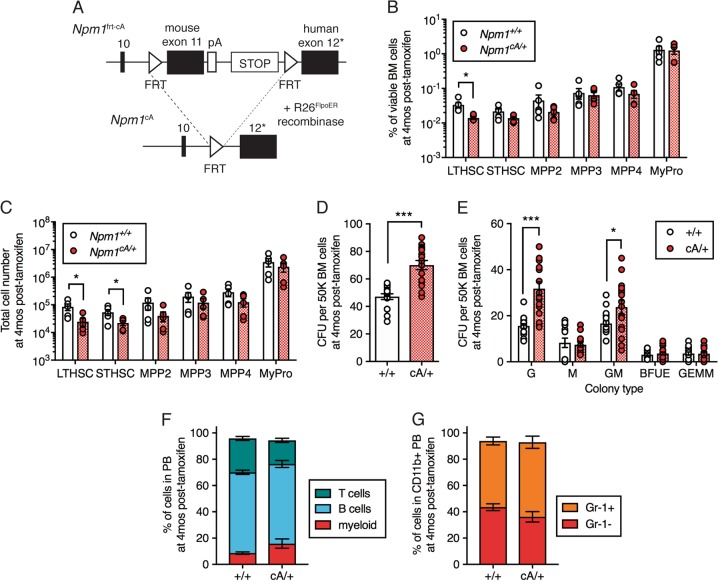
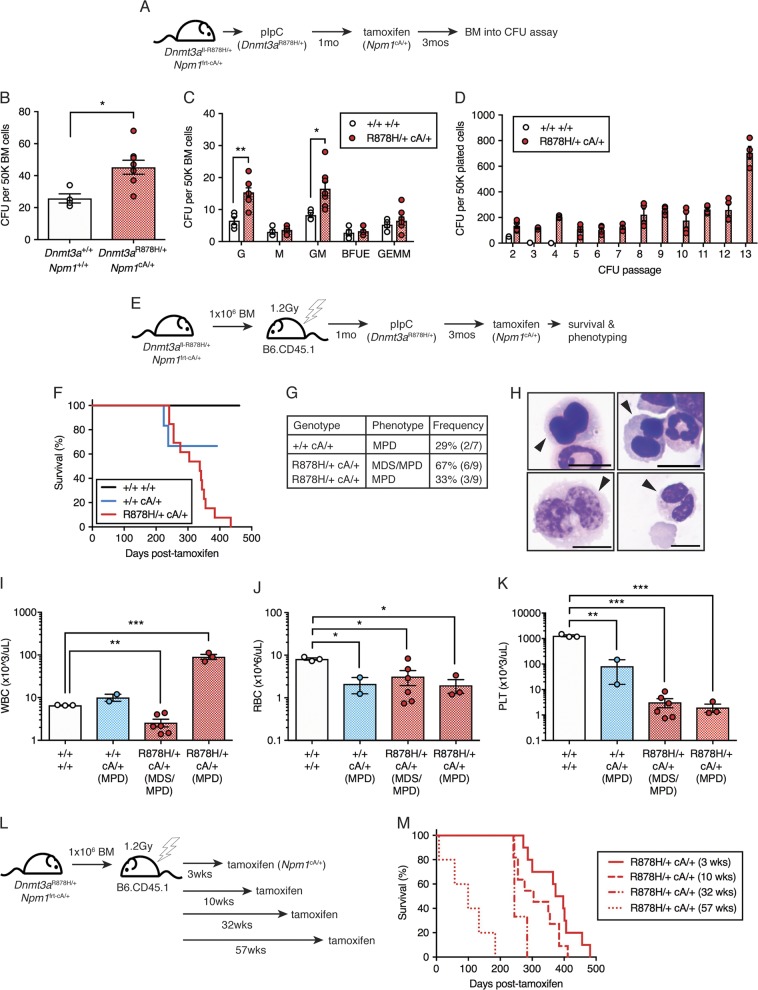
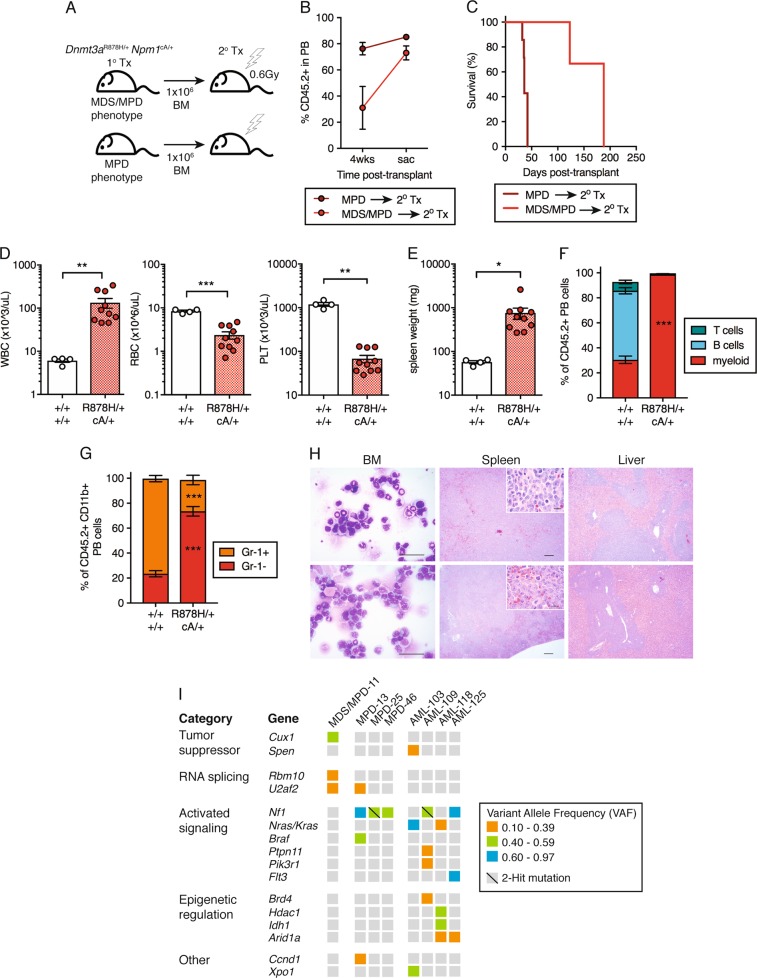
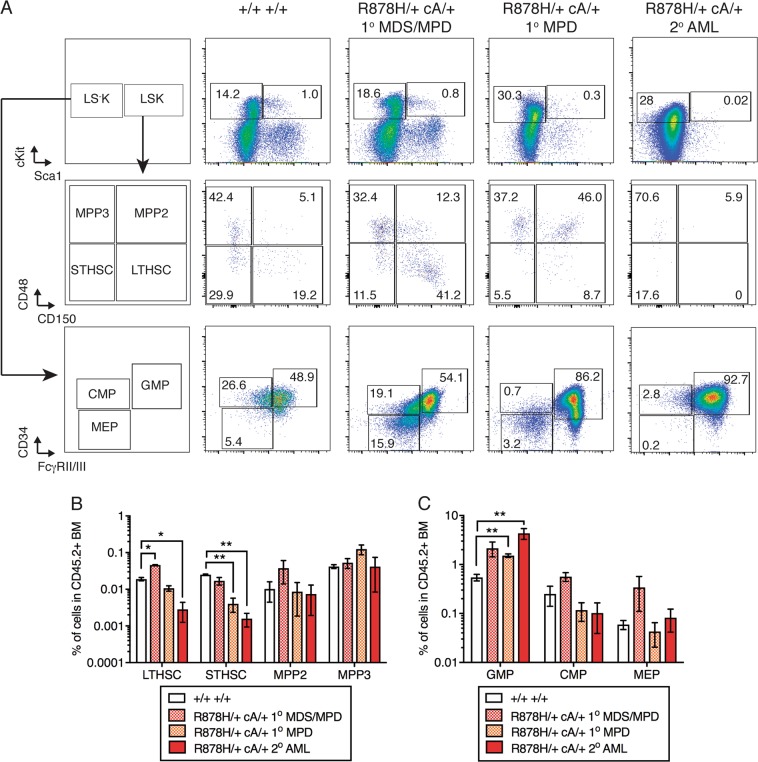
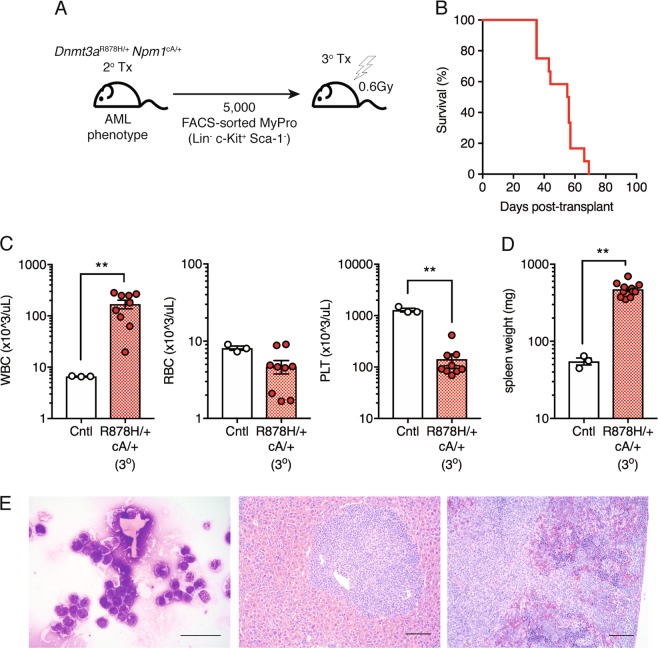
Clonal hematopoiesis (CH) is a common aging-associated condition with increased risk of hematologic malignancy. Knowledge of the mechanisms driving evolution from CH to overt malignancy has been hampered by a lack of in vivo models that orthogonally activate mutant alleles. Here, we develop independently regulatable mutations in DNA methyltransferase 3A (Dnmt3a) and nucleophosmin 1 (Npm1), observed in human CH and AML, respectively. We find Dnmt3a mutation expands hematopoietic stem and multipotent progenitor cells (HSC/MPPs), modeling CH. Induction of mutant Npm1 after development of Dnmt3a-mutant CH causes progression to myeloproliferative disorder (MPD), and more aggressive MPD is observed with longer latency between mutations. MPDs uniformly progress to acute myeloid leukemia (AML) following transplant, accompanied by a decrease in HSC/MPPs and an increase in myeloid-restricted progenitors, the latter of which propagate AML in tertiary recipient mice. At a molecular level, progression of CH to MPD is accompanied by selection for mutations activating Ras/Raf/MAPK signaling. Progression to AML is characterized by additional oncogenic signaling mutations (Ptpn11, Pik3r1, Flt3) and/or mutations in epigenetic regulators (Hdac1, Idh1, Arid1a). Together, our study demonstrates that Npm1 mutation drives evolution of Dnmt3a-mutant CH to AML and rate of disease progression is accelerated with longer latency of CH.


Conflict of interest statement

R.L. is on the supervisory board of Qiagen and is a scientific advisor to Loxo, Imago, C4 Therapeutics, and Isoplexis. He receives research support from and consulted for Celgene and Roche, research support from Prelude Therapeutics, and has consulted for Novartis and Gilead. He has received honoraria from Lilly and Amgen for invited lectures. The remaining authors declare that they have no conflict of interest.

Figures

Fig. 1
Fig. 1
Dnmt3aR878H/+ expands HSCs and multipotent progenitor cells. a Schematic diagram of the design of the Dnmt3afl-R878H/+ allele. Asterisk indicates 2633G>A in exon 23 to encode the R878H mutation. b Frequency and c total number of LT-HSC, ST-HSC, MPP2, MPP3, MPP4, and MyPro cells in the BM of +/+ (n = 4) and R878H/+ (n = 6) mice at 6 months post-pIpC. d Total colony-forming units (CFU) and e colony types derived from 50 K BM MNCs isolated from +/+ (n = 6) and R878H/+ (n = 8) mice at 4 months post-pIpC. G (granulocyte), M (macrophage), GM (granulocyte-macrophage), BFUE (burst forming-unit erythroid), GEMM (mixed granulocyte-erythroid-macrophage-megakaryocyte). Results are from three independent experiments. f Experimental design for competitive transplantation of +/+ or fl-R878H/+ BM cells with wild-type B6.CD45.1 BM cells at a 1:1 ratio into lethally irradiated B6.CD45.1 recipient mice followed by pIpC to induce recombination of Dnmt3afl-R878H. g Frequency of donor-derived (CD45.2+)+/+ (n = 9) or R878H/+ (n= 9) cells in PB of recipient mice post-pIpC. Results are from two independent experiments. h Frequency of myeloid (CD11b+), B (B220+), and T (CD3+) cells within donor-derived (CD45.2+) PB and i Gr-1+ and Gr-1 cells within donor-derived myeloid PB at 6 months post-pIpC. j Frequency of LT-HSC, ST-HSC, MPP2, MPP3, and MyPro cells within donor-derived +/+ (n = 5) or R878H/+ (n = 5) BM at 6 months post-pIpC. Results are from two independent experiments. In all graphs, dots represent individual mice, bars indicate mean ± s.e.m. *P < 0.05; **P < 0.01; ***P < 0.001
Fig. 2
Fig. 2
Npm1cA/+ depletes HSCs and expands myeloid colony-forming cells. a Schematic diagram of the design of the Npm1frt-cA/+ allele. Asterisk indicates frameshift mutation to create a humanized mutant exon 12 (p.W288fs*12). b Frequency and c total number of LT-HSC, ST-HSC, MPP2, MPP3, MPP4, and MyPro cells in the BM of +/+ (n = 5) and cA/+ (n = 5) mice at 4 months post-tamoxifen. d Total CFU and e colony types derived from 50K BM MNCs isolated from +/+ (n = 8) and cA/+ (n = 8) mice at 4 months post-tamoxifen. Results are from four independent experiments. f Frequency of myeloid, B, and T cells within PB and g Gr-1+ and Gr-1 cells within myeloid PB at 4 months post-tamoxifen in +/+ (n = 6) and cA/+ (n = 12) mice. In all graphs, dots represent individual mice, bars indicate mean ± s.e.m. *P < 0.05; ***P < 0.001
Fig. 3
Fig. 3
Dnmt3aR878H/+ followed by Npm1cA/+ causes development of lethal MPD. a Experimental design for induction of Dnmt3aR878H/+ driving clonal hematopoietic expansion prior to induction of Npm1cA/+, followed by in vitro CFU assay. b Total CFU and c colony types derived from 50K BM MNCs isolated from control (n = 4) or R878H/+ cA/+ (n= 8) mice at 3 months post-tamoxifen. Results are from 3 independent experiments. (d) CFU derived from 50K BM MNCs isolated from control (n = 2) and R878H/+ cA/+ (n= 4) mice, serially passaged for up to 13 passages. Results are from two independent experiments. e Experimental design for non-competitive transplantation of fl-R878H/+ frt-cA/+ BM into lethally irradiated recipient mice, followed by pIpC induction of R878H/+ and clonal hematopoietic expansion prior to tamoxifen induction of cA/+. f Overall survival of mice transplanted with 106 BM cells from control (n = 3), cA/+ only (n = 7) or R878H/+ cA/+ (n = 13) mice. Results are from three independent experiments. g Description and penetrance of phenotypes in moribund mice following transplant with cA/+ only or R878H/+ cA/+ BM cells. h Representative Giemsa-stained BM cytospins (100×) from R878H/+ cA/+ MDS/MPD showing dysplastic cells (arrows). Scale bars are 10 μm. i WBC count, j RBC count, and k PLT count in moribund mice (control, n= 3; cA/+ MPD, n = 2; R878H/+ cA/+ MDS/MPD, n = 6; R878H/+ cA/+ MPD, n = 3). l Experimental design for tamoxifen induction of cA/+ at various times following induction of R878H/+. m Overall survival of mice transplanted with 106 BM cells with latency between R878H/+ and cA/+ mutations of 3 weeks (n = 10), 10 weeks (n = 11), 32 weeks (n= 3), or 57 weeks (n = 5). Results are from three independent experiments. In all graphs, dots represent individual mice, bars indicate mean ± s.e.m. *P < 0.05; **P < 0.01; ***P < 0.001
Fig. 4
Fig. 4
Dnmt3aR878H/+ Npm1cA/+ MPD progresses to AML following transplantation. a Experimental design for non-competitive secondary transplantation of Dnmt3aR878H/+ Npm1cA/+ BM MNCs from primary recipient mice with MDS/MPD or MPD phenotypes. b Frequency of donor-derived (CD45.2+) cells in PB of secondary recipient mice at 4 weeks post-transplant and at time of sacrifice. Dots represent mean ± s.e.m. (MPD, n = 7; MDS/MPD, n = 3). Results are from three independent experiments. c Overall survival of secondary transplant-recipient mice (MPD, n = 7; MDS/MPD, n = 3). d WBC, RBC, and PLT counts and e spleen weights of moribund mice (control, n = 4; +/+ cA/+, n = 10). f Frequency of myeloid, B, and T cells within the donor-derived CD45.2+ fraction in PB and g Gr-1+ and Gr-1 cells within donor-derived myeloid PB of moribund mice (control, n = 3; +/+ cA/+, n= 10). h Representative Giemsa-stained BM cytospins (far left; 40×, scale bars are 40 μm) and H&E-stained spleen (center; 4×, scale bars are 100 μm) (inset: 40×, scale bars are 40 μm) and liver sections (far right; 4×, scale bars are 100 μm) from moribund recipient mice. i Somatic, nonsynonymous mutations in individual genes and sets of genes, grouped into five categories. Orange boxes indicate mutations at VAF 0.10-0.39; green boxes, VAF 0.40–0.59; blue boxes, VAF 0.60–0.97. In all graphs unless otherwise specified, dots represent individual mice, bars indicate mean ± s.e.m. *P < 0.05; **P < 0.01; ***P < 0.001
Fig. 5
Fig. 5
Mice with Dnmt3aR878H/+ Npm1cA/+ AML show expansion of granulocyte-macrophage progenitor cells. a Representative flow cytometric gating for hematopoietic stem and progenitor cells in recipient mice transplanted with Dnmt3a+/+ Npm1+/+ or Dnmt3aR878H/+ Npm1cA/+ with MDS/MPD, MPD, or AML phenotypes. b Frequency of LT-HSC, ST-HSC, MPP2, and MPP3 and c GMP, CMP, and MEP in donor-derived CD45.2+ BM cells (control, n = 2; R878H/+ cA/+ MDS/MPD, n = 2; R878H/+ cA/+ MPD, n = 3; R878H/+cA/+ AML, n = 4). Results are from two independent experiments
Fig. 6
Fig. 6
Myeloid-restricted progenitor cells are tumor-propagating cells in Dnmt3aR878H/+ Npm1cA/+ AML. a Experimental design for non-competitive tertiary transplantation of FACS-sorted Dnmt3aR878H/+ Npm1cA/+ BM myeloid progenitors from secondary recipient mice with AML. b Overall survival of tertiary transplant recipient mice (n = 12). Results are from three independent experiments. c WBC, RBC, and PLT counts in moribund mice (control, n = 3; +/+ cA/+, n = 9). d Spleen weights of moribund mice (control, n = 3; +/+ cA/+, n = 11). e Representative Giemsa-stained BM cytospin (far left; 40×, scale bars are 40 μm) and H&E-stained spleen (center; 10×, scale bars are 100 μm) and liver sections (far right; 10×, scale bars are 100 μm) from moribund recipient mice. In all graphs, dots represent individual mice, bars indicate mean ± s.e.m. **P < 0.01

References

    1. Bowman RL, Busque L, Levine RL. Clonal hematopoiesis and evolution to hematopoietic malignancies. Cell Stem Cell. 2018;22:157–70. doi: 10.1016/j.stem.2018.01.011. - DOI - PMC - PubMed
    1. Chung SS, Park CY. Aging, hematopoiesis, and the myelodysplastic syndromes. Blood Adv. 2017;1:2572–8. - PMC - PubMed
    1. Yoshizato T, Dumitriu B, Hosokawa K, Makishima H, Yoshida K, Townsley D, et al. Somatic mutations and clonal hematopoiesis in aplastic anemia. N Engl J Med. 2015;373:35–47. doi: 10.1056/NEJMoa1414799. - DOI - PMC - PubMed
    1. Lindsley RC, Saber W, Mar BG, Redd R, Wang T, Haagenson MD, et al. Prognostic mutations in myelodysplastic syndrome after stem-cell transplantation. N Engl J Med. 2017;376:536–47. doi: 10.1056/NEJMoa1611604. - DOI - PMC - PubMed
    1. Rampal R, Ahn J, Abdel-Wahab O, Nahas M, Wang K, Lipson D, et al. Genomic and functional analysis of leukemic transformation of myeloproliferative neoplasms. Proc Natl Acad Sci USA. 2014;111:E5401–10. doi: 10.1073/pnas.1407792111. - DOI - PMC - PubMed

Publication types

MeSH terms