. 2019 Feb;51(2):343-353.
doi: 10.1038/s41588-018-0322-6. Epub 2019 Jan 28.

GARFIELD classifies disease-relevant genomic features through integration of functional annotations with association signals

Affiliations

GARFIELD classifies disease-relevant genomic features through integration of functional annotations with association signals

Valentina Iotchkova et al. Nat Genet. 2019 Feb.

Abstract

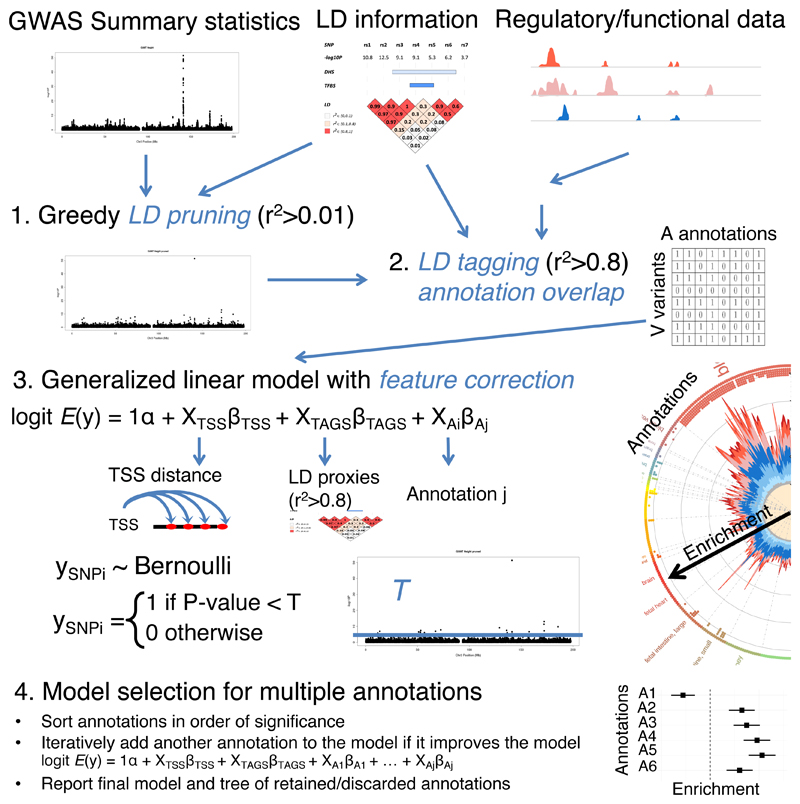
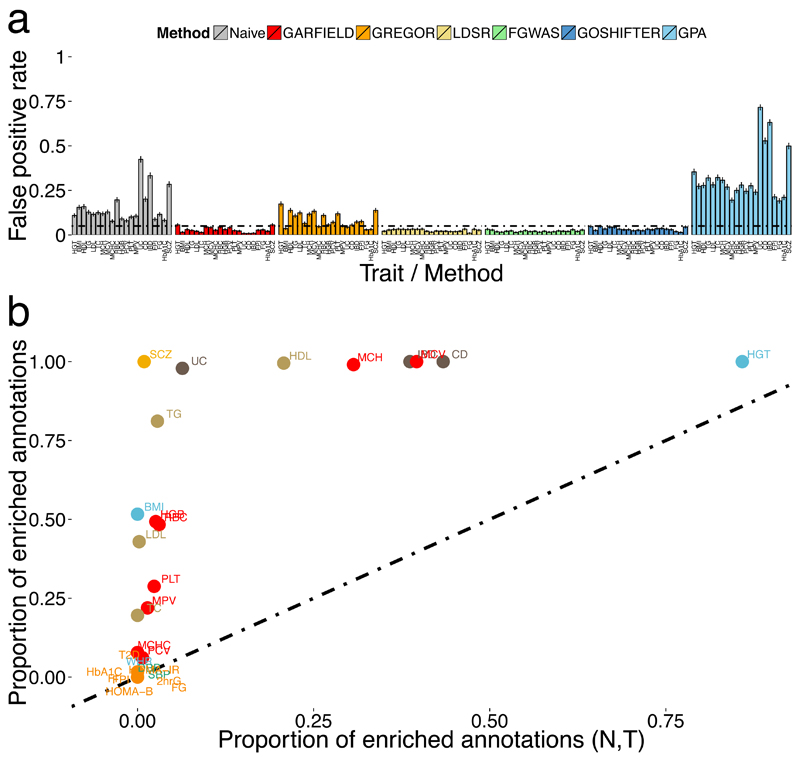
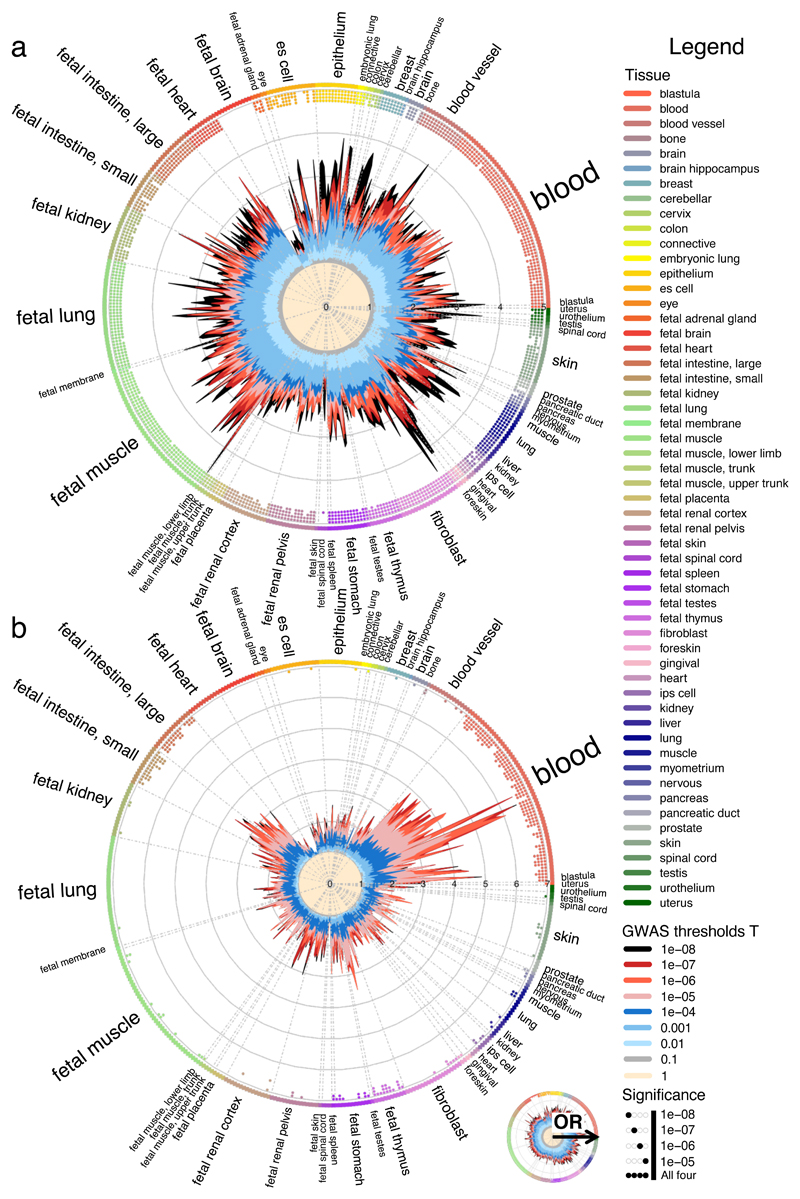
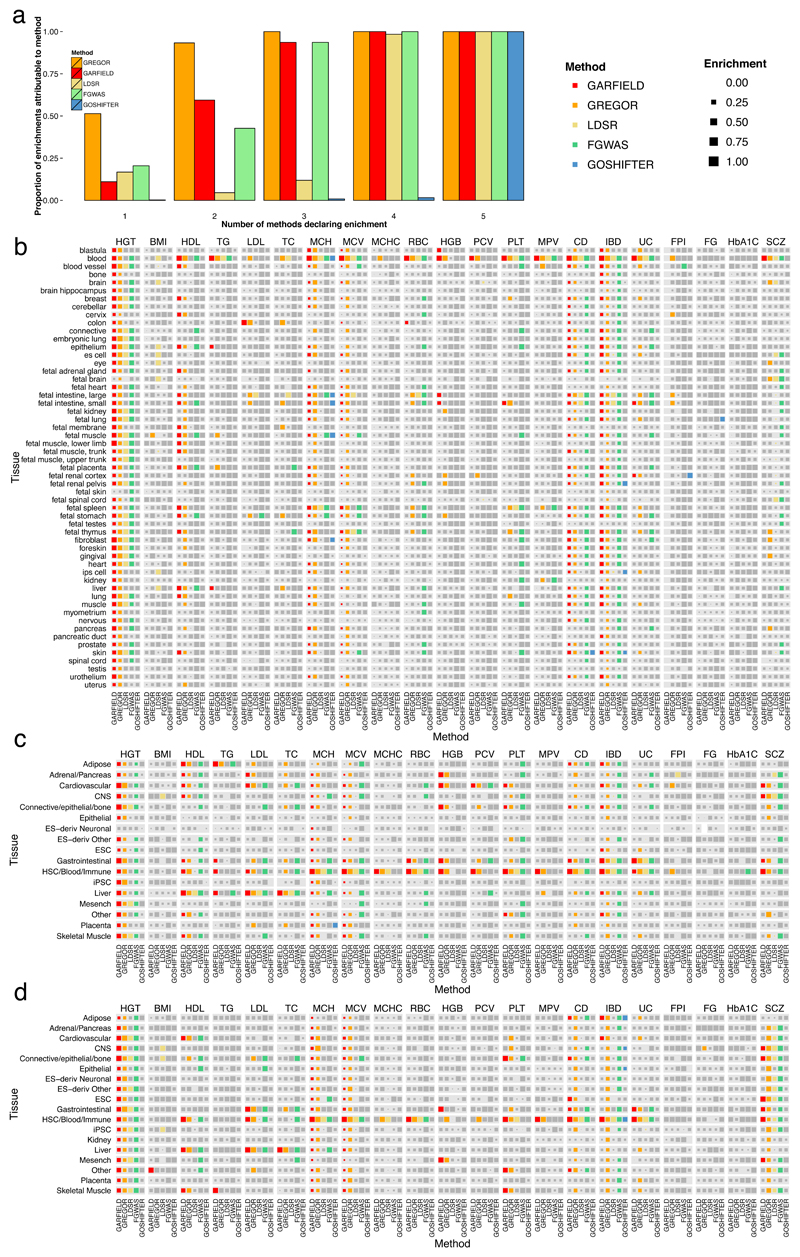
Loci discovered by genome-wide association studies predominantly map outside protein-coding genes. The interpretation of the functional consequences of non-coding variants can be greatly enhanced by catalogs of regulatory genomic regions in cell lines and primary tissues. However, robust and readily applicable methods are still lacking by which to systematically evaluate the contribution of these regions to genetic variation implicated in diseases or quantitative traits. Here we propose a novel approach that leverages genome-wide association studies' findings with regulatory or functional annotations to classify features relevant to a phenotype of interest. Within our framework, we account for major sources of confounding not offered by current methods. We further assess enrichment of genome-wide association studies for 19 traits within Encyclopedia of DNA Elements- and Roadmap-derived regulatory regions. We characterize unique enrichment patterns for traits and annotations driving novel biological insights. The method is implemented in standalone software and an R package, to facilitate its application by the research community.


Conflict of interest statement

Competing interests

The authors declare no competing interests.

Figures

Figure 1
Figure 1. Outline of the GARFIELD method.
Top panel: three inputs (annotation, p-value and linkage disequilibrium (LD) data) are used for the first two analytical steps (LD pruning and variant functional annotation), which result in a binary annotation overlap matrix of V pruned variants and A annotations. Middle panel: a logistic regression approach is used for testing for enrichment at a GWAS significance P-value threshold T while controlling for confounding features such as TSS distance and number of LD proxies. Bottom panel: model selection procedure for multiple annotations.
Figure 2
Figure 2. Method assessment.
(a) Estimated false positive rate (FPR) from 21 publicly available disease or quantitative traits and n = 1,000 simulated independent annotations. The black horizontal line denotes the 5% FPR threshold. Error bars denote standard errors. (b) Comparison between the proportion of significant annotations (GARFIELD enrichment p-value < 2.6 × 10⁻⁴ for multiple testing correction) found from models accounting for number of proxies (N) and distance to nearest TSS (T) respectively (x-axis), to a model not accounting for any feature (y-axis), for each of 29 publicly available GWA studies and n = 424 DNaseI hypersensitive site annotations. Key of trait name labels is shown in Supplementary Table 3.
Figure 3
Figure 3. Enrichment of genome-wide association analysis p-values in DNaseI hypersensitive sites (hotspots).
(a) Height (HGT) (n = 2,468,982 GWAS variants). (b) Ulcerative colitis (UC) (n = 11,113,952 GWAS variants). Radial lines show odds ratio values at eight GWAS P-value thresholds (T) for all ENCODE and Roadmap Epigenomics DHS cell lines, sorted by tissue on the outer circle. Dots in the inner ring of the outer circle denote significant GARFIELD enrichment (if present) at T < 10-5 (outermost) to T < 10-8 (innermost) after multiple testing correction for the number of effective annotations and are coloured with respect to the tissue of the cell type they test. Font size of tissue labels reflects the number of cell types from that tissue. Crohn’s disease shows predominant enrichment in blood, fetal thymus and fetal intestine tissues whereas height exhibits an overall enrichment. OR, odd’s ratio.
Figure 4
Figure 4. Method comparison for 21 GWAS datasets in DNaseI hypersensitive sites (hotspots) and histone modifications (H3K27ac and H3K4me3) at the T < 10-8 GWAS significance threshold.
(a) Proportion of enriched cell types in DNaseI hypersensitive sites identified by each method, where enrichments are stratified by the number of methods that support them. GARFIELD, fgwas and LDSC are restricted to positive enrichments only so as to be comparable to GREGOR and GoShifter. (b) Summary of significant enrichments per tissue and per method for DNaseI hypersensitive data. A colored box is present if the corresponding method has found at least one significantly enriched cell type for that tissue after multiple testing correction. Colors correspond to the different methods and are the same as in panel a. A grey box denotes that the enrichment did not reach significance. Additionally, the size of each box represents the relative magnitude of the enrichment. Since each method uses a different enrichment statistic, we have scaled each of them separately per method and per trait (e.g. for GARFIELD we scaled the ORs for all cell types for HDL so that 1 denotes the cell type with the highest enrichment found and 0 the lowest one). (c) Summary of significant enrichments per tissue and per method for H3K27ac data. (d) Summary of significant enrichments per tissue and per method for H3K4me3 data. (b-d) Sample sizes n per trait (and trait name labels) can be found in Supplementary Table 3 denoted by the number of variants in each GWAS study.
Figure 5
Figure 5. Enrichment levels (log OR) and extent of sharing between traits for 25-state chromatin segmentations of the NIH Roadmap and ENCODE projects at the T < 10-5 GWAS significance threshold.
(a) Distribution of significant (log) OR values across the 29 traits considered, split by segmentation state and coloured to highlight predicted functional elements (Supplementary Table 9). Number of points n is shown on the x-axis below each category. (b) Distribution of the pairwise difference between ORs from all enhancer, promoter and transcriptional enhancers and transcriptional regulatory states tested (‘state 1’) to ORs from transcription states for significant enrichments only (‘state 2’; e.g. measuring ORc,tEnhA1-ORc,tTx for all cell types c and traits t for which p-valuec,tEnhA1 and p-valuec,tTx are both significant). Number of points n is shown on the x-axis below each category. Boxplots show the median (center line); upper and lower quartiles (box limits), whiskers, furthest away point less than l.5x interquartile range (whiskers); points in the distribution(grey points) and outliers (black points). (c) Sharing of significantly enriched (or depleted) annotations (n=127 cell types) across 27 phenotypes (excluding Crohn’s disease (CD) and Ulcerative colitis (UC) as categories of IBD). The barplot displays the number of cell types where an annotation is uniquely enriched/depleted in a trait or shared between traits.

References

    1. Visscher PM, Brown MA, McCarthy MI, Yang J. Five years of GWAS discovery. Am J Hum Genet. 2012;90:7–24. - PMC - PubMed
    1. Hindorff LA, et al. Potential etiologic and functional implications of genome-wide association loci for human diseases and traits. Proc Natl Acad Sci U S A. 2009;106:9362–9367. - PMC - PubMed
    1. ENCODE Project Consortium. An integrated encyclopedia of DNA elements in the human genome. Nature. 2012;489:57–74. - PMC - PubMed
    1. Thurman RE, et al. The accessible chromatin landscape of the human genome. Nature. 2012;489:75–82. - PMC - PubMed
    1. Bernstein BE, et al. The NIH roadmap epigenomics mapping consortium. Nat Biotechnol. 2010;28:1045–1048. - PMC - PubMed

Publication types