. 2019 Mar;15(3):241-249.
doi: 10.1038/s41589-018-0211-4. Epub 2019 Jan 28.

Bacterial sensors define intracellular free energies for correct enzyme metalation

Affiliations

Bacterial sensors define intracellular free energies for correct enzyme metalation

Deenah Osman et al. Nat Chem Biol. 2019 Mar.

Abstract

There is a challenge for metalloenzymes to acquire their correct metals because some inorganic elements form more stable complexes with proteins than do others. These preferences can be overcome provided some metals are more available than others. However, while the total amount of cellular metal can be readily measured, the available levels of each metal have been more difficult to define. Metal-sensing transcriptional regulators are tuned to the intracellular availabilities of their cognate ions. Here we have determined the standard free energy for metal complex formation to which each sensor, in a set of bacterial metal sensors, is attuned: the less competitive the metal, the less favorable the free energy and hence the greater availability to which the cognate allosteric mechanism is tuned. Comparing these free energies with values derived from the metal affinities of a metalloprotein reveals the mechanism of correct metalation exemplified here by a cobalt chelatase for vitamin B12.


Conflict of interest statement

Competing Financial Interests Statement. J.C. and T.G.H. are employees of Procter and Gamble. The collaboration was supported by an Industrial Partnership Award from the BBSRC plus a financial contribution from Procter and Gamble (in association with BBSRC award BB/J017787/1).

Figures

Figure 1
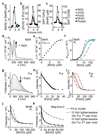
Figure 1. Metal binding and DNA binding are coupled to enable Salmonella to sense different metals.
a, Semi-schematic representation of metal sensors in four allosteric conformations (end states, red) which are thermodynamically coupled: apo (i.e. metal free)-protein (P), metal-protein (PM), apo-protein-DNA (PD) or metal-protein-DNA ((PM)D). Buffered metals (BM) may exchange to and from proteins via association of the molecules. b, The fractions of DNA target sites bound to sensor protein (θD) or solely to metalated sensor protein (θDM). c, qPCR (log2 fold-change) of mntS (regulated by MntR), iroB (regulated by Fur), rcnA (regulated by RcnR), nixA (regulated by NikR), copA (regulated by CueR), znuA (regulated by Zur) and zntA (regulated by ZntR) in cells grown in elevated non-lethal metal concentrations. Data are the mean ± standard deviation (s.d.) of biologically independent samples (n = 4 for iroB, rcnA, copA, zntA; n = 3 for mntS, nixA, znuA; †, not analysed). Symbol shapes represent individual experiments. d, Purified sensor proteins analysed by SDS-PAGE (full images in Supplementary Fig. 3b). Using gradient SDS-PAGE, n = 1.
Figure 2
Figure 2. Metal affinities that complete a set of values for Salmonella metal sensors.
a-c, Gel-filtration (Supplementary Fig. 3c in full) showing co-migration of NikR with Ni(II) (a), Fur with Fe(II) and Zn(II) (b and Supplementary Fig. 4), MntR with Mn(II) (c). n = 1 (a-c). d, Apo-subtracted spectra of Ni(II)-titrated NikR (10.6 µM), n = 1 at pH 8.0. e, Feature at 302 nm from d, showing linear increase saturating at ~ 10 µM Ni(II), hence 1:1 Ni(II):NikR stoichiometry. f, Representative NikR (13.2 μM) absorbance (n = 4 independent experiments) in competition for Ni(II) with EGTA (784.3 μM). The fit departs from simulations with KNi ten-fold tighter or weaker. g, Quenching of Fur (10.3 µM) fluorescence emission by Fe(II). n = 3 independent experiments with similar results. h, Feature at 303 nm from g. i, Representative Fur (10.2 μM) fluorescence in competition for Fe(II) with NTA (100 μM) (n = 4 independent experiments). The fit departs from simulations with KFe ten-fold tighter or weaker for the first pair (second pair KFe fixed) and second pair (first pair KFe fixed) of sites. j, Representative mag-fura-2 (1.95 μM) fluorescence (n = 4 independent experiments) in competition for Mn(II) with MntR (18.7 μM). The fit departs from simulations with KMn for MntR ten-fold tighter or weaker. k, Mn(II) binding to mag-fura-2 from Supplementary Figure 5 (n = 4 independent experiments), 1:1, λexcitation 380 nm, with simulations ten-fold tighter and ten-fold weaker than the fitted mean (±s.d.) KMn of 6.1 (±0.4) × 10-6 M for mag-fura-2. Fitting models in Supplementary Note 1.
Figure 3
Figure 3. Metals change the abundance of some sensors to modify regulation.
a, Representative chromatograms following MRM mass-spectrometry of ion transitions for analyte (coloured lines) or isotope-labelled internal standards (grey line, right axis for RcnR) for MntR, Fur, RcnR, NikR, CueR, Zur and ZntR respectively, detected in Salmonella cell lysates following prolonged exposure to elevated concentrations of cognate metals (n = 3 biologically independent samples, other than CueR where n = 5 biologically independent samples, with similar results). Multimeric states are noted in Table 1 footnote. Analyte peptide sequence is shown for each protein. Full chromatograms shown in Supplementary Figure 9. b, Abundance of sensors in control cells in minimal media P0 (left) and with cognate metal P1 (right). Values were calculated using calibration curves (Supplementary Fig. 8a) normalised to cell number. Bars and error bars are means and s.d., respectively (shapes represent biologically independent experiments with n = 3, except for CueR where n = 6 (P0) and n = 5 (P1)). c, Fractional DNA occupancy (θD) with Fur as a function of buffered [Fe(II)] using K1, K3, K4, target DNA concentration (Table 1), and either P0 (light orange line), P1 (dark orange line) or 10% increments between P0 and P1 (grey lines). DNA occupancy (black circles) where [Fur] at any given [cognate metal] (PT) is linearly proportional to θD (inset). θD0 and θD1 (determined using P0 and P1), are DNA occupancies at low and high [cognate metal], respectively. For co-repressors (e.g. Fur), θD0 and θD1 are minimum and maximum values (the converse relationship for de-repressors). d, A comparison of θD with RcnR using PT (solid blue line) relative to fixed [RcnR] and P0 (dashed light blue), normalised independently for each curve.
Figure 4
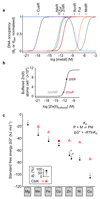
Figure 4. Sensing is tuned to the Irving-Williams series.
a, Calculated responses of CueR, NikR, Zur, ZntR, RcnR, Fur and MntR, as θD (or θDM for ZntR and CueR), to buffered concentrations of Cu(I), Ni(II), Zn(II), Zn(II), Co(II), Fe(II) and Mn(II) respectively within Salmonella using metal affinities, DNA affinities, cellular protein and DNA target abundances, in Table 1, Supplementary Figure 8 and Supplementary Table 1. b, Relationship between buffered Zn(II) concentration and total Zn(II) ions in a simulated buffer, showing where Salmonella Zur and ZntR, plus B. subtilis Zur on the rpsN promoter (Supplementary Fig. 14), are calculated to undergo 0.5 of their responses. c, Standard free energy change (ΔG°) for formation of a protein-metal (PM) complex, which in the Salmonella cytosol, corresponds to 20%, 50% or 80% metalation (θP): Zn(II) determined for ZntR (a), and Zur (b); riboswitch used for Mg(II) (Supplementary Table 2). Triangles, ΔG° for CbiK. For Mn(II), the arrow represents a limiting affinity of 20 μM or less.
Figure 5
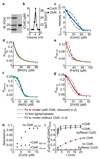
Figure 5. Metalation of CbiK and sirohydrochlorin.
a, SDS-PAGE of CbiK (Supplementary Fig. 16a). n = 1 by gradient SDS-PAGE. b, Gel-filtration of CbiK in 20 μM Co(II) (Supplementary Fig. 16b) (n = 3 independent experiments with similar results). c, Fura-2 (12.6 μM) fluorescence (n = 3 independent experiments) competing for Co(II) with CbiK (8.59 μM). d, Mag-fura-2 (11.3 μM) absorbance (n = 3 independent experiments) outcompeting CbiK for Mn(II) (7.38 μM): Fits with and without CbiK overlay. e, Mag-fura-2 (6.08 μM) absorbance (n = 3 independent experiments) competing for Fe(II) with CbiK (19 μM). f, Mag-fura-2 (11.3 μM) absorbance (n = 3 independent experiments) competing for Ni(II) with CbiK (7.46 μM). g, Mag-fura-2 (11 μM) absorbance (n = 3 independent experiments) competing for Zn(II) with CbiK (6.84 μM). In c, eg, fits depart from Kmetal ten-fold tighter or weaker noting that Ni(II) approaches the tightest limit for the assay. All models in Supplementary Note 1. h, BCA (22.1 μM) absorbance without (n = 3 independent experiments) or with (n = 4 independent experiments) competition for Cu(I) with CbiK (10 μM). Representative data sets are shown in ch. i, Conversion of sirohydrochlorin (4.67-5.64 μM) after addition of Co(II) with or without CbiK (5 μM), plus or minus a Co(II)-buffer (data are means of n = 3 independent experiments ±s.d.). Full time course shown in Supplementary Figure 22.

References

    1. Waldron KJ, Rutherford JC, Ford D, Robinson NJ. Metalloproteins and metal sensing. Nature. 2009;460:823–830. - PubMed
    1. Tottey S, et al. Protein-folding location can regulate manganese-binding versus copper- or zinc-binding. Nature. 2008;455:1138–1142. - PubMed
    1. Fraústo da Silva JJR, Williams RJP. The Biological Chemistry of the Elements: The Inorganic Chemistry of Life. Oxford University Press; Oxford: 1991.
    1. Irving H, Williams RJP. Order of stability of metal complexes. Nature. 1948;162:746–747.
    1. Chandrangsu P, Rensing C, Helmann JD. Metal homeostasis and resistance in bacteria. Nat Rev Microbiol. 2017;15:338–350. - PMC - PubMed

Publication types

MeSH terms