. 2019 Mar;22(3):460-469.
doi: 10.1038/s41593-018-0318-7. Epub 2019 Jan 28.

Temporal evolution of cortical ensembles promoting remote memory retrieval

Affiliations

Temporal evolution of cortical ensembles promoting remote memory retrieval

Laura A DeNardo et al. Nat Neurosci. 2019 Mar.

Abstract

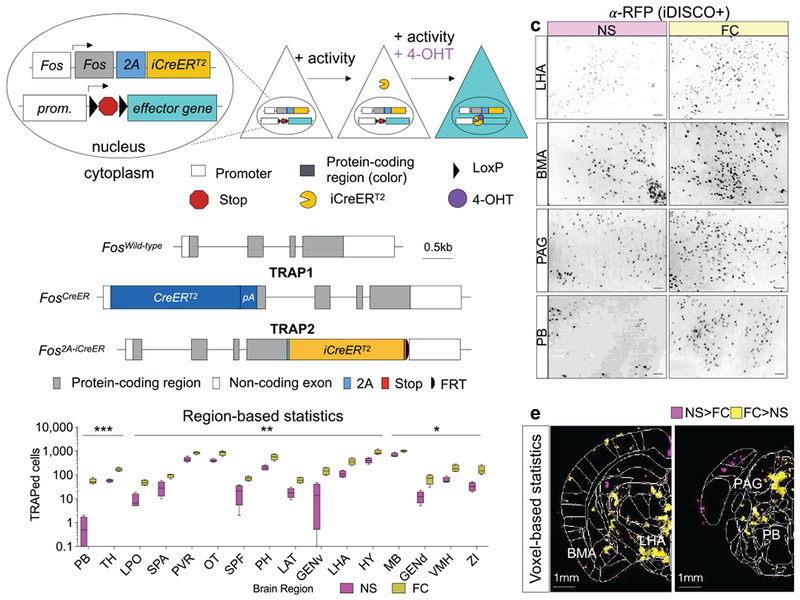
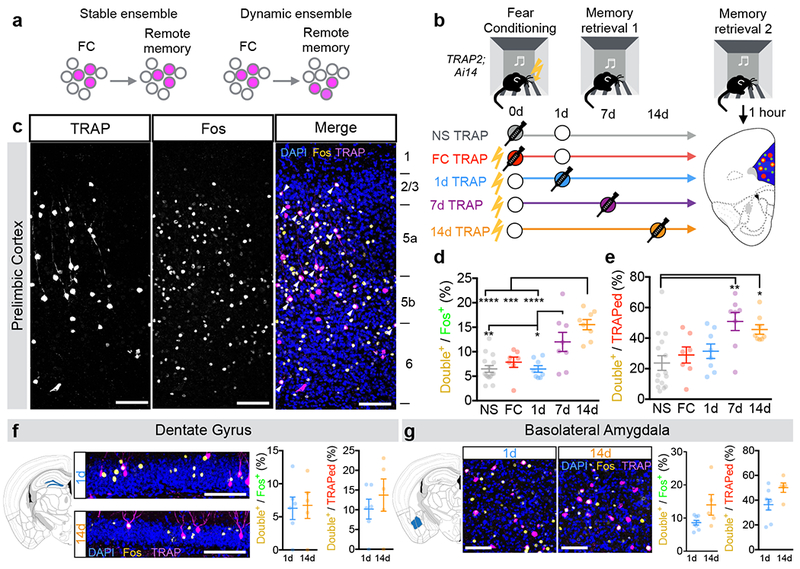
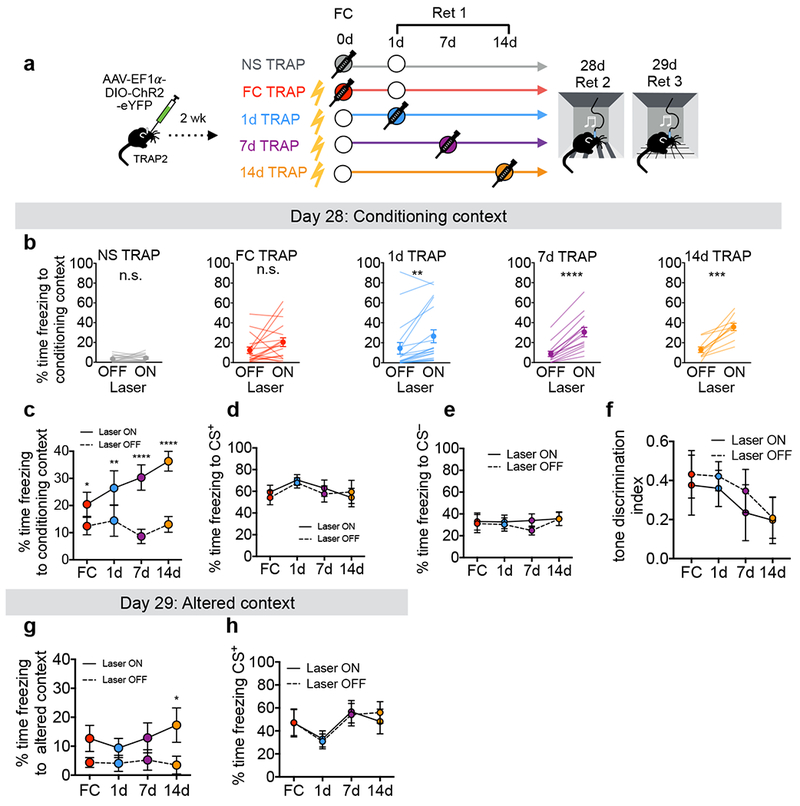
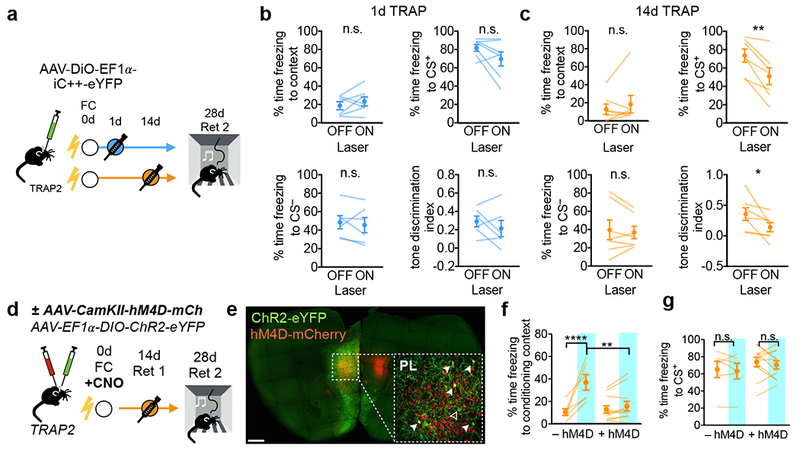
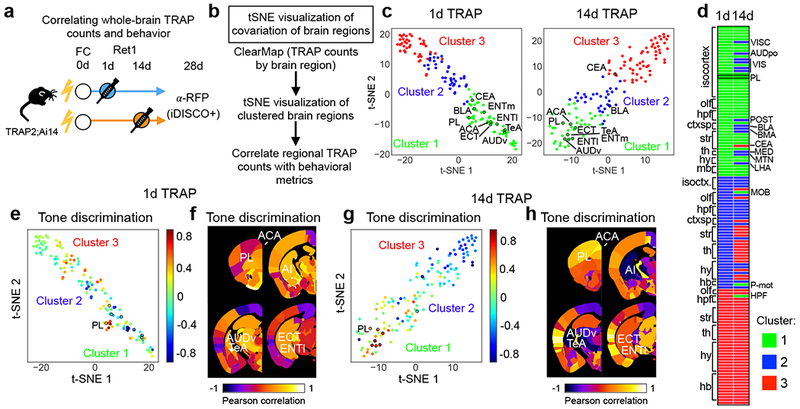
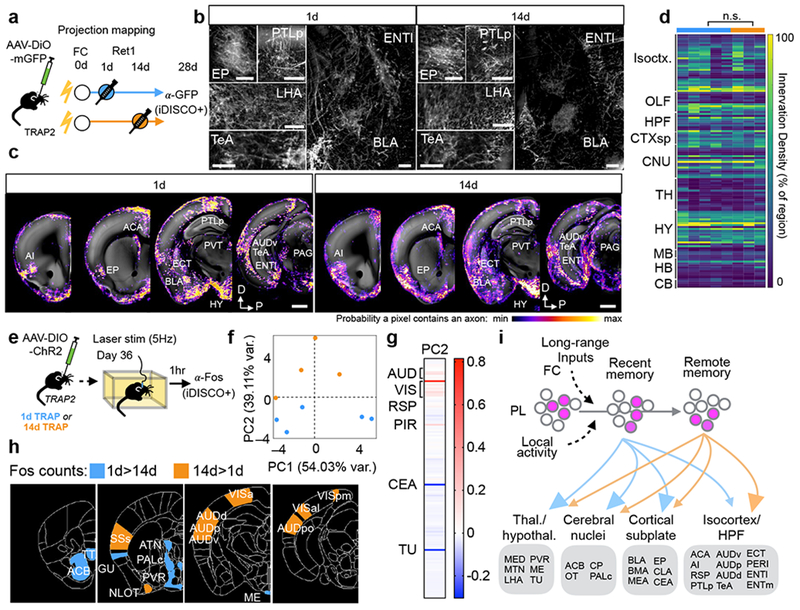
Memories of fearful events can last a lifetime. The prelimbic (PL) cortex, a subregion of prefrontal cortex, plays a critical role in fear memory retrieval over time. Most studies have focused on acquisition, consolidation, and retrieval of recent memories, but much less is known about the neural mechanisms of remote memory. Using a new knock-in mouse for activity-dependent genetic labeling (TRAP2), we demonstrate that neuronal ensembles in the PL cortex are dynamic. PL neurons TRAPed during later memory retrievals are more likely to be reactivated and make larger behavioral contributions to remote memory retrieval compared to those TRAPed during learning or early memory retrieval. PL activity during learning is required to initiate this time-dependent reorganization in PL ensembles underlying memory retrieval. Finally, while neurons TRAPed during earlier and later retrievals have similar broad projections throughout the brain, PL neurons TRAPed later have a stronger functional recruitment of cortical targets.


Conflict of interest statement

Competing interests. The authors declare no competing interests.

Figures

Figure 1:
Figure 1:. TRAP2 design and characterization.
a, Schematic of TRAP2. b, Comparison of FosTRAP (TRAP1) and TRAP2 targeting alleles. Gray, protein coding exons of Fos; pA, SV40 polyA. c, 100 μm optical z-stacks showing tdTomato+ TRAPed cells labeled with an anti-RFP antibody using the iDISCO+ protocol. Scale bar, 100µm. d, TRAP+ cell count differences in brain regions from fear conditioning (FC; N=4) and non-shocked (NS; N=4) groups. Multiple student’s t-test. Box: 25–75th percentile; whiskers: 10–90th percentile, line: median. Stars represent P values from multiple t-tests (two-sided) adjusted for multiple comparisons with the Benjamini, Krieger, and Yekutieli false discovery rate approach (FDR=0.1); see also Table S1. e, Voxel-based statistics based on heatmaps of detected cell centers from ClearMap. Colored regions label significantly different voxels between conditions (FC: N=4; NS: N=4) based on two-sided t-tests. LHA, lateral hypothalamic area; BMA, basomedial amygdalar nucleus; PAG, periacqueductal grey; PB, parabrachial nucleus. See Methods for anatomical abbreviations in d. In all plots and statistical tests, N represents biologically independent animals. Boxes represent 25–75th percentile, whiskers represent 10–90th percentile, lines represent median. *P<0.05, **P<0.01, ***P<0.001, ****P<0.0001.
Figure 2:
Figure 2:. PL activation patterns during fear learning and memory retrieval over time.
a, Potential relationships between PL neurons activated during learning (FC) and remote memory retrieval. b, Experimental design to test models. Circles represent an experience. Filled circles represent experiences paired with 4-OHT injection (TRAPed experience). For simplicity, we depict NS controls as having a retrieval on day 1; however, NS controls were balanced across groups with retrievals occurring on days 1, 7, or 14. c, Example confocal images of TRAPed (left), Fos+ (middle), and TRAP/Fos double-labeled (right) PL neurons from a 7d TRAP2;Ai14 mouse. d, e, Quantification of percent of Fos+ neurons that are TRAPed (d, F(4,41)=13.03, P<0.0001) and percent of TRAPed neurons that are Fos+ (e, F(4,41)=5.45, P=0.0013). N=15, 8, 8, 8, 8 for NS, FC, 1d, 7d, 14d, respectively; one-way ANOVA with Holm-Sidak post-hoc test. Example confocal images and quantifications of of TRAPed and Fos+ cells from 1d- and 14d-TRAPed brains in dentate gyrus (f, Double+/Fos+: P=0.87, t9=0.17; Double+/TRAPed: P=0.46, t9=0.77; N=6, 5 for 1d and 14d, respectively, two-sided unpaired t-test) and basolateral amygdala (g, Double+/Fos+: P=0.0595, t11=2.10; Double+/TRAPed: P=0.0527, t11=2.17; N=8, 5 for 1d and 14d, respectively, two-sided unpaired t-test). Scale bars, 100µm. In all plots and statistical tests, N represents biologically independent animals. Summary graphs show mean±SEM. *P<0.05, **P<0.01, ***P<0.001, ****P<0.0001.
Figure 3:
Figure 3:. Temporal changes in the causal role of TRAPed PL neurons in remote fear memory retrieval.
a, Experimental design. Circles represent an experience. Filled circles represent experiences paired with 4-OHT injection (TRAPed experience). For simplicity, we depict NS controls as having a retrieval on day 1; however, NS controls were balanced across groups with retrievals occurring on days 1, 7, or 14. b, Quantification of contextual freezing with or without (±) ChR2 activation (NS P=0.480, t14=0.73, N=15; FC P=0.083, t17=1.85, N=18; 1d P=0.0026, t18=3.50, N=19; 7d P<0.0001, t13=8.59, N=14; 14d P=0.0004, t9=5.55, N=10; two-sided paired t-tests). c, Summary of contextual freezing for b [FInteraction(3,57)=3.55, P=0.012; FLaser(1,57)=68.27, P<0.0001; N=18, 19, 14, 10 for FC, 1d, 7d and 14d conditions, respectively]. d, Summary of CS+ tone-evoked freezing ± ChR2 activation [FInteraction (3, 57) = 1.86, P=0.148; FLaser(1,57)=1.48, P=0.229, N=18,19,14,10 for FC, 1d, 7d and 14d conditions, respectively]. e, Summary of CS tone-evoked freezing ± ChR2 activation [FInteraction (3, 40) = 0.495, P=0.688; FLaser(1,40)=1.61, P=0.212, N=11, 13, 10, 10 for FC, 1d, 7d and 14d conditions, respectively]. f, Summary of tone-discrimination [(CS+–CS)/(CS++CS)] during 28d retrieval [FInteraction (3, 40) = 0.199, P=0.896; FLaser(1,40)=1.9, P=0.176, N=11, 13, 10, 10 for FC, 1d, 7d and 14d conditions, respectively]. g, Summary of freezing in altered context ± ChR2 activation [FInteraction(3,39)=0.632, P=0.599; FLaser(1,39)=17.11, P=0.003, N=11, 13, 10, 10 for FC, 1d, 7d and 14d conditions, respectively]. h, Summary of CS+ tone-evoked freezing in altered context ± ChR2 activation [FInteraction(3,33)=2.255, P=0.100; FLaser(1,33)=0.296, P=0.590, N=9, 10, 10, 8 for FC, 1d, 7d and 14d conditions, respectively]. Statistics in c–h reflect 2-way repeated measures ANOVA with multiple comparisons using post-hoc Sidak correction. See also Supplementary Fig. 8d–h for plots showing individual data points for d–h. In all plots and statistical tests, N represents biologically independent animals. Summary graphs show mean±SEM. *P<0.05, **P<0.01, ***P<0.001, ****P<0.0001.
Figure 4:
Figure 4:. Effects of inhibiting PL neurons on remote memory retrieval.
a, Experimental protocol for optogenetic inhibition of TRAPed PL neurons. b, c, Quantification of contextual, CS+, and CS-evoked freezing and tone discrimination [(CS+–CS)/(CS++CS)] ± iC++ inhibition for (b) 1d-TRAPed [context: P=0.334, t6=1.05, N=7; CS+: P=0.113, t6=1.85, N=7; CS: P=0.556, t5=0.63, N=6; tone discrimination: P=0.337, t5=1.06, N=6; two-sided paired t-tests] and (c) 14d-TRAPed mice [context: P=0.161, t6=0.99, N=7; CS+: P=0.0035, t6=4.84, N=7; CS: P=0.548, t6=0.66, N=7; tone discrimination: P=0.048; t6=2.47, N=7, two-sided paired t-tests]. d, Experimental protocol for chemogenetic silencing during learning and subsequent TRAPing and memory retrieval. e, Confocal image of dual virus injection. Filled arrows represent double-labeled cells, open arrow represents an eYFP-only cell. Scale bar, 500µm. f, g, Behavioral data on contextual (f) and tone (g) fear memory. Blue, ChR2 activation. Statistics for f: [FInteraction(1,15)=20.2, P=0.0004; FLaser(1,15)=31.58, P<0.0001, g: FInteraction(1,30)=0.011, P=0.916; FLaser(1,30)=0.158, P=0.694; N=6 (–hM4D) and N=11 (+hM4D), 2-way repeated measures ANOVA with multiple comparisons corrected with post-hoc Holm-Sidak test]. In all plots and statistical tests, N represents biologically independent animals. Summary graphs show mean±SEM. *P<0.05, **P<0.01, ***P<0.001, ****P<0.0001.
Figure 5:
Figure 5:. Relating whole-brain TRAPing patterns to memory-guided behavior.
a, Experimental design. b, Analysis pipeline. c, tSNE representation of brain areas across replica mice (1d: N=7, 14d: N=9 biologically independent animals), where each dot represents a single brain area and distance in tSNE space reflects similarity in counts of TRAPed neurons for that particular brain area across all mice. A subset of brain areas that belong to PL cluster in 1d and 14d TRAP is indicated. d, List of brain regions by assigned cluster for 1d- and 14d-TRAPed brains sorted by 1d TRAP condition. e–h Pearson correlations of regional TRAP counts (1d: N=7, 14d: N=9 biologically independent animals) with tone discrimination [(CS+–CS)/(CS++CS)] color mapped onto tSNE clusters (as shown in c), or onto coronal sections from a standard brain for 1d-TRAP (e,f) and 14d-TRAP (g,h) brains (see also Table S2). See Methods for anatomical abbreviations.
Figure. 6:
Figure. 6:. Whole-brain analyses of network involving TRAPed PL neurons.
a–d, Projection mapping of 1d- and 14d-TRAPed PL neurons. a, Experimental design. b, Coronal 100μm optical stacks showing iDISCO+ labeling of GFP+ axons from TRAPed PL neurons in representative brains. Scale bars, 200µm. c, Probability maps showing 1d- and 14d-TRAPed PL axon innervation by region from representative brains overlaid onto a standard brain. d, Heatmap showing axon innervation by region for TRAPed axons (1d: N=5, 14d: N=3 biologically independent animals, see also Table S3 for statistical comparisons). e–g, Whole-brain Fos patterns in response to activating 1d- and 14d-TRAPed PL neurons. e, Experimental design. f, Locations of individual mice projected in principal component (PC) space defined by the first two PCs (arbitrary PC units, 1d: N=5, 14d: N=4 biologically independent animals). g, Loadings for PC2 (arbitrary PC weight units). h, Visualization of regions with differential Fos expression in 1d- and 14d-TRAPed brains (1d: N=5, 14d: N=4 biologically independent animals; see also Table S4). i, Working model representing that PL ensembles involved in the memory trace are recruited over time and that despite having similar projection patterns, PL cells involved in remote memory more strongly recruit cortical targets. See Methods for anatomical abbreviations.

Comment in

  • Recalling old memories.
    Lewis S. Lewis S. Nat Rev Neurosci. 2019 Apr;20(4):190-191. doi: 10.1038/s41583-019-0142-4. Nat Rev Neurosci. 2019. PMID: 30787464 No abstract available.

References

    1. Maren S Neurobiology of Pavlovian Fear Conditioning. Annu. Rev. Neurosci 24, 897–931 (2001). - PubMed
    1. Frankland PW & Bontempi B The organization of recent and remote memories. Nat. Rev. Neurosci. 6, 119–30 (2005). - PubMed
    1. Do Monte F, Quirk G, Li B & Penzo M Retrieving fear memories, as time goes by…. Mol. Psychiatry 21, 1027–1036 (2016). - PMC - PubMed
    1. Gale GD Role of the Basolateral Amygdala in the Storage of Fear Memories across the Adult Lifetime of Rats. J. Neurosci 24, 3810–3815 (2004). - PMC - PubMed
    1. Grewe BF et al. Neural ensemble dynamics underlying a long-term associative memory. Nature 543, 670–675 (2017). - PMC - PubMed

Additional References:

    1. Paxinos G & Franklin KBJ The Mouse Brain in Stereotaxic Coordinates, Second Edition. (Academic Press, 2001).
    1. Beier KT et al. Circuit Architecture of VTA Dopamine Neurons Revealed by Systematic Input-Output Mapping. Cell 162, 622–634 (2015). - PMC - PubMed
    1. Zhou T et al. History of winning remodels thalamo-PFC circuit to reinforce social dominance. Science. 357, 162–168 (2017). - PubMed
    1. Wayman WN & Woodward JJ Chemogenetic Excitation of Accumbens-Projecting Infralimbic Cortical Neurons Blocks Toluene-Induced Conditioned Place Preference. J. Neurosci. 38, 1462–1471 (2018). - PMC - PubMed
    1. Shekhar K et al. Comprehensive Classification of Retinal Bipolar Neurons by Single-Cell Transcriptomics. Cell 166, 1308–1323.e30 (2016). - PMC - PubMed

Publication types

LinkOut - more resources