. 2019 Feb;25(2):249-254.
doi: 10.1038/s41591-018-0326-x. Epub 2019 Jan 28.

Identification of preexisting adaptive immunity to Cas9 proteins in humans

Affiliations

Identification of preexisting adaptive immunity to Cas9 proteins in humans

Carsten T Charlesworth et al. Nat Med. 2019 Feb.

Abstract

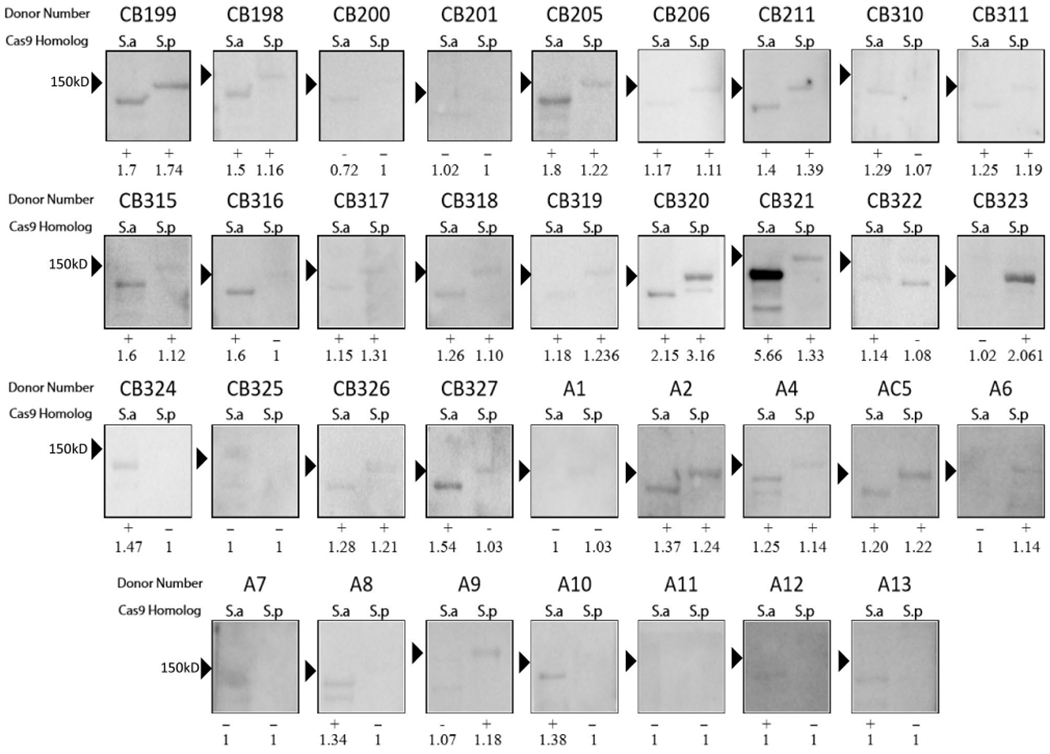
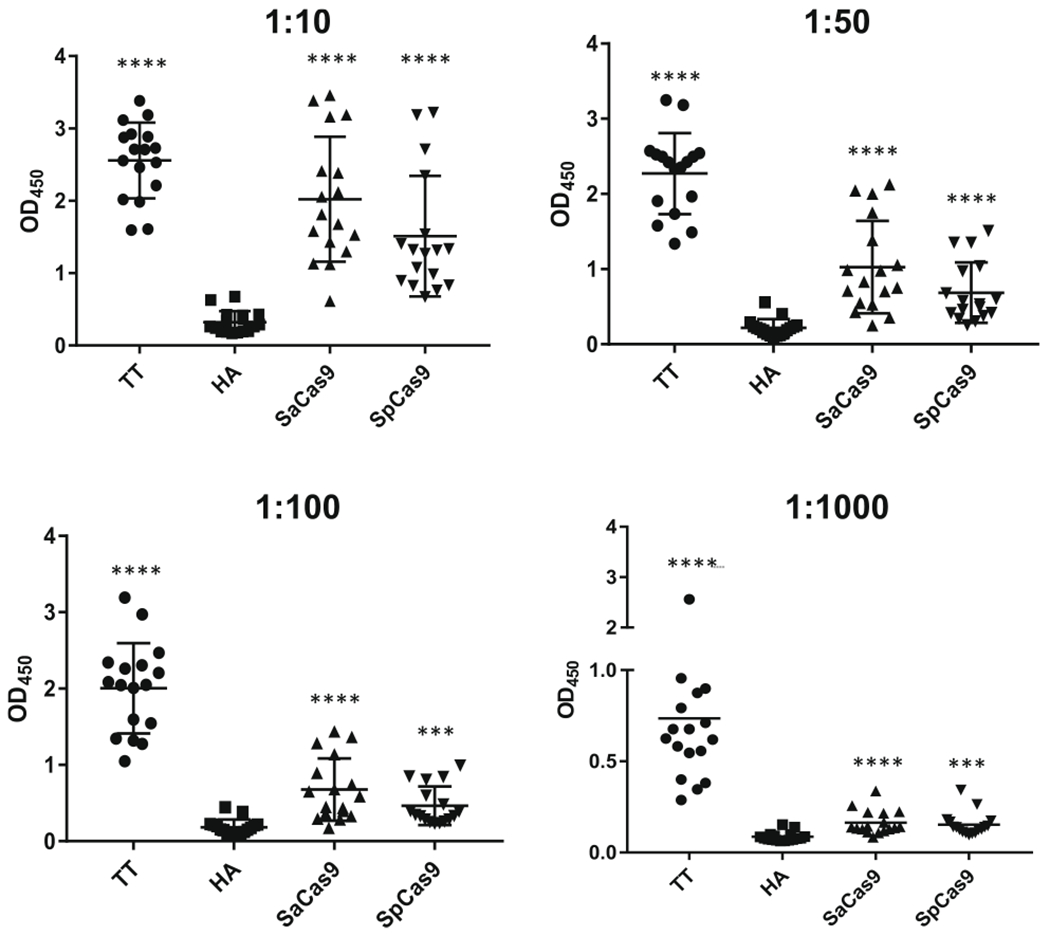
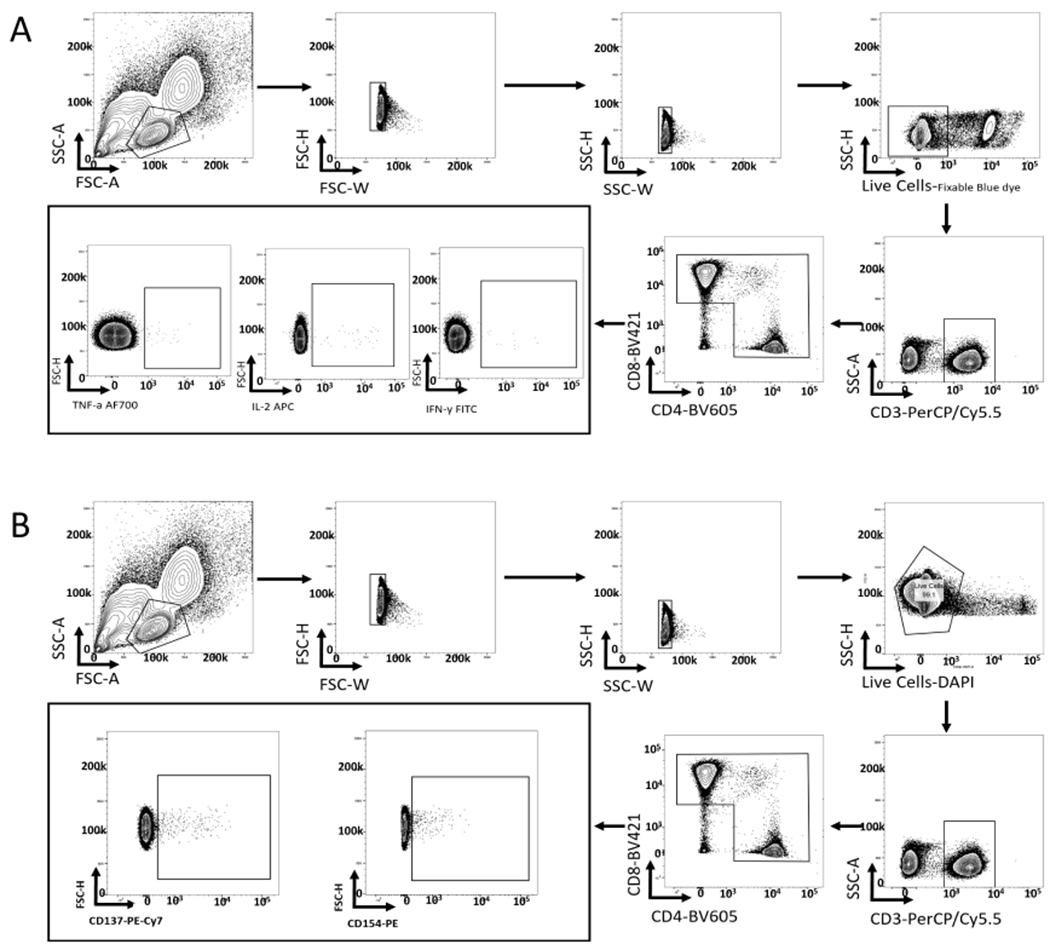
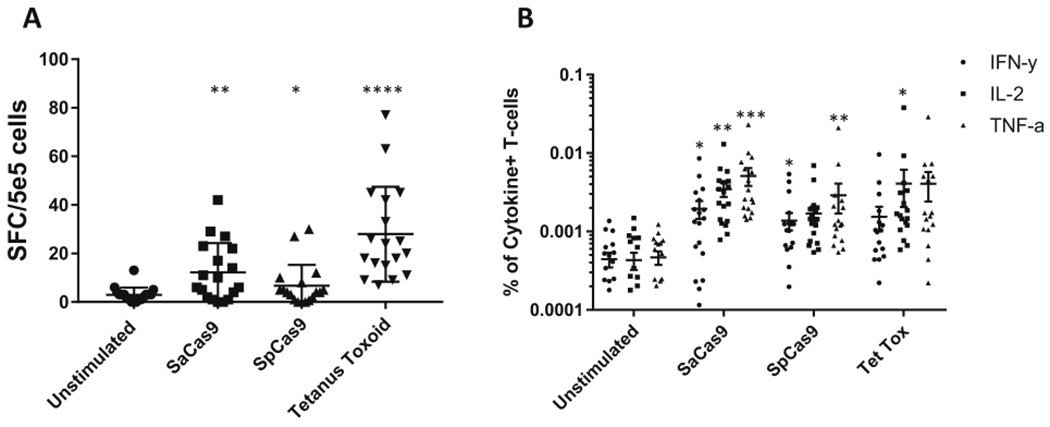
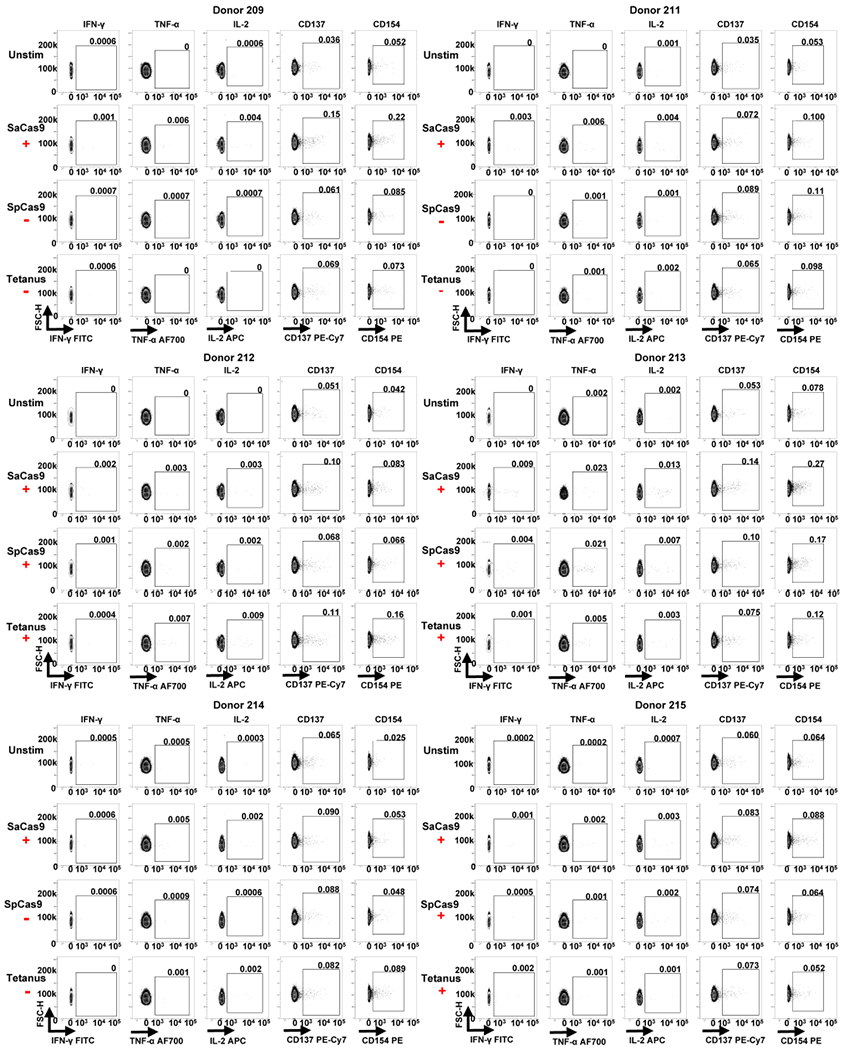
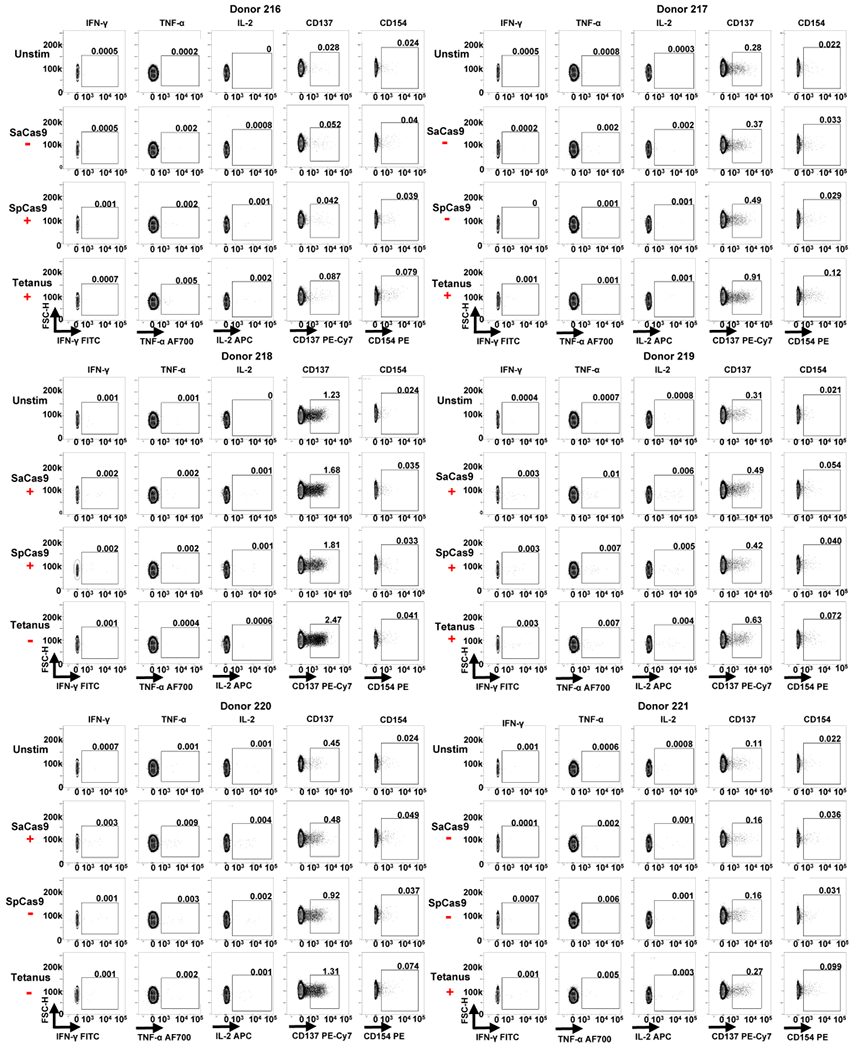
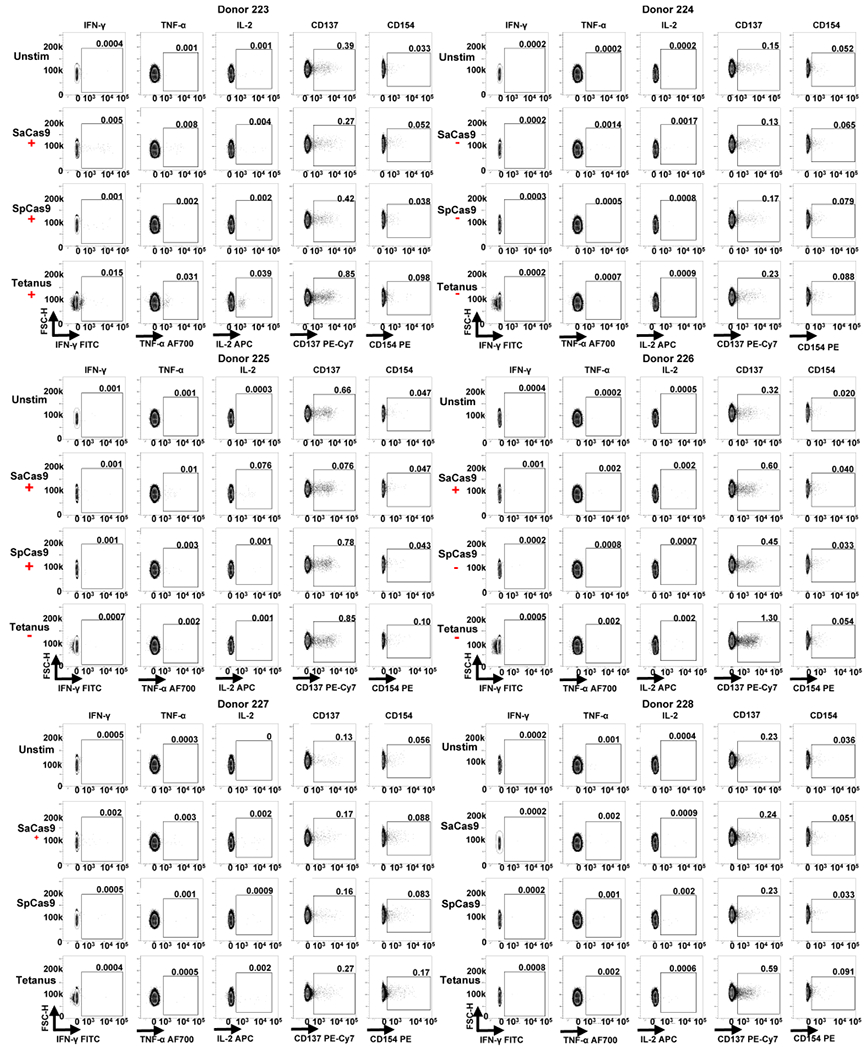
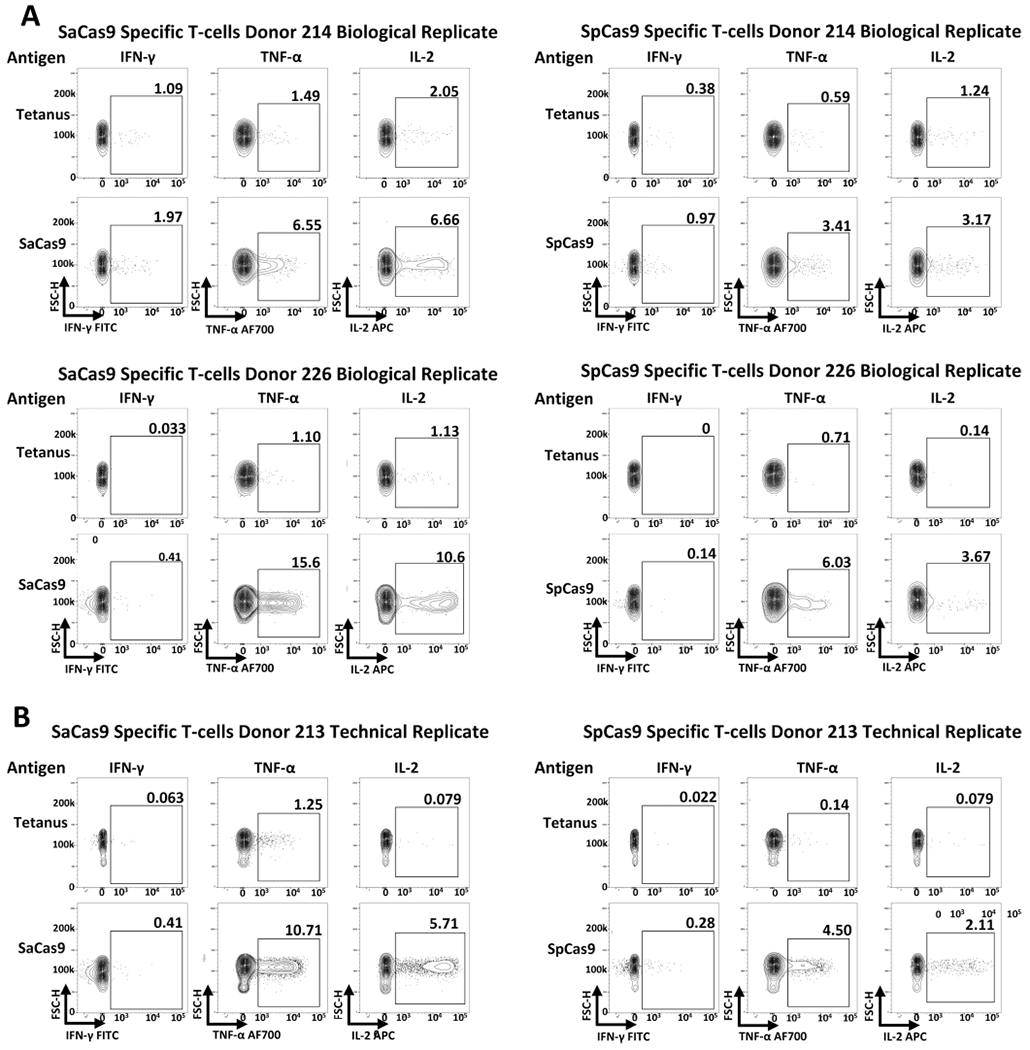
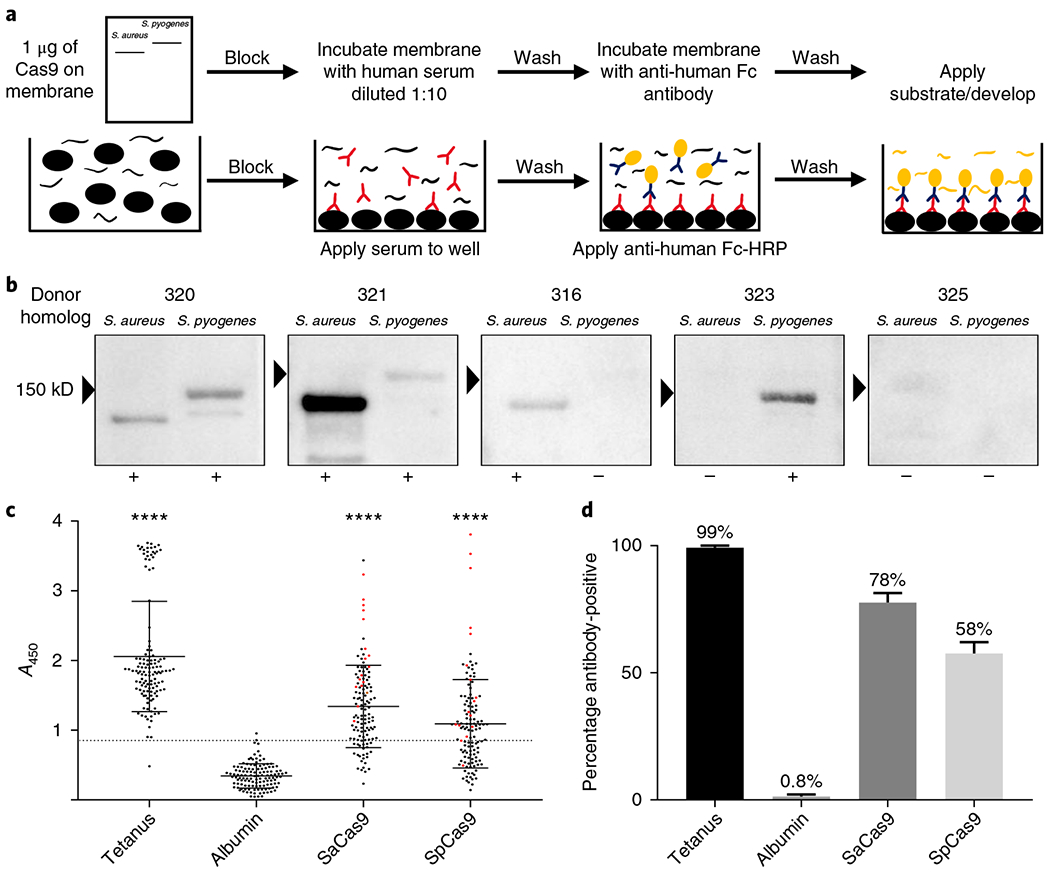
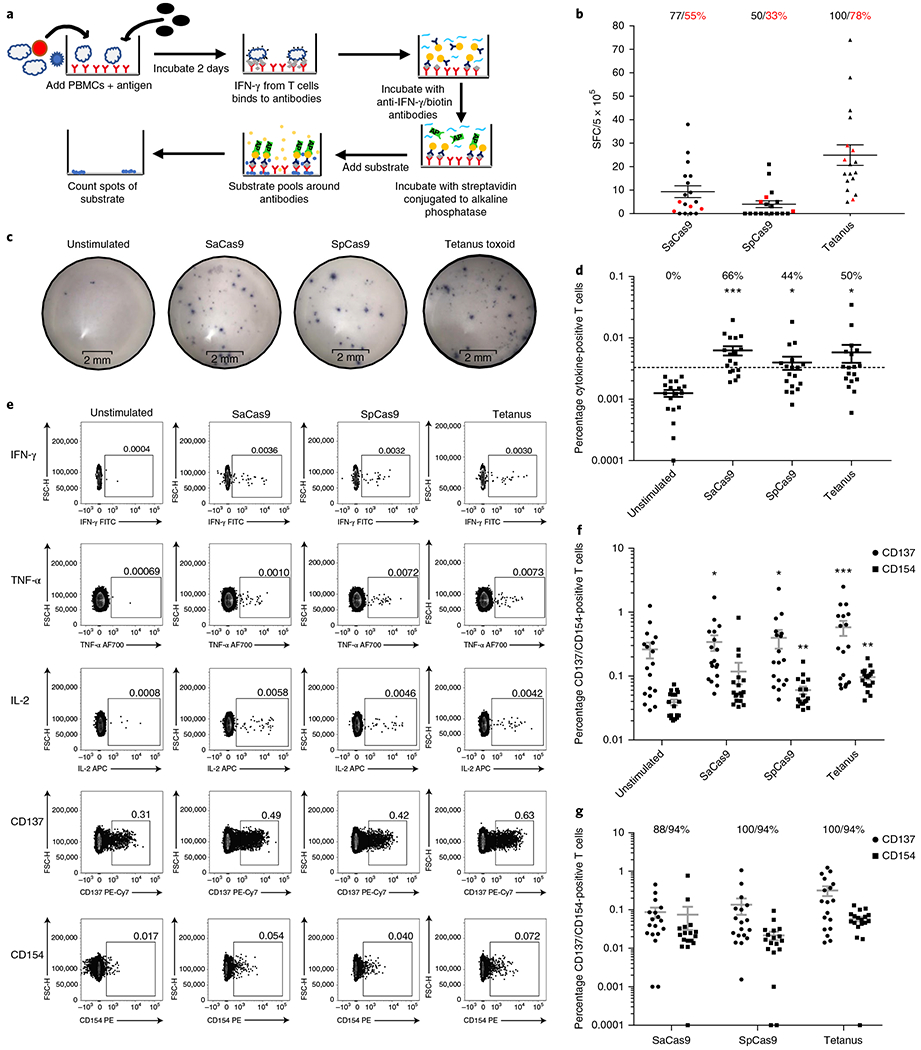
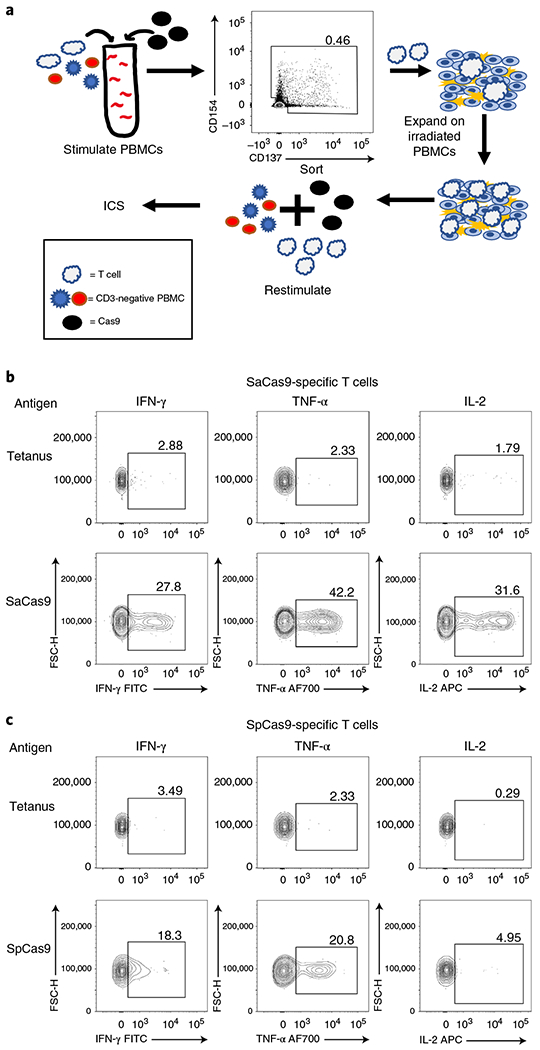
The CRISPR-Cas9 system is a powerful tool for genome editing, which allows the precise modification of specific DNA sequences. Many efforts are underway to use the CRISPR-Cas9 system to therapeutically correct human genetic diseases1-6. The most widely used orthologs of Cas9 are derived from Staphylococcus aureus and Streptococcus pyogenes5,7. Given that these two bacterial species infect the human population at high frequencies8,9, we hypothesized that humans may harbor preexisting adaptive immune responses to the Cas9 orthologs derived from these bacterial species, SaCas9 (S. aureus) and SpCas9 (S. pyogenes). By probing human serum for the presence of anti-Cas9 antibodies using an enzyme-linked immunosorbent assay, we detected antibodies against both SaCas9 and SpCas9 in 78% and 58% of donors, respectively. We also found anti-SaCas9 T cells in 78% and anti-SpCas9 T cells in 67% of donors, which demonstrates a high prevalence of antigen-specific T cells against both orthologs. We confirmed that these T cells were Cas9-specific by demonstrating a Cas9-specific cytokine response following isolation, expansion, and antigen restimulation. Together, these data demonstrate that there are preexisting humoral and cell-mediated adaptive immune responses to Cas9 in humans, a finding that should be taken into account as the CRISPR-Cas9 system moves toward clinical trials.


Figures

Extended Data Fig. 1 |
Extended Data Fig. 1 |. Initial screen for anti-Cas9 donors by immunoblot.
Immunoblot analysis using healthy donor serum to determine if humans have IgG antibodies to Cas9 proteins. Serum derived from cord blood (labeled ‘CB’) or adults (labeled ‘A’) and immunoreactivity against purified Cas9 proteins are shown. S.a, S. aureus Cas9 ortholog; S.p, S. pyogenes Cas9 ortholog. Each lane with a detectable band was analyzed for volume and the score of Cas9 to the background was measured by dividing the volume of the Cas9 band by the volume of the background. Each immunoblot was scored as either positive (+) or negative (−) for immunoreactivity. To be considered serum-positive for antibodies against either Cas9 ortholog, a band must have been present at the correct size on the immunoblot and have had a ratio of 1.10 over the background. A ratio of 1 indicates that no band could be detected at the correct molecular weight.
Extended Data Fig. 2 |
Extended Data Fig. 2 |. Titers of human serum concentrations used to detect anti-Cas9 antibodies with ELISA.
The same donor’s serum was applied at different concentrations by ELISA to detect antibodies against each antigen. The dilution of serum used to detect antibodies against each antigen is denoted above each graph.
Extended Data Fig. 3 |
Extended Data Fig. 3 |. Representative gating strategy to detect antigen-reactive T cells.
a, Representative gating strategy to detect antigen-reactive T cells by ICS. b, Representative gating strategy for detecting CD137 and CD154-positive T cells.
Extended Data Fig. 4 |
Extended Data Fig. 4 |. Cytokine responses to antigen stimulation of PBMCs.
a, Frequency of spots detected when 5×10⁵ PBMCs were applied to wells of an ELISpot plate and challenged with each different antigen; the error bars represent the s.d. (n = 18). Significance was measured using a paired Student’s t-test. b, Frequency of T cells that were positive for different cytokines on antigen stimulation, as detected by ICS (n = 18). The black bars indicate the mean percentage of T cells positive for each cytokine (n = 18). *P<0.05, **P< 0.01, ***P< 0.001, paired Student’s t-test. Each dataset was tested for significance against the unstimulated control.
Extended Data Fig. 5 |
Extended Data Fig. 5 |. FACS data from ICS and activation marker staining for donors 209 and 211-215.
Each individual donor number is shown at the top of each group of FACS plots. The red ‘+’ symbol below an antigen name indicates that a donor was considered positive for a cytokine response against that antigen by ICS. The red ‘−’ symbol below an antigen name indicates a donor was considered negative for a cytokine response to that antigen by ICS.
Extended Data Fig. 6 |
Extended Data Fig. 6 |. FACS data from ICS and activation marker staining for donors 16-221.
Each individual donor number is shown at the top of each group of FACS plots. The red ‘+’ symbol below an antigen name indicates that a donor was considered positive for a cytokine response against that antigen by ICS. The red ‘−’ symbol below an antigen name indicates that a donor was considered negative for a cytokine response to that antigen by ICS.
Extended Data Fig. 7 |
Extended Data Fig. 7 |. FACS data from ICS and activation markers staining for donors 223-228.
Each individual donor number is shown at the top of each group of FACS plots. The red ‘+’ symbol below an antigen name indicates that a donor was considered positive for a cytokine response against that antigen by ICS. The red ‘−’ symbol below an antigen name indicates that a donor was considered negative for a cytokine response to that antigen by ICS.
Extended Data Fig. 8 |
Extended Data Fig. 8 |. Results from expansion and restimulation of antigen-specific T cells against Cas9.
a, Results from the isolation, expansion, and restimulation of antigen-specific T cells against Cas9 from two additional PBMC donors to the donor presented in Fig. 3. b, Results from a technical replicate of expansion/restimulation of antigen-specific T cells against Cas9 from donor 213; the other replicate was presented in Fig. 3b.
Fig. 1 |
Fig. 1 |. Identification of preexisting humoral immunity to Cas9.
a, Top, schematic representation of the workflow used to perform an immunoblot to detect antibodies against Cas9. Bottom, schematic representation of the workflow used to perform an ELISA to detect antibodies against different antigens. b, Representative images from the immunoblots performed to detect antibodies against Cas9, which demonstrate a range of responses in different donors. The ‘+’ symbols indicate that a donor was considered positive for antibodies against Cas9; the ‘−’ symbols indicate that a donor was considered negative for antibodies against Cas9. c, Results from the ELISA screen performed at a serum dilution of 1:50 to detect antibodies against Cas9 (n = 125). All donors above the dotted line were considered antibody-positive; the line represents the mean absorbance of the negative control, human albumin, plus three s.d. from the mean. The red dots indicate donors tested for a T cell response to Cas9 and the black bars indicate the mean and s.d. of each dataset. ****P<0.0001 as determined by an unpaired Student’s t-test. Each antigen was tested for significance against the negative control, human albumin. d, Bar graph indicating the frequency at which different donors were positive for a humoral response against each antigen, as determined by ELISA.
Fig. 2 |
Fig. 2 |. Identification of Cas9-specific T cell responses in humans.
a, Schematic outlining the workflow for detecting antigen-reactive T cells by ELISpot. b, Results from the ELISpot assay. Each donor was tested in replicates of three. The average number of spots from the unstimulated sample was subtracted from samples that received each different antigen; negative values were set to zero. The red dots indicate donors who did not have a statistically significant difference in the frequency of spots compared to the unstimulated sample (unpaired Student’s t-test, P < 0.05). The black text indicates the percentage of donors with an increase in spots over the unstimulated sample and the red text indicates the percentage of donors with a statistically significant increase in spots compared with the unstimulated sample. The black bars indicate the mean and 95% confidence interval (CI) (n= 18). SFC, spot-forming cells. c, Representative images from the ELISpot assay from a single donor who was positive for an antigen-reactive T cell response to both Cas9 orthologs and to tetanus toxoid. d, Frequency of T cells that were positive for a cytokine response when each different antigen was added to the culture. Donors above the dotted line were considered positive for a cytokine response to each antigen. The cutoff was determined by taking the mean frequency of cytokine-positive T cells in the unstimulated sample and adding three times the s.d. of the mean. The text indicates the percentage of donors that were positive for a cytokine response to each different antigen. The black bars indicate the mean and 95% CI. Samples that had no cytokine-positive cells were set to 0.0001. *P < 0.05, ***P < 0.001, paired t-test; each dataset was tested against the unstimulated control for significance (n= 18). e, Representative fluorescence-activated cell sorting (FACS) plots from the same donor as in c, who was positive for both cytokine and activation marker responses to both Cas9 orthologs and to the positive control, tetanus toxoid. FITC, fluorescein isothiocyanate; FSC-H, forward scatter height; AF700, Alexa Fluor 700; PE-Cy7, streptavidin. f, Frequency of CD137-negative and CD154-positive T cells when each different antigen was added to the culture; the gray bars represent the mean and 95% CI. *P <0.05, **P < 0.01, and ***P < 0.001 as determined by a paired t-test. Each dataset was tested for significance against the unstimulated control (n= 18). g, Percentage of T cells that were positive for CD137 or CD154 over the unstimulated control. The graph conveys the frequency of CD137/CD154 T cells after the background (the unstimulated control) was subtracted (n= 18). The text indicates the percentage of donors who had an increase in each activation marker compared to the unstimulated control; the gray bars indicate the median and 95% CI. Negative values were set to 0.0001.
Fig. 3 |
Fig. 3 |. Isolation and restimulation of Cas9-specific T cells.
a, Schematic outlining the process for isolating antigen-reactive T cells, expanding isolated T cells, and restimulating expanded T cells with CD3-depleted PBMCs from the same donor with antigen. b, FACS plots demonstrating that expanded SaCas9-specific T cells from donor 213 have an antigen-reactive cytokine response when rechallenged with SaCas9, but not to tetanus toxoid. c, FACS plots demonstrating that expanded SpCas9-specific T cells from donor 213 have an antigen-specific cytokine response to SpCas9 but not to tetanus toxoid when re-stimulated. FITC, fluorescein isothiocyanate; FSC-H, forward scatter height; AF700, Alexa Fluor 700.

Comment in

  • Human immunity to Cas9.
    Rusk N. Rusk N. Nat Methods. 2019 Apr;16(4):286. doi: 10.1038/s41592-019-0385-z. Nat Methods. 2019. PMID: 30923392 No abstract available.

References

    1. Dever DP et al. CRISPR/Cas9 β-globin gene targeting in human haematopoietic stem cells. Nature 539, 384–389 (2016). - PMC - PubMed
    1. Eyquem J et al. Targeting a CAR to the TRAC locus with CRISPR/Cas9 enhances tumour rejection. Nature 543, 113–117 (2017). - PMC - PubMed
    1. DeWitt MA et al. Selection-free genome editing of the sickle mutation in human adult hematopoietic stem/progenitor cells. Sci. Transl. Med 8, 360ra134 (2016). - PMC - PubMed
    1. Zuris JA et al. Cationic lipid-mediated delivery of proteins enables efficient protein-based genome editing in vitro and in vivo. Nat. Biotechnol 33, 73–80 (2015). - PMC - PubMed
    1. Ran FA et al. In vivo genome editing using Staphylococcus aureus Cas9. Nature 520, 186–191 (2015). - PMC - PubMed

Publication types

Substances