. 2019 Mar;25(3):496-506.
doi: 10.1038/s41591-018-0336-8. Epub 2019 Jan 28.

ApoE attenuates unresolvable inflammation by complex formation with activated C1q

Affiliations

ApoE attenuates unresolvable inflammation by complex formation with activated C1q

Changjun Yin et al. Nat Med. 2019 Mar.

Erratum in

Abstract

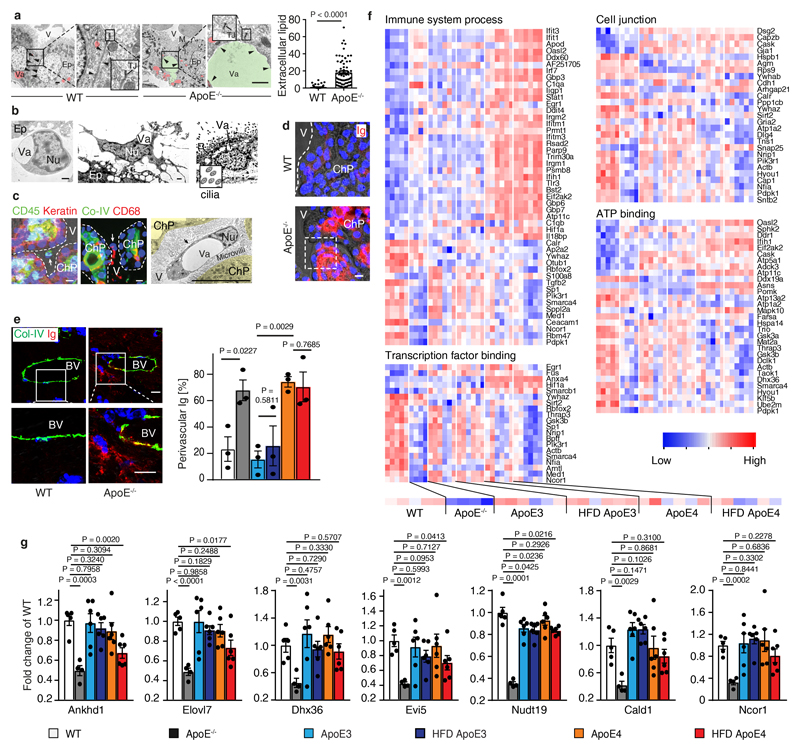
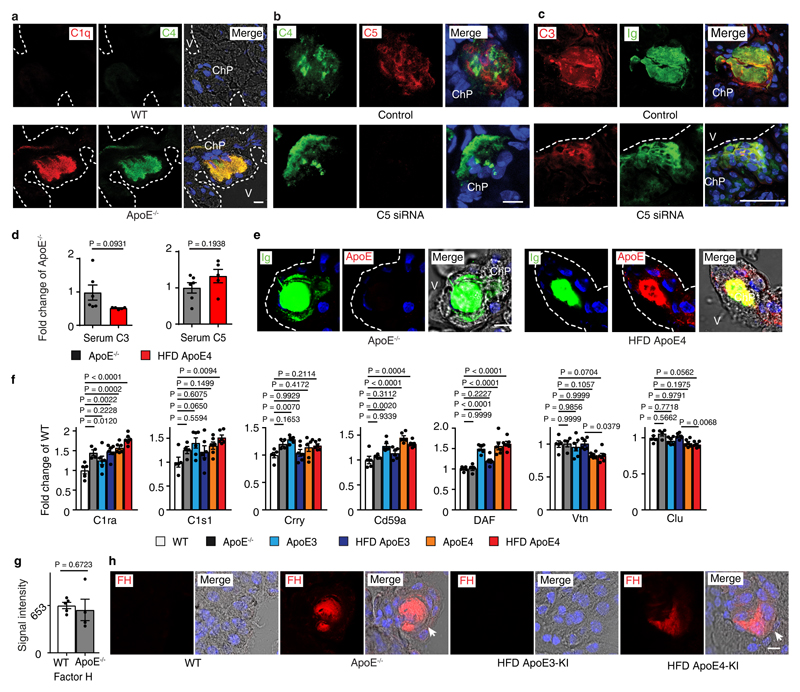
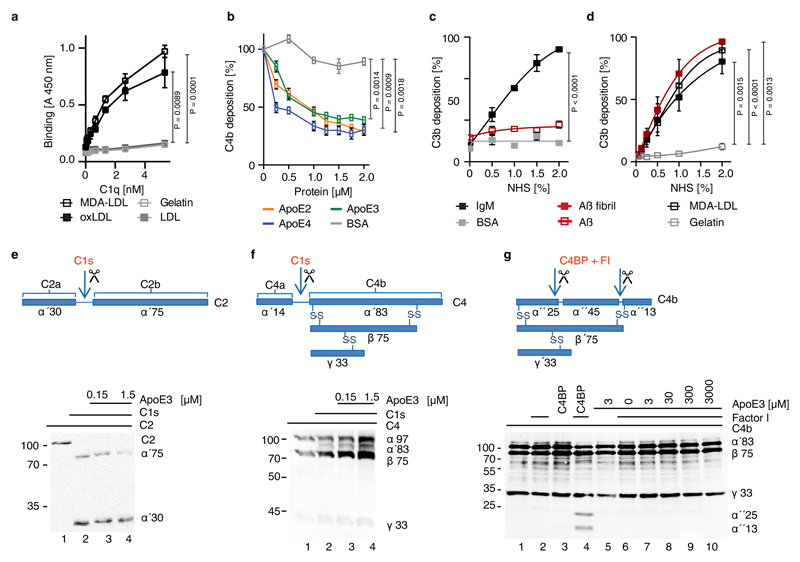
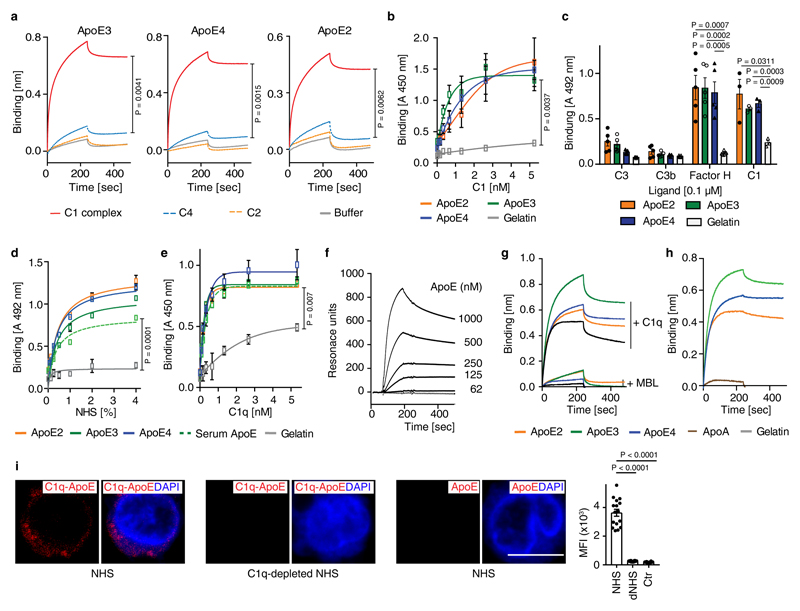
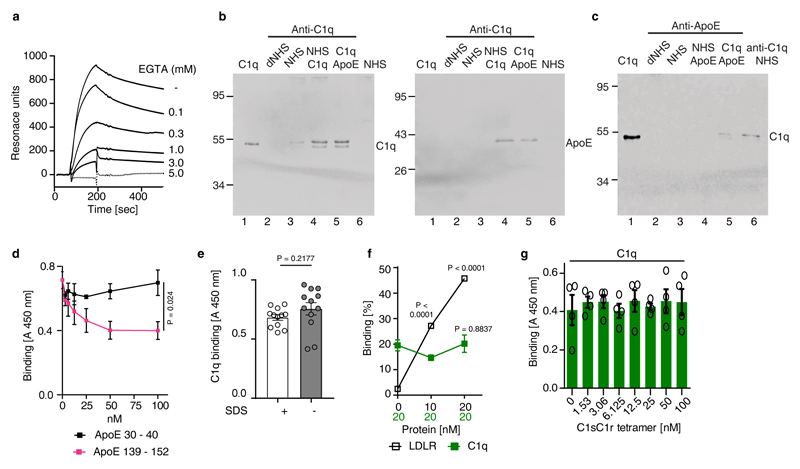
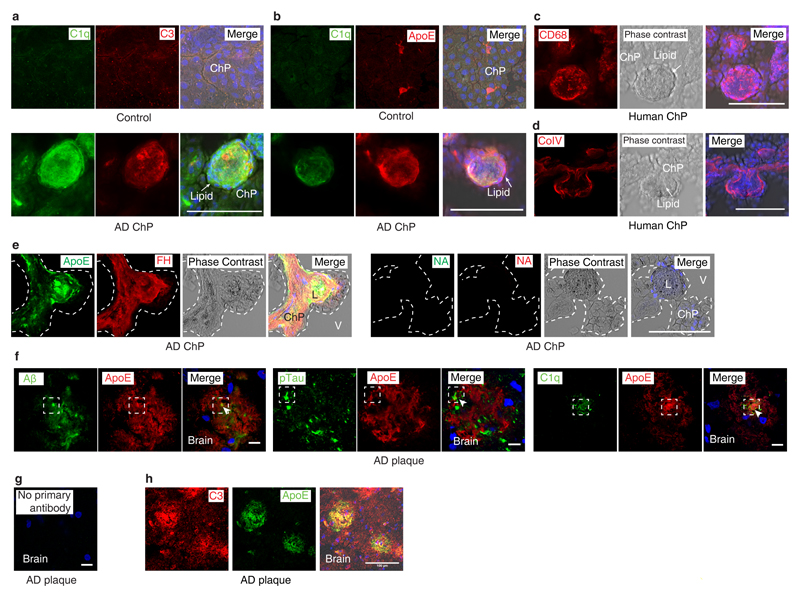
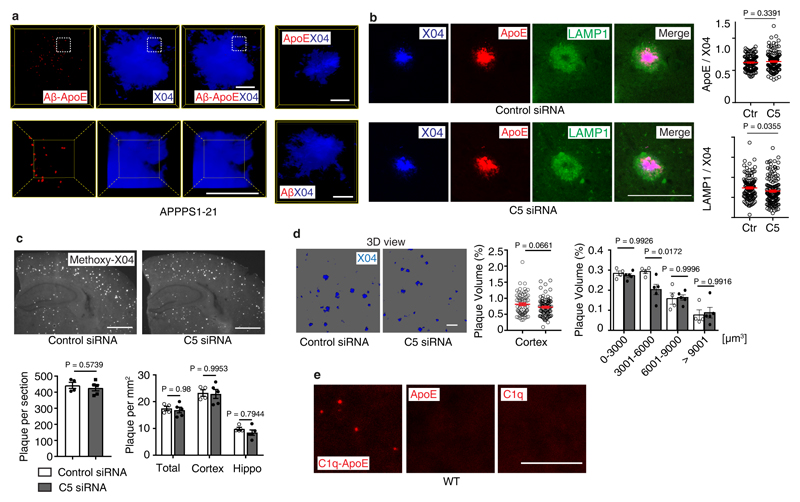
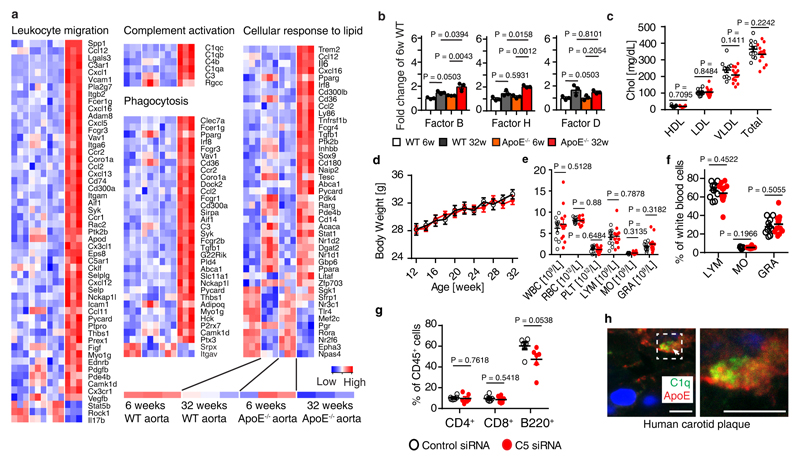
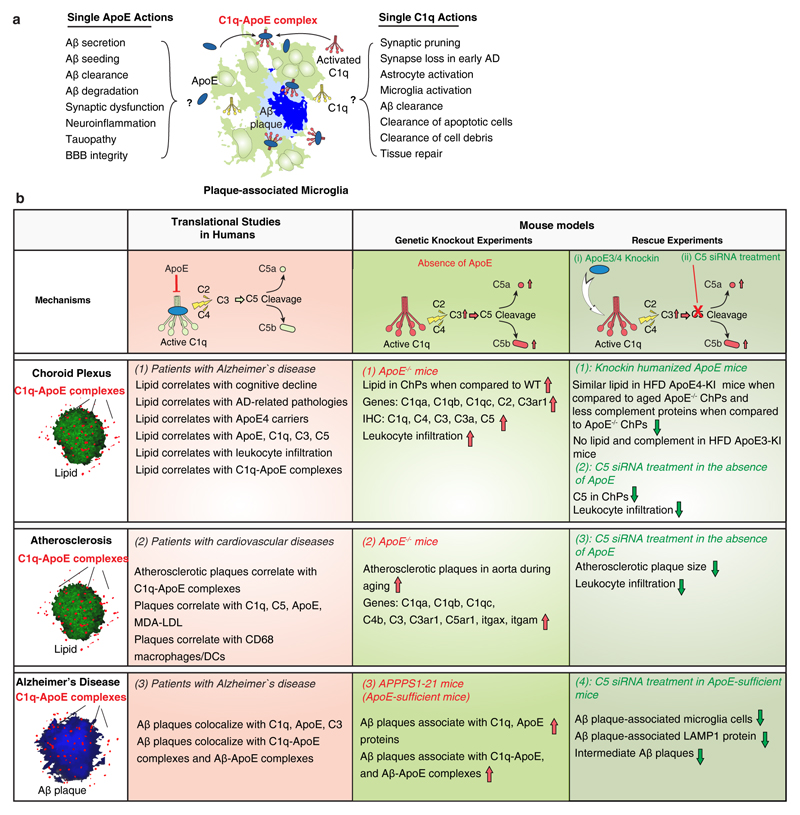
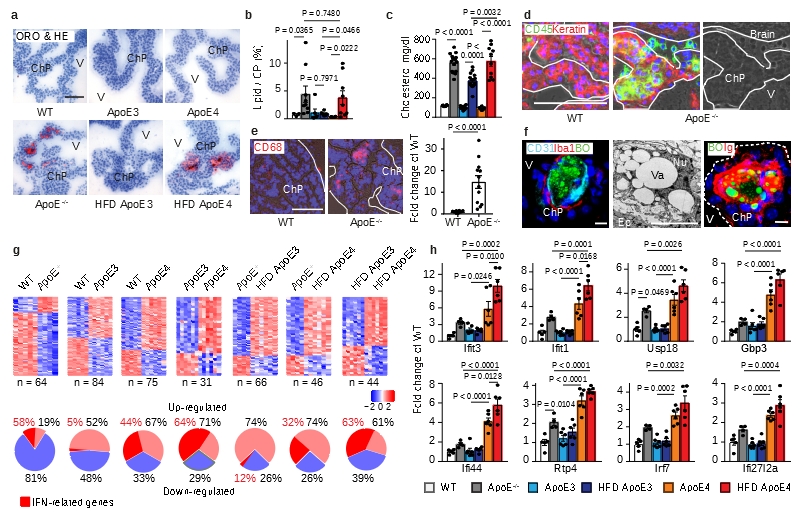
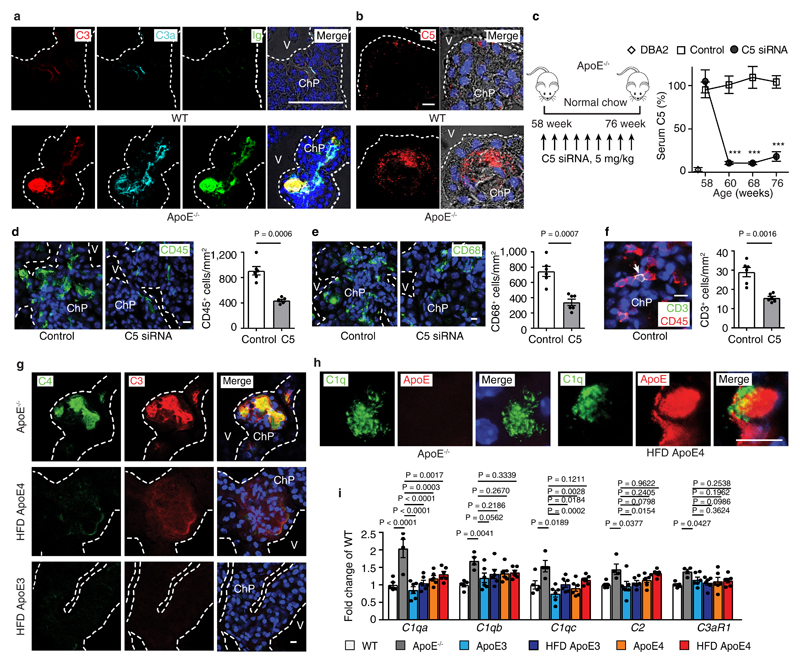
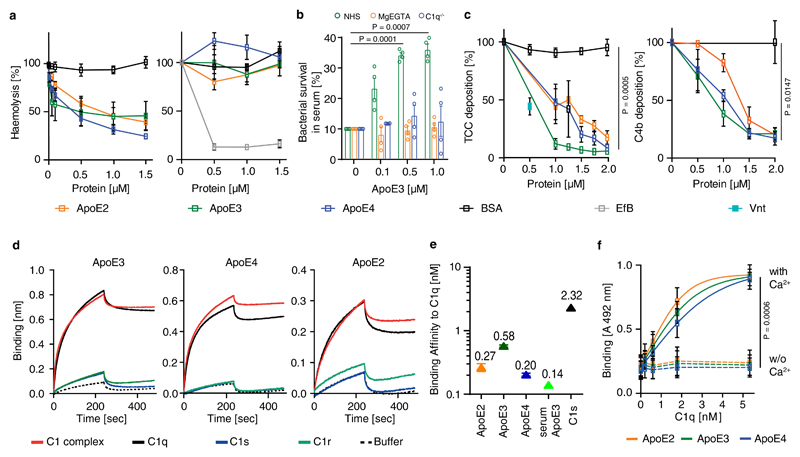
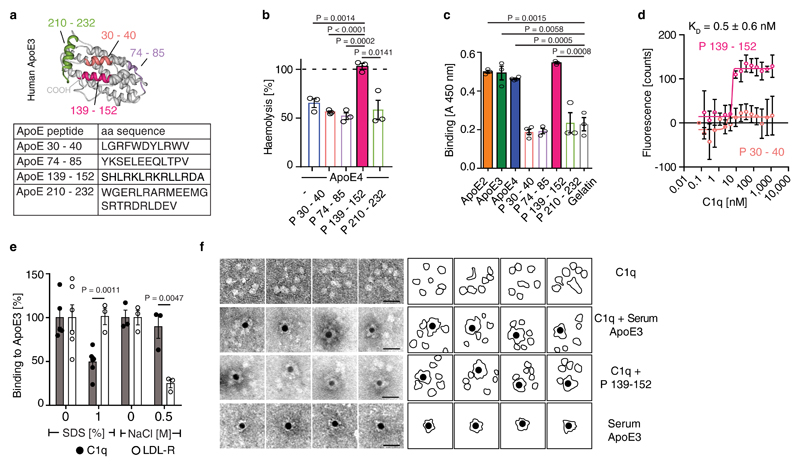
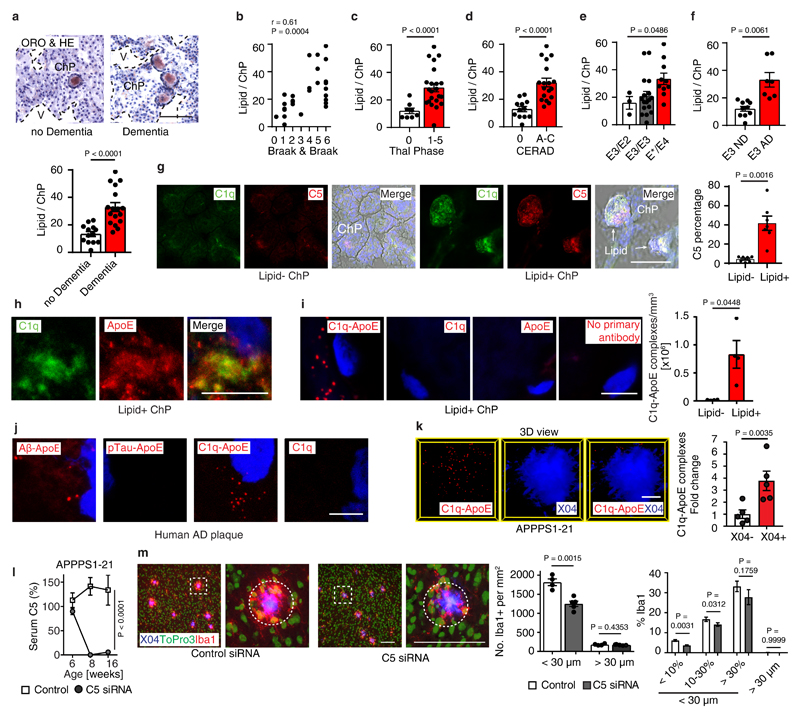
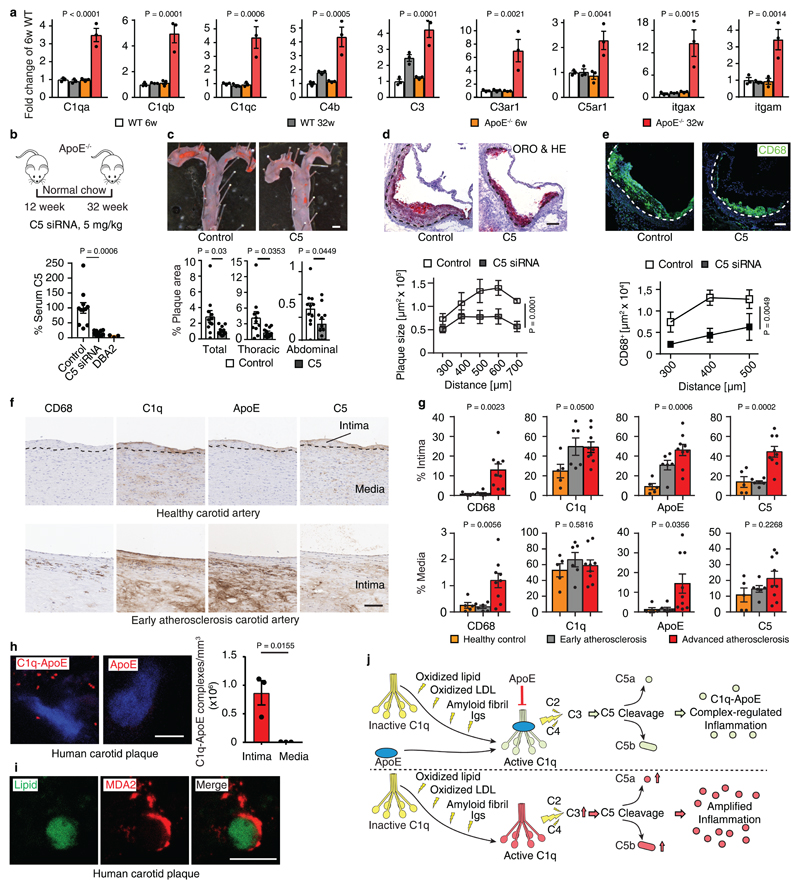
Apolipoprotein-E (ApoE) has been implicated in Alzheimer's disease, atherosclerosis, and other unresolvable inflammatory conditions but a common mechanism of action remains elusive. We found in ApoE-deficient mice that oxidized lipids activated the classical complement cascade (CCC), resulting in leukocyte infiltration of the choroid plexus (ChP). All human ApoE isoforms attenuated CCC activity via high-affinity binding to the activated CCC-initiating C1q protein (KD~140-580 pM) in vitro, and C1q-ApoE complexes emerged as markers for ongoing complement activity of diseased ChPs, Aβ plaques, and atherosclerosis in vivo. C1q-ApoE complexes in human ChPs, Aβ plaques, and arteries correlated with cognitive decline and atherosclerosis, respectively. Treatment with small interfering RNA (siRNA) against C5, which is formed by all complement pathways, attenuated murine ChP inflammation, Aβ-associated microglia accumulation, and atherosclerosis. Thus, ApoE is a direct checkpoint inhibitor of unresolvable inflammation, and reducing C5 attenuates disease burden.


Conflict of interest statement

Competing Interests Statement

C.Y., A.J.R.H., A.B., S.K.M., S.A., P.F.Z., and C.S. declare competing financial interests. C.Y., S.K.M., and A.J.R.H. are owners of Easemedcontrol R & D GmbH & Co KG Munich, Germany; A.B. is employed by Alnylam Pharmaceuticals Cambridge; Cambridge, MA, USA; C.Y. and A.J.R.H. have been named inventors on a pending patent application related to treatment and diagnosis of unresolvable inflammatory diseases (EP18183584.4); A.B. has been named as an inventor on patent applications related to C5 including PCT publication WO2014160129, and applications and patents based thereon; S.A., P.F.Z., and C.S. have been named inventors on a pending patent application (DE 10 2018 100 377.3).

Figures

Extended Figure 1
Extended Figure 1. Lipid deposits, BBB, and ChP gene signatures
(a) Vacuole (Va) represents lipid. Intercellular lipid (green) between two epithelial cells was quantified. 68 intercellular spaces from 3 ApoE-/- and 67 intercellular spaces from 3 WT mice were analyzed. Bar represents 1 µm. (b) Lipid in ApoE-/- ChPs by TEM. Lymphocytes (left panel); macrophages/dendritic cells (DC) (middle panel); and ependymal cells contain lipid (right panel). Vacuole (Va) represents lipid. Bar 1 µm; (c) ChPs were stained for cytokeratin (keratin, red) and leukocytes (CD45, green) (left panel); collagen IV (Co-IV, green) and CD68 (red) (middle panel). TEM shows single macrophage-foam cell/DCs adjacent to microvilli. Bar 10 µm; (d) ChPs were stained with Ig (red) as described in Methods. Bars 10 µm; (e) PFA-perfused brains were stained for Ig (Ig, red) and blood vessels (Col-IV, green) in the cerebellum. Perivascular Ig adjacent to blood vessels was quantified as described in Methods. WT (n = 3 mice); ApoE-/- (n=3); ND ApoE3 (n=3); HFD ApoE3 (n=3); ND ApoE4 (n=3); HFD ApoE4 (n=3). Bar 10 µm. (f) Laser capture microdissection (LCM)-based expression microarrays of ChPs. Heatmaps show transcript levels in GO terms immune system process, transcription factor binding, cell junction, and ATP binding; (g) Genes that were down-regulated in ApoE-/- CPs and rescued either in ApoE3-KI and in ND or HFD ApoE4-KI mice. WT (n = 5 mice); ApoE-/- (n=4); ND ApoE3 (n=6); HFD ApoE3 (n=6); ND ApoE4 (n=6); HFD ApoE4 (n=6). Data in c,d are representative images from at least 3 biologically independent mouse samples. Data in a,e,g represent means ± SEM; two-tailed Student's t-test was applied to a,e,g. Gene names and statistics in Supplementary Tables 7.
Extended Figure 2
Extended Figure 2. Complement constituents in mouse ChPs
(a) ChPs were stained for C1q (red) and C4 (green). Bar 100 µm. (b) C5 siRNA treatment blocks C5 protein deposition in ApoE-/- ChPs; (c) ChPs were stained for C3. Ig represents lipid; (d) Serum C3 and C5. Serum C3 and C5 protein levels were measured by ELISA. ApoE-/-(n = 6 mice), HFD ApoE4 (n=5). (e) High resolution confocal microscopy shows colocalization of ApoE4 (ApoE, red) and Ig (green, represents lipid) in HFD ApoE4-KI ChPs. ApoE-/- ChPs serve as negative controls for ApoE staining; (f) Complement regulators are expressed in ChPs. WT (n = 5 mice); ApoE-/-(n=4); ND ApoE3 (n=6); HFD ApoE3 (n=6); ND ApoE4 (n=6); HFD ApoE4 (n=6). (g) ChP Factor H expressed between WT and ApoE-/- mice. WT (n=5); ApoE-/-(n=4); (h) ChP factor H protein in ChPs. White arrows indicate lipid positive areas. Data in a,b,c,e,h are representative images from at least 3 biologically independent mouse samples. Data in d,f,g represent means ± SEM; Two-tailed Student's t-test was applied to d,g; one-way ANOVA with Tukey posttest was applied to f; Gene names in Supplementary Table 3.
Extended Figure 3
Extended Figure 3. ApoE does not inhibit cleavage of C2 or C4 by C1s
(a) C1q binds immobilized malondialdehyde-modified LDL (MDA-LDL) and oxLDL but not native LDL or gelatin. (b) ApoE isoforms in NHS were added to MDA-LDL-coated microtiter plates and C4b deposition was determined by specific antisera. (c,d) IgM, MDA-LDL, and Aβ fibrils but not soluble Aβ activate complement and cause C3b deposition. BSA, gelatin as negative controls; (e, f) ApoE3 was incubated with either (e) C2 or (f) C4 in the presence of C1s. C2 and C4 were cleaved to their active forms C2a (α′30) and C4b (α′83) via C1s as revealed by the cleavage products in Western blot analyses; (g) ApoE3 has no cofactor activity for factor I in the cleavage of C4b to inactive iC4b. ApoE3 was incubated together with factor I, C4BP and C4b, and cleavage products were detected by Western blot analysis as indicated (α′25 and α′13). Full scanned blot images in e,f,g are available from source data figures. Data in a-d represent means ± SEM of three independent experiments. Two-tailed Student's t-test. Data in e,f,g are representative from 3 independent experiments.
Extended Figure 4
Extended Figure 4. ApoE binds to C1q but not to other complement components
(a) ApoE isoforms bind to the C1 complex, but not to C4 or C2. Biotinylated ApoE was immobilized on streptavidin-coated sensors and incubated with C1 complex, C4, C2, or buffer; (b) The C1 complex binds to immobilized ApoE isoforms. (c) ApoE isoforms bind to C1 and factor H, but not to C3 or C3b; (d) Normal human serum (NHS)-derived C1 binds to immobilized plasma-purified ApoE3 and to recombinant ApoE isoforms; (e) C1q binds to immobilized plasma-purified ApoE3 and to all recombinant ApoE isoforms; (f) Plasma-purified C1q was coated on a sensor chip (CM5) and plasma-derived ApoE (62-1000 nM) was injected into the fluid phase (75 mM NaCl, 5 mM HEPES, 1 mM CaCl2). (g) Mannose-binding lectin (MBL) does not bind to C1q as determined by biolayer interferometry; (h) Apolipoprotein A (ApoA) does not bind to C1q as determined by biolayer interferometry. (i) C1q-ApoE complexes revealed by proximity ligation assay (PLA) on cultured human apoptotic cells (THP-1) were detectable when treated with NHS but not with C1q-depleted serum (dNHS). Data represent mean fluorescence intensity (MFI) ± SEM of 16 cells for each group. Bar 10 µm. Data in b,c,d,e represent means ± SEM of at least three independent experiments. Data a,f,g and h represent means of at least two independent experiments. Two-tailed Student's t-test.
Extended Figure 5
Extended Figure 5. ApoE binds to the activated C1q; LDLR and C1sC1r tetramers do not compete with C1q-ApoE binding
(a) ApoE-C1q interaction is dependent on Ca2+. Real-time binding of ApoE to C1q was followed using biosensor analyses. Binding of ApoE to C1q is reduced in a dose-dependent manner upon increasing amounts of EGTA (0.1–3 mM); (b-c) co-immunoprecipitation of C1q-ApoE complexes; (b) anti C1q antiserum precipitate C1q-ApoE complexes composed of purified proteins with activated C1q, but not with inactive C1q from NHS. (c) Anti-ApoE antiserum precipitates C1q-ApoE complexes but no complexes from NHS. C1q-ApoE complexes were eluted with glycine buffer, then, C1q or ApoE proteins were separated by SDS-PAGE and immunoblotted using goat anti-C1q antiserum (left panel of b and c) or goat anti ApoE antiserum (right panel of b) separately. Full scanned blot images in b,c are available from source data figures. (d) ApoE peptide 139 – 152 but not ApoE peptide 30 – 40 competes with immobilized ApoE3 for binding to C1q in a dose-dependent manner; (e) C1q antibody binding to C1q is not affected by SDS. (f) C1q and LDLR bind simultaneously to ApoE. 20 nM C1q was incubated with increasing concentrations of LDLR to immobilized ApoE and binding of C1q and LDLR was followed by ELISA. Background binding of anti C1q and anti LDLR antisera to immobilized ApoE were set as 0%; (g) ApoE does not compete with C1sC1r tetramers for binding to C1q. C1q in addition to increasing amounts of C1sC1r tetramers was added to immobilized ApoE3 and C1q binding was determined. Data in d-g represent means ± SEM of at least three independent experiments. Two-tailed Student's t-test. Data in a,b,c are representatives of 3 independent experiments.
Extended Figure 6
Extended Figure 6. Complement constituents in mouse brain
(a-b) Human ChP sections were stained for C1q (green) / C3 (red) (a) and C1q (green) / ApoE (red) (b); (c-d) ChP sections were stained for CD68+ macrophages/DCs (c) and collagen IV (Col-IV) to mark basement membranes. Phase contrast shows lipid deposits in ChPs; (e) ChP sections were stained for ApoE (green) and factor H (red); no primary antibody as control (NA). (f-g) human brain sections were stained for Aβ (green) / ApoE (red) (left panels), Tau phosphorylation (pTau, green) / ApoE (red) (middle panels), and C1q (green) / ApoE (red) (right panels) (f). Blue for nuclei. No primary antibody as control (g); (h) brain parenchyma sections were stained for C3 (red) / ApoE (green). Bar 100 µm for a-h; Data in a-h are representative images from at least 3 biologically independent samples.
Extended Figure 7
Extended Figure 7. Complement constituents in mouse brain
(a)16 weeks APPPS1-21 mouse brain sections were stained with Aβ/ApoE complexes (red) by PLA, methoxy X04 for Aβ plaque (blue). High resolution confocal images show the spatial location of Aβ-ApoE complexes and Aβ plaque in 3D view (lower panel). Bars represent 10 µm. (b) Brain sections were stained with methoxy-X04, ApoE, and LAMP1; the size of areas covered by methoxy-X04, ApoE, and LAMP1 was determined. ApoE/X04 and LAMP1/X04 (X04 > 150 µm2) were quantified. n = 123 plaques from 4 control mice, 147 plaques from 5 treated mice. Bars 100 µm. (c) Aβ plaque was stained with methoxy X04 (X04). Number of plaques per section and number of plaque per area were quantified. control (n=4 mice), C5 (n=5). Bar 1000 µm; (d) Total plaque volume was determined in 3D, plaques were further grouped according to the plaque volume. n = 71 random fields from 4 control mice, 88 fields from 5 C5 treated mice. Bar 100 µm; (e) 8-week old C57BL6 brain cortex sections were examined for the presence of C1q-ApoE complexes with methoxy X04. ApoE, or C1q only antisera were used as negative controls. Bar represents 10 µm. Data in a,e are representative images from at least 3 biologically independent mouse samples. Data in b,c,d represent means ± SEM; two-tailed Student's t-test was applied to b,c,d; Two-way ANOVA was applied to c,d.
Extended Figure 8
Extended Figure 8. Complement and atherosclerosis
(a) Expression microarray analyses of aortas. Heatmaps show GO terms leukocyte migration, complement activation, phagocytosis, and cellular response to lipid. 6 weeks WT (n=3 mice); 32 weeks WT (n=3); 6 weeks ApoE-/- (n=3); 32 weeks ApoE-/- (n=3); (b) aorta alternative complement pathway genes (factor B, factor H, factor D) mRNA expression in 6 weeks and 32 weeks old WT and ApoE-/- mouse aortas. 6 weeks WT (n=3 mice); 32 weeks WT (n=3); 6 weeks ApoE-/- (n=3); 32 weeks ApoE-/- (n=3); (c-d) plasma cholesterol and body weight; (e-f) blood leukocytes and percentage. For c-f, control (11 mice); C5 siRNA (12 mice). (g) blood CD4+ T cells, CD8+ T cells, and B220+ B cells by flow cytometry. Control (6 mice); C5 siRNA (6 mice). (h) super-resolution microscopy shows colocalization of C1q (green) and ApoE (red) in human atherosclerotic plaque. Representative images from at least 3 biologically independent mouse samples. Bar 5 µm. Data in b,c,d,e,f,g represent means ± SEM; Two-tailed Student's t-test was applied to c.d.e.f.g; one-way ANOVA with Tukey posttest was applied to b; abbreviations: WBC, white blood cells; RBC, red blood cells; PLT, platelets; LYM, lymphocytes; MO, monocytes; GRA, granulocytes. Gene names and statistics in supplementary Table 8.
Extended Figure 9
Extended Figure 9. Graphical presentation of the body of in vivo data
(a) Pleiotropic impacts of single ApoE or single C1q molecules in brain as reported by others. Microglia cells are the major source of brain C1q. In response to Aβ plaques, resting microglia cells differentiate into plaque-associated microglia cells. Single actions of ApoE and C1q have been reported to be involved in multiple pathways as indicated in the Figure. Inactive C1q (yellow), activated C1q (red). (b) Graphical presentation of the body of in vivo data. Three types of unresolvable inflammatory conditions were studied in 7 mouse models and in translational studies of human tissues, i.e. choroid plexus, aorta, and brain parenchyma.
Figure 1
Figure 1. ChP lipid, inflammation, and interferon (IFN) signatures.
(a-b) ChP sections were stained with oil red o (ORO) for lipid (red) and hematoxylin (HE) for nuclei (blue) (a). Bar 100 μm; Representative images from b. ChPs and associated parenchyma per tissue area was quantified as described in Methods (b). WT (n=3 mice); ApoE-/- (n=9); ND ApoE3 (n=6); HFD ApoE3 (n=6); ND ApoE4 (n=6); HFD ApoE4 (n=9); (c) plasma cholesterol. WT (n=6); ApoE-/- (n=6); ApoE3 (n=14); ApoE3 HFD (n=17); ApoE4 (n=8); ApoE4 HFD (n=10) mice. (d) Epithelial cells were stained for cytokeratin (Keratin, red); leukocytes (CD45, green); and nuclei by DAPI (blue). Phase contrast delineates the ChP. Dashed line indicates the border of ChP and the ventricle. Bar 100 μm; (e) CD68+ areas were quantified as described in Methods. 12 sections from 4 WT; 12 sections from 4 ApoE-/- mice. (f) ChPs were stained for lipid by BODIPY (BO, green), endothelial cells (CD31, cyan), and macrophages (Iba-1, red) (left panel); TEM shows a single ChP macrophage-foam cell (middle panel); and lipid (BO, green) and immunoglobulin (Ig, red) (right panel). Bars 10 μm; (g) IFN-related genes in ChPs by microarray. Heat maps show two-group comparisons of ChPs. The percentages of up- or down-regulated genes were showed in the circle. The percentages of IFN-related gene in up- or down-regulated were marked as red. (h) ApoE4 isoform-dependent IFN signature expression in ChPs. WT (n=5 mice); ApoE-/- (n=4); ND ApoE3 (n=6); HFD ApoE3 (n=6); ND ApoE4 (n=6); HFD ApoE4 (n=6). Data in d,f are representative images from at least 3 biologically independent mouse samples. Data in b,c,e,h represent means ± SEM; Two-tailed Student´s t-test was applied to b,c,e; one-way ANOVA with Tukey’s test was applied to h; Abbreviations, ChP, choroid plexus; V, ventricle; Ep, epithelial cells; Nu, nucleus; Va, vacuole; TJ, tight junction; Gene names and statistics in supplementary Tabls.2-3.
Figure 2
Figure 2. Complement affects ChP inflammation.
(a) ChPs were stained for complement C3 (red), anaphylatoxin C3a (cyan), and Ig (green). Bar 100 μm. (b) Complement C5. ChPs were stained for complement C5 (red). Bar 10 μm. (c) Liver-targeted C5-siRNA reduces serum C5. Control (n = 9 mice), C5 (n=9). (d-f) C5-siRNA attenuates leukocyte infiltration (d), CD68+ macrophage/DC infiltration (e), and CD3+ T cell infiltration (f) in ApoE-/- ChPs. Bars 10 μm. Control (n = 6 mice), C5 (6). (g) Low C4 and C3 protein levels in lipid deposits of HFD ApoE4 ChPs. Serial sections of ChPs as shown in Fig.1a were stained for C4 (green) and C3 (red). (h) Super-resolution (STED) microscopy shows colocalization of C1q (green) and ApoE (red) in HFD ApoE4 ChPs. Bar 10 μm. (i) ChP complement mRNA expression. WT (n=4 mice); ApoE-/- (n=5); ND ApoE3 (n=6); HFD ApoE3 (n=6); ND ApoE4 (n=6); HFD ApoE4 (n=6). Data in a,b,g,h are representative images from at least 3 independent mouse samples. Data represent means± SEM; Two-tailed Student´s t-test was applied to c,d,e,f. ***P<0.0001; one-way ANOVA with Tukey’s test was applied to i. Gene names in supplementary Tabl.3.
Figure 3
Figure 3. ApoE inhibits CCC initiation by high-affinity binding to C1q.
(a) ApoE inhibits CCC activation but not the alternative pathway. ApoE isoforms ApoE2, ApoE3, or ApoE4 were incubated in normal human serum (NHS), which was activated either via CCC buffer (left) (1% in GVB++) or alternative pathway buffer (right) (20% in MgEGTA); and lysis of sheep or rabbit erythrocytes by TCC was followed by measuring released haemoglobin at 415 nm. (b) ApoE was incubated with NHS in GVB++ buffer or Mg-EGTA buffer or with C1q-deficient serum in GVB++ to activate different complement pathways. Survival of E. coli was analyzed counting colony forming units. Survival of E. coli in normal serum was set as 10%. (c) ApoE isoforms inhibit the CCC at the level of TCC and C4b. ApoE isoforms in NHS were added to IgM-coated microtiter plates and TCC or C4b deposition was determined by specific antibodies, respectively. (d) Binding of C1, C1q, C1s, and C1r to ApoE isoforms was determined by biolayer interferometry as described in Methods. (e) The binding affinities of ApoE isoforms and C1s to C1q were determined by biolayer interferometry. ApoE proteins and C1s were biotinylated, immobilized on streptavidin-coated sensors, and C1q binding was determined by measuring changes of optical thickness on the sensor. (f) The ApoE-C1q interaction is dependent on Ca2+. Data represent means ± SEM of three independent experiments. Two-tailed Student´s t-test. BSA, bovine serum albumin; TCC, terminal complement complex; EfB, microbial inhibitor of the alternative pathway. Vnt: vitronectin. GVB: gelatin veronal buffer.
Figure 4
Figure 4. ApoE or ApoE139–152 binds to the C1q stalk.
(a) Four peptides are depicted in a 3D model of human ApoE3 (PDB ID code: 2L7B) and their corresponding amino acid sequences. (b) ApoE4 inhibition was blocked by ApoE peptide P139–152 but not by ApoE peptides P30–40, P74-85, P210–232. (c) Binding of ApoE isoforms and corresponding ApoE peptides to C1q were determined by ELISA. (d) Binding affinity of P139-152 to C1q was determined by MicroScale initial fluorescence analysis. (e) Binding of ApoE3 to C1q and LDLR in the presence of SDS or NaCl was determined by ELISA. (f) ApoE binds to the stalk of C1q. C1q alone or incubated with biotinylated plasma-purified ApoE3 or biotinylated ApoE peptide P139-152 and streptavidin-coated gold particles were visualized by electron microscopy. Representative image from 3 independent experiments. Gold-streptavidin/biotin-ApoE and recombinant directly gold-labeled ApoE showed similar results. Bar 20 nm. Data represent means ± SEM of three independent experiments. Two-tailed Student´s t-test.
Figure 5
Figure 5. ChP C1q-ApoE complexes correlate with cognitive decline in Alzheimer's disease (AD).
(a) Human ChP sections were stained with ORO/HE. Bar 100 μm. ChPs lipid was quantified as described in Methods. Non-dementia cases (n=13) and demented cases (n=17). (b) Pearson correlation of ChP lipid and neurofibrillary tangle stage (Braak & Braak). n=30. (c-e) ChP lipid correlate with Aβ score (Thal phase), neuritic plaque score (CERAD), and ApoE4 genotype. n = 30 biologically independent samples, (f) ChP lipid correlates with dementia in ApoE3/ApoE3 carriers. ApoE3/ApoE3 Non-dementia cases (n=10) and demented cases (n=7). (g) Human ChP sections were stained for C1q (green) and C5 (red). Bar 100 μm. C5 percentage of lipid- ChP and lipid+ ChP from the same case was quantified according the Methods. Lipid- (n=7 biologically independent samples), lipid+ (n=7). (h) STED microscopy shows colocalization of C1q (green) and ApoE (red). Bar 5 μm. (i) Binding of C1q-ApoE in vivo by PLA. Anti-ApoE, anti-C1q, or no primary antibodies were used as controls. The number of C1q-ApoE complexes of lipid-negative ChP or lipid-positive areas were quantified as described in Methods. Lipid- (n=4 independent samples), lipid+ (n=4). Bar 5 μm. (j) Human brain sections were stained for Aβ/ApoE, pTau/ApoE, C1q/ApoE, or C1q alone. Protein-protein binding in vivo was detected by PLA. Blue for nuclei. Bar 5 μm. (k) 16 weeks AD (APPPS1-21) brain cortex sections were examined by the PLA assay for the presence of C1q/ApoE complexes, methoxy X04 to outline plaques. X04-(5), X04+ (5). Bars represent 10 μm. (l) Liver-targeted C5 siRNA reduces serum C5 in APPPS1-21 mice. Ctr (n=4 mice), C5 (n=5). (m) Brain sections were stained with iba1 for microglial cells (red), To-Pro-3 for nuclei, and X04 for Aβ plaque. White dashed circle represents the area within a 30 μm radius. The number of iba1+/To-Pro-3+ cells per areawere quantified (> 30 μm radius represents non-Aβ plaque area). Plaques were further grouped into small plaques (X04% < 10% of 30 μm radius area), moderate plaques (X04% between 10 - 30% 30 μm radius area), and large plaques (X04% > 30% of 30 μm radius area). Percentage of iba1 positivity within a 30 μm radius of Aβ plaques and non-Aβ plaque areas were compared. 420 individual Aβ plaques and 40 fields of non-Aβ plaques from 4 control mice, 536 individual Aβ plaques and 51 fields of non-Aβ plaques from 5 C5 treated mice. Data in h,j are representative images from at least 3 independent samples. Data represent means ± SEM. Two-tailed Student´s t-test was applied to a,c,d,f; paired two-tailed Student´s t-test was applied to g,I,k; One-way ANOVA was applied to e; Two-way ANOVA was applied to l,m.
Figure 6
Figure 6. C1q-ApoE complexes are indicative of CCC activity in atherosclerosis.
(a) Aorta complement gene mRNA expression. 6 weeks WT (n=3 mice); 32 weeks WT (n=3); 6 weeks ApoE-/- (n=3); 32 weeks ApoE-/- (n=3); (b) Liver-targeted C5 siRNA reduces serum C5 in young ApoE-/- mice. Ctr (n=11 mice), C5 (12). (c) En face staining for whole aorta. Bar 0.5 cm. Atherosclerotic plaques were quantified as described in Methods. Control (n=11 mice), C5 siRNA (n=12). (d,e) Aortic root sections were stained for ORO/HE and CD68+ macrophages/DCs. Bars 100 μm. Plaque size (d) and CD68+ macrophages/DCs size (e) were quantified as described in Methods. Control (n=4 mice), C5-siRNA (n=4). (f) Human carotid artery parallel sections were stained for CD68, C1q, ApoE, and C5 by DAB and hematoxylin. Representative images from g. (g) CD68, C1q, ApoE, and C5 signal was quantify as described in Methods. Control (n=5 independent samples), early plaque (n=6), advanced plaque (n=9). (h) C1q-ApoE complexes in human atherosclerosis plaque was determined by PLA. Intima (n=3 independent samples), media (3). Bar 5 μm. (i) High resolution microscopy shows colocalization of lipid (green) and malondialdehyde epitopes (MDA2, red) in human atherosclerotic plaque. Bar 10 μm. Representative images from at least 3 independent samples. (j) Schematic representation of the C1q-ApoE complex. Locally produced and/or serum-recruited C1q is activated in situ by a variety of surface activators including oxidized lipid, oxidized LDL, amyloid fibrils, and immunoglobulins. C1q activators have been implicated in diseases as varied as atherosclerosis and AD. Following activation, C1q acquires an active conformation that allows initiation of the CCC with resultant generation of C3a and C3b and C5 cleavage to generate C5a and C5b. ApoE inhibits the CCC activity by binding of ApoE at high affinity to the active C1q and forms the C1q-ApoE complex (upper part of the panel). By contrast, inflammation is amplified in the absence of ApoE by overactivation of the CCC (lower panel). C1q: inactive (yellow); activated (light green); overactivated (red). Data represent means ± SEM. Two-tailed Student´s t-test was applied to b,c,h; One-way ANOVA was applied to a,g; Two-way ANOVA was applied to d,e.

Comment in

References

    1. Bell RD, et al. Apolipoprotein E controls cerebrovascular integrity via cyclophilin A. Nature. 2012;485:512–516. - PMC - PubMed
    1. Holtzman DM, Herz J, Bu G. Apolipoprotein E and apolipoprotein E receptors: normal biology and roles in Alzheimer disease. Cold Spring Harb Perspect Med. 2012;2 a006312. - PMC - PubMed
    1. Kanekiyo T, Xu H, Bu G. ApoE and Aβ in Alzheimer’s disease: accidental encounters or partners? Neuron. 2014;81:740–754. - PMC - PubMed
    1. Linton MF, Atkinson JB, Fazio S. Prevention of atherosclerosis in apolipoprotein E-deficient mice by bone marrow transplantation. Science. 1995;267:1034–1037. - PubMed
    1. Mahley RW, Weisgraber KH, Huang Y. Apolipoprotein E: structure determines function, from atherosclerosis to Alzheimer's disease to AIDS. J Lipid Res. 2009;50(Suppl):S183–188. - PMC - PubMed

Publication types

MeSH terms