. 2019 Jan 14:9:692.
doi: 10.3389/fgene.2018.00692. eCollection 2018.

Opportunities to Improve Resilience in Animal Breeding Programs

Affiliations

Opportunities to Improve Resilience in Animal Breeding Programs

Tom V L Berghof et al. Front Genet. .

Abstract

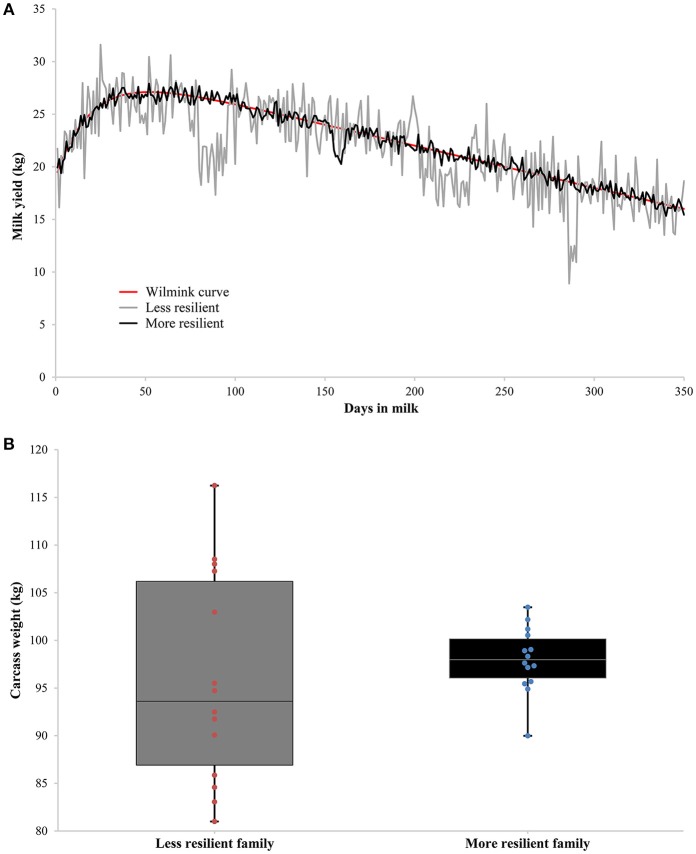
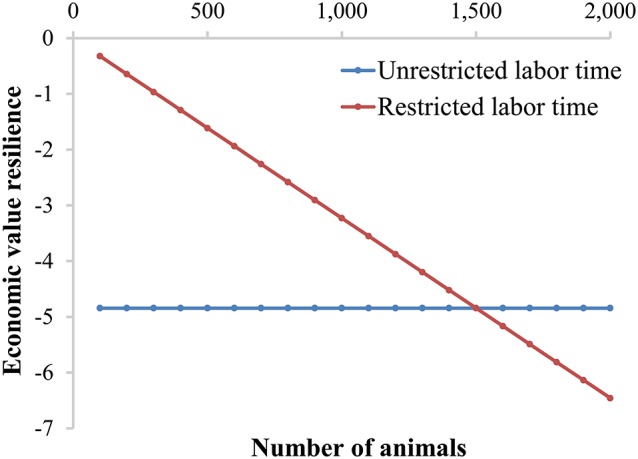
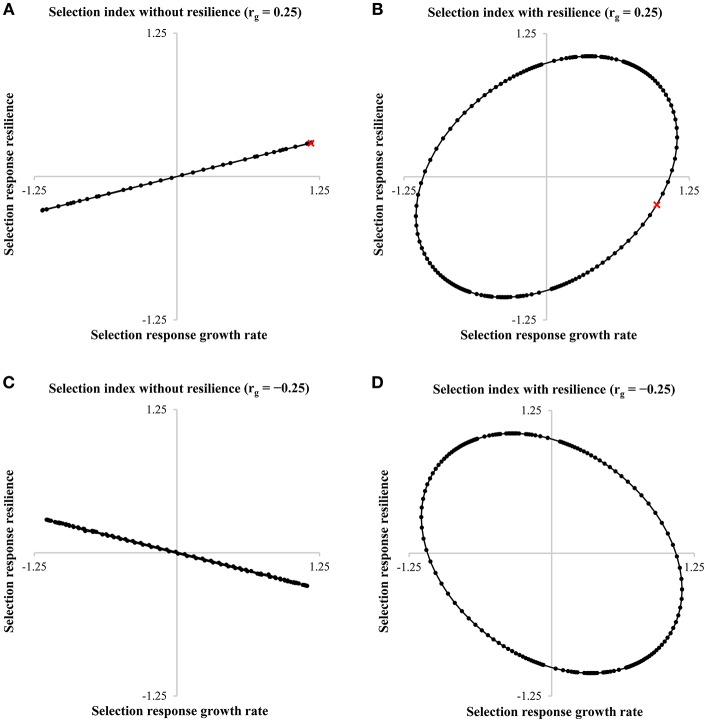
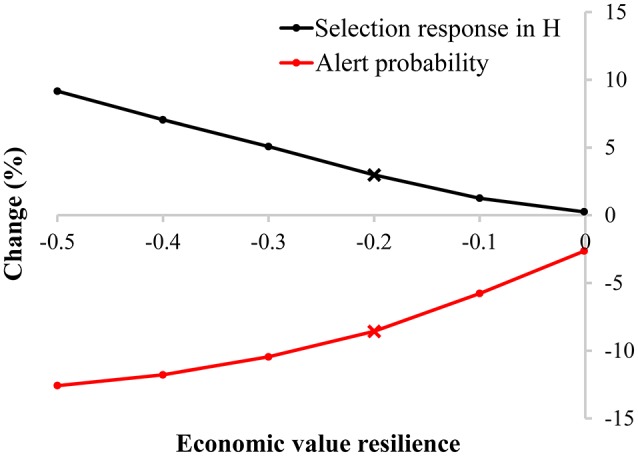
Resilience is the capacity of an animal to be minimally affected by disturbances or to rapidly return to the state pertained before exposure to a disturbance. However, indicators for general resilience to environmental disturbances have not yet been defined, and perhaps therefore resilience is not yet included in breeding goals. The current developments on big data collection give opportunities to determine new resilience indicators based on longitudinal data, which can aid to incorporate resilience in animal breeding goals. The objectives of this paper were: (1) to define resilience indicator traits based on big data, (2) to define economic values for resilience, and (3) to show the potential to improve resilience of livestock through inclusion of resilience in breeding goals. Resilience might be measured based on deviations from expected production levels over a period of time. Suitable resilience indicators could be the variance of deviations, the autocorrelation of deviations, the skewness of deviations, and the slope of a reaction norm. These (new) resilience indicators provide opportunity to include resilience in breeding programs. Economic values of resilience indicators in the selection index can be calculated based on reduced costs due to labor and treatments. For example, when labor time is restricted, the economic value of resilience increases with an increasing number of animals per farm, and can become as large as the economic value of production. This shows the importance of including resilience in breeding goals. Two scenarios were described to show the additional benefit of including resilience in breeding programs. These examples showed that it is hard to improve resilience with only production traits in the selection index, but that it is possible to greatly improve resilience by including resilience indicators in the selection index. However, when health-related traits are already present in the selection index, the effect is smaller. Nevertheless, inclusion of resilience indicators in the selection index increases the response in the breeding goal and resilience, which results in less labor-demanding, and thus easier-to-manage livestock. Current developments on massive collection of data, and new phenotypes based on these data, offer exciting opportunities to breed for improved resilience of livestock.

Keywords: big data; breeding program; economic value; livestock; longitudinal data; macro-environment; micro-environment; resilience.


Figures

Figure 1
Figure 1
Two examples of production traits suitable for investigating resilience indicators based on deviations. (A) Shows repeated measurements of milk yield on individual level of two dairy cows with the same underlying Wilmink curve (in red), but differing in resilience: in gray a less resilient dairy cow with higher fluctuations in milk yield, and in black a more resilient dairy cow with lower fluctuations in milk yield. (B) Shows measurements of carcass weight on family level of two families differing in resilience: in gray a less resilient family with higher fluctuations in carcass weight, and in black a more resilient family with lower fluctuations in carcass weight.
Figure 2
Figure 2
The heritability of residual variance (hresidual variance2=nhindividual record21+(n-1)rrecords) as a function of the number of observations per animal (n) for two heritabilities of the residual variance based on one individual record (hindividual record2) and two repeatabilities of records of the residual variance (rindividual record). The used heritabilities of the residual variance based on one individual record (hindividual record2) are similar to in-literature-reported heritabilities of residual variance based on one individual record (i.e., one single phenotypic observation), see Hill and Mulder (2010) and Elgersma et al. (2018) for examples.
Figure 3
Figure 3
The normal distribution of the probability that an animal generates an alert with an individual-specific mean and variance based on a trait reaching a certain threshold. In this figure the individual specific variance of the “more resilient animal” is smaller than the individual specific variance of the “average animal.” Therefore, the “more resilient animal” has a lower probability to generate an alert than the “average animal”.
Figure 4
Figure 4
Economic value for resilience based on available labor time, either unrestricted or restricted, for day-to-day animal care taking. Assumptions made are: 8 labor h/day, 15 currency units/h labor costs, 10 currency unit profit per animal (i.e., the economic value of growth), a 1% alert probability (i.e., x = −2.33), 5 min attention time per alert (la), and 125 days (d) to grow from 25 kg to 125 kg (i.e., average daily gain is 800 g/day).
Figure 5
Figure 5
Selection responses for growth rate and resilience with the economic value of growth rate set to 1 and −1, and the economic value of resilience varying between −1,000 and 1,000 in a pig breeding program. The figure shows the response ellipses of growth rate and resilience for the selection index without resilience (A,C) or with resilience (B,D) with a genetic correlation of 0.25 (A,B) or a genetic correlation of −0.25 (C,D). The red crosses in A,B are discussed in the text.
Figure 6
Figure 6
Change (in %) in selection response in the breeding goal (H) and the probability an animal generates an alert in a default selection index without and with inclusion of a resilience indicator for various economic values in a dairy cattle breeding program. The default selection index contains milk yield, longevity, and udder health. The crosses are discussed in the text and shown in detail in Table 2.

References

    1. Bishop S. C. (2012). A consideration of resistance and tolerance for ruminant nematode infections. Front. Genet. 3:168. 10.3389/fgene.2012.00168 - DOI - PMC - PubMed
    1. Bohmanova J., Misztal I., Cole J. B. (2007). Temperature-humidity indices as indicators of milk production losses due to heat stress. J. Dairy Sci. 90, 1947–1956. 10.3168/jds.2006-513 - DOI - PubMed
    1. Carabaño M. J., Ramón M., Díaz C., Molina A., Pérez-Guzmán M. D., Serradilla J. M. (2017). BREEDING AND GENETICS SYMPOSIUM: Breeding for resilience to heat stress effects in dairy ruminants. A comprehensive review. J. Anim. Sci. 95, 1813–1826. 10.2527/jas2016.1114 - DOI - PubMed
    1. Codrea M. C., Højsgaard S., Friggens N. C. (2011). Differential smoothing of time-series measurements to identify disturbances in performance and quantify animal response characteristics: an example using milk yield profiles in dairy cows. J. Anim. Sci. 89, 3089–3098. 10.2527/jas.2010-3753 - DOI - PubMed
    1. Colditz I. G., Hine B. C. (2016). Resilience in farm animals: biology, management, breeding and implications for animal welfare. Anim. Prod. Sci. 56, 1961–1983. 10.1071/AN15297 - DOI

LinkOut - more resources