. 2019 Aug;56(8):5950-5969.
doi: 10.1007/s12035-019-1493-6. Epub 2019 Jan 28.

ROS-Induced Activation of DNA Damage Responses Drives Senescence-Like State in Postmitotic Cochlear Cells: Implication for Hearing Preservation

Affiliations

ROS-Induced Activation of DNA Damage Responses Drives Senescence-Like State in Postmitotic Cochlear Cells: Implication for Hearing Preservation

Nesrine Benkafadar et al. Mol Neurobiol. 2019 Aug.

Abstract

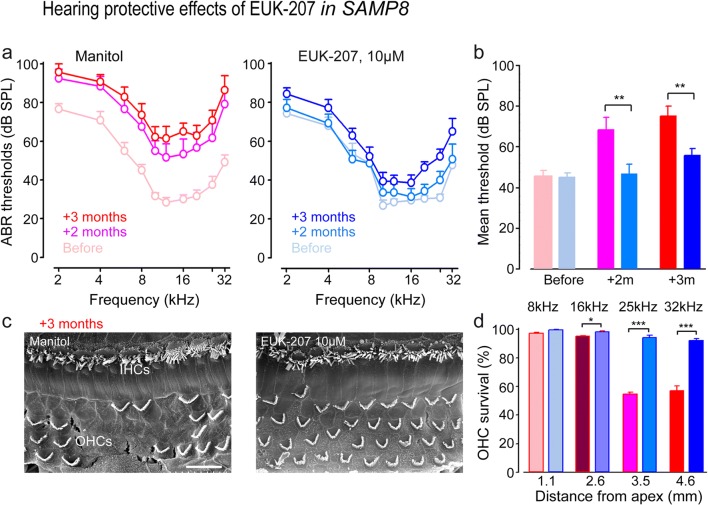
In our aging society, age-related hearing loss (ARHL) has become a major socioeconomic issue. Reactive oxygen species (ROS) may be one of the main causal factors of age-related cochlear cell degeneration. We examined whether ROS-induced DNA damage response drives cochlear cell senescence and contributes to ARHL from the cellular up to the system level. Our results revealed that sublethal concentrations of hydrogen peroxide (H2O2) exposure initiated a DNA damage response illustrated by increased γH2AX and 53BP1 expression and foci formation mainly in sensory hair cells, together with increased levels of p-Chk2 and p53. Interestingly, postmitotic cochlear cells exposed to H2O2 displayed key hallmarks of senescent cells, including dramatically increased levels of p21, p38, and p-p38 expression, concomitant with decreased p19 and BubR1 expression and positive senescence-associated β-galactosidase labeling. Importantly, the synthetic superoxide dismutase/catalase mimetic EUK-207 attenuated H2O2-induced DNA damage and senescence phenotypes in cochlear cells in vitro. Furthermore, systemic administration of EUK-207 reduced age-related loss of hearing and hair cell degeneration in senescence-accelerated mouse-prone 8 (SAMP8) mice. Altogether, these findings highlight that ROS-induced DNA damage responses drive cochlear cell senescence and contribute to accelerated ARHL. EUK-207 and likely other antioxidants with similar mechanisms of action could potentially postpone cochlear aging and prevent ARHL in humans.

Keywords: Age-related hearing loss; DNA damage responses; Hearing preservation; Oxidative stress; Senescence.


Conflict of interest statement

The authors declare that they have no conflicts of interest.

Figures

Fig. 1
Fig. 1
Hydrogen peroxide induces apoptosis of the cochlear outer hair cells in a dose and time dependent manner. ad Confocal images showing the basal regions of cochlear explants treated with either culture medium alone (a) or medium containing 0.5 mM (b), 0.75 mM (c), or 1 mM (d) H2O2 for 5 h before being maintained in culture medium alone for 5 days. The explants were immunostained with myosin 7A (red) to identify hair cells and with neurofilament 200 (NF200, green) to visualize auditory nerve fibers. Scale bar = 20 μm. nf, auditory nerve fibers; OHCs, outer hair cells; IHCs, inner hair cells. e Dose–response curves of H2O2-induced loss of OHCs (blue line) and IHCs (red line) in basal cochlear regions. Data are expressed as mean ± SEM (n = 6 cochleae per condition). One-way ANOVA test followed by post hoc Tukey’s test (**P ≤ 0.01; ***P ≤ 0.001 vs. H2O2 0 mM). f Effect over time on OHCs and IHCs of treatment with 0.75 mM H2O2 (blue and red lines for OHCs and IHCs, respectively) compared with culture medium alone (light blue and red lines for OHCs and IHCs, respectively). Data are expressed as mean ± SEM (n = 6 cochleae per condition and per time point). One-way ANOVA test was followed by post hoc Tukey’s test (***P ≤ 0.001 vs. H2O2 0 mM). gj Confocal images showing the basal region of cochlear explants treated with either culture medium alone (g) or containing 0.5 mM (h), 0.75 mM (i), or 1 mM (j) H2O2 for 5 h before their maintenance in culture medium alone for 3 days. Hair cells were identified using myosin 7A (red) and auditory nerve fibers with neurofilament 200 (NF200 blue). DNA fragmentation was identified using a TUNEL apoptosis kit (green). Scale bar = 35 μm. k Representative Western blot analysis using antibodies against cleaved caspase 3 (c-Casp3), Bax, BCL-2, and β-actin in whole cochlear extracts. l Histogram representing the fold change in cleaved caspase 3 and Bax expression levels in control and 0.4, 0.5, and 0.75 mM H2O2-exposed groups (n = 6 cochleae per condition). β-Actin served as a loading control. Data are expressed as mean ± SEM. One-way ANOVA test was followed by post hoc Tukey’s test (**P < 0.01, ***P < 0.001 vs. H2O2 0 mM). All experiments were performed in triplicate
Fig. 2
Fig. 2
Increased oxidative stress and upregulation of autophagy. ac Quantification analysis of superoxide dismutase (SOD) (a), catalase (Cat) (b), and malondialdehyde (MDA) (c) activities using spectrofluorochemistry in whole cochlear extracts from cochlea treated with culture medium alone (blue bars) or containing 0.4 mM (pale red bars) or 0.5 mM (pink bars) H2O2 for 5 h. The cochleae were collected from the different conditions after 3 days of culture. All the data are expressed as mean ± SEM (n = 16 cochleae per condition). One-way ANOVA test was followed by post hoc Tukey’s test (*P ≤ 0.04, ***P ≤ 0.001 vs. H2O2 0 mM). d Representative Western blot analysis using antibodies against SOD2, Cat, p66Shc, p-p66Shc, and β-actin in whole cochlear extracts. e, f Histogram representing the levels of SOD2, Cat, p66Shc, and p-p66Shc in control and 0.4 and 0.5 mM H2O2-exposed groups (n = 6 cochleae per condition). β-Actin served as a loading control. Data are expressed as mean ± SEM. One-way ANOVA test followed by post hoc Tukey’s test (*P ≤ 0.04, **P ≤ 0.01, ***P ≤ 0.001 vs. H2O2 0 mM). g Representative Western blot analysis using antibodies against p-Beclin1, LC3-II, Rab7, p62, and β-actin in whole cochlear extracts. h Histograms representing the levels of p-Beclin1, LC3-II, Rab7, and p62 in control and 0.4 and 0.5 mM H2O2-exposed groups (n = 6 cochleae per condition). β-Actin served as a loading control. Data are expressed as mean ± SEM. One-way ANOVA test followed by post hoc Tukey’s test (*P ≤ 0.04, **P ≤ 0.01, ***P ≤ 0.001 vs. H2O2 0 mM). All experiments were performed in triplicate
Fig. 3
Fig. 3
DNA damage and DNA damage responses upon H2O2 challenge. a, c, e, g Confocal images showing the basal region of the organ of Corti cultures treated with either culture medium alone (a, e) or containing 0.5 mM H2O2 (c, g) for 5 h before being maintained in culture medium alone for 3 days. The samples were then immunolabeled for myosin 7A (red, a, c, e, g), γH2AX (green, a and c) and 53BP1 (green, e and g). Scale bars: a, c, e and g = 10 μm. b, d, f, h Higher magnification images of representative OHC and IHC nuclei from all conditions tested. Scale bar = 2.5 μm. i Representative Western blot analysis using antibodies against γH2AX, 53BP1, DDB2, p-Chk1, p-Chk2, p53, and β-actin in whole cochlear extracts. j, k Histograms representing the levels of γH2AX, 53BP1, DDB2, p-Chk1, p-Chk2, and p53 in control and in 0.4 and 0.5 mM H2O2-exposed groups (n = 6 cochleae per condition). β-Actin served as a loading control. Data are expressed as mean ± SEM. One-way ANOVA test followed by post hoc Tukey’s test (*P ≤ 0.04, **P ≤ 0.01, ***P ≤ 0.001 vs. H2O2 0 mM). All experiments were performed in triplicate
Fig. 4
Fig. 4
Senescence-like phenotype upon H2O2 treatment. a Representative Western blot analysis using antibodies against p21, p38, p-p38, p16, p19, BubR1, and β-actin in whole cochlear extracts. b, c Histograms representing the levels of p21, p38, p-p38, p16, p19, and BubR1 in 0 (control), 0.4, and 0.5 mM H2O2-exposed groups (n = 6 cochleae per condition). β-Actin served as a loading control. Data are expressed as mean ± SEM. One-way ANOVA test followed by post hoc Tukey’s test (*P ≤ 0.05, **P ≤ 0.01, ***P ≤ 0.001 vs. H2O2 0 mM). d Light microscope images showing the basal region of the organ of Corti cultures treated with either culture medium alone or containing 0.5 mM H2O2 for 5 h before their maintenance in culture medium alone for 3 days. The samples were then stained with fresh β-galactosidase (SA-β-gal) solution at pH 6.0. Note that H2O2 exposure resulted in an increased activity of SA-β-gal (blue) in OHCs and supporting cells located in the area of the organ of Corti as well as in the cells located in the region of the spiral ganglion (SG). Scale bar = 25 μm. All experiments were performed in triplicate
Fig. 5
Fig. 5
EUK-207 upregulates antioxidant response elements and suppresses DNA damage and senescence phenotype. a Representative Western blot analysis using antibodies against FOXO3a, Nrf2, γH2AX, p19, p21, and β-actin in whole cochlear extracts. bf Histograms representing the levels of FOXO3a, Nrf2, γH2AX, p19, and p21 in control (Ctrl), 10 μM EUK-207 alone, and 0.5 mM H2O2 alone or in combination with 10 μM EUK-207 exposed groups (n = 6 cochleae per condition). β-Actin served as a loading control. Data are expressed as mean ± SEM. One-way ANOVA test followed by post hoc Tukey’s test (*P ≤ 0.04, **P ≤ 0.01, ***P ≤ 0.001 vs. Ctrl; #P ≤ 0.025, ##P ≤ 0.01, ###P ≤ 0.001 vs. H2O2 0.5 mM). gi Confocal images showing the basal region of organ of Corti cultures treated with either culture medium alone (control, g) or with medium containing 0.5 mM H2O2 (h) or 0.5 mM H2O2 in combination with 10 μM EUK-207 (i) for 3 days. The samples were then immunolabeled for myosin 7A (red) and γH2AX (green). Scale bar = 15 μm. All experiments were performed in triplicate
Fig. 6
Fig. 6
Increased oxidative stress, upregulation of autophagy, and activation of DDR in adult SAMP8. a, d, f Representative Western blot analysis using antibodies against Nrf2, SOD2, p66Shc, p-p66Shc, p-Beclin1, Rab7 p62, p-Chk2, p53, p-p53, and β-actin in whole cochlear extracts. b, c Histograms representing the levels of Nrf2, SOD2, p66Shc, and p-p66Shc in SAMR1 and SAMP8 mice aged 1, 6, and 12 months (n = 16 cochleae per strain and per age) (*P ≤ 0.05, **P = 0.01, ***P ≤ 0.001 vs. 1 month age; #P ≤ 0.042, ##P ≤ 0.01, ###P ≤ 0.001 vs. SAMR1 of the same age). e Histograms representing the levels of p-Beclin1, Rab7, and p62 in SAMR1 and SAMP8 mice aged 1, 6, and 12 months (n = 16 cochleae per strain and per age) (*P = 0.024, **P ≤ 0.01, ***P ≤ 0.001 vs. 1 month age; #P = 0.022, ##P = 0.0036, ###P ≤ 0.001 vs. SAMR1 of the same age). g Histograms representing the levels of p-Chk2, p53, and p-p53 in SAMR1 and SAMP8 mice aged 1, 6, and 12 months (n = 16 cochleae per strain and per age) (*P ≤ 0.043, **P ≤ 0.01, ***P ≤ 0.001 vs. 1 month age; #P ≤ 0.025, ##P ≤ 0.01, ###P ≤ 0.001 vs. SAMR1 of the same age). β-Actin served as a loading control. Data are expressed as mean ± SEM. One-way ANOVA test followed by post hoc Tukey’s test. All experiments were performed in triplicate
Fig. 7
Fig. 7
Senescence-like phenotype in adult SAMP8. a Representative Western blot analysis using antibodies against p21, p16, BubR1, p19, and β-actin in whole cochlear extracts. b, c Histograms representing the levels of p21, p16, BubR1, p19, and β-actin in SAMR1 and SAMP8 mice aged 1, 6, and 12 months (n = 16 cochleae per strain and per age). β-Actin served as a loading control. Data are expressed as mean ± SEM. One-way ANOVA test was followed by post hoc Tukey’s test (*P ≤ 0.035, **P = 0.01, ***P = 0.001 vs. 1 month age; #P ≤ 0.041, ##P ≤ 0.01, ###P ≤ 0.001 vs. SAMR1 of the same age). All experiments were performed in triplicate. d, e Representative scanned images of cochlear surface preparations from the middle turn of the cochleae of SAMR1 (d) and SAMP8 (e) mice at 6 months. The samples were stained with fresh SA-β-gal solution at pH 6.0. Scale bar = 50 μm. fi Higher magnification images of representative organ of Corti (f, h) and spiral ganglion (g, i) derived from d and e. Scale bars = 20 μm. jo Representative scanned images of transverse cryostat sections of the organ of Corti (j, m), spiral ganglion (k, n), and stria vascularis (l, o) from SAMR1 (jl) and SAMP8 (mo) mice at 6 months. Scale bars: j, k, m, n = 10 μm; l, o = 25 μm. Note that SA-β-gal (blue)-stained cells are mostly present in the region of spiral ganglion neurons, OHCs, and IHCs of SAMP8 mice (asterisks in h, i, m, n). SG, spiral ganglion; DCs, Deiters cells; PCs, pillar cells; sv, stria vascularis; sl, spiral ligament
Fig. 8
Fig. 8
Correlation between molecular events and the hearing loss. a, b Age-related ABR thresholds in SAMR1 (blue plot) (a) and in SAMP8 mice (red plot) (b) at 1, 3, 6, and 12 months (n = 14 animals per age and per strain). Data are expressed as mean ± SEM. Note the severe elevation in threshold in the SAMP8 mice. c The mean ABR threshold from 2 to 32 kHz derived from a and b. The mean ABR thresholds for each mouse and each time point were calculated for both strains. These values were then used to perform a linear regression allowing the measurement of threshold elevation per month and the calculus of Pearson correlation coefficient. df Time course of hearing loss relating to protein changes in the SAMP8 mice. The X-axis represents the mean difference (Δ) in ABR thresholds between SAMP8 and SAMR1 mice, and the gray area represents the SEM of these differences. The left Y-axis in d represents the delta (Δ) in mean quantities of antioxidants (Nrf2, light blue plot and SOD2 blue plot) observed in SAMP8 mice relative to in SAMR1 mice. The right Y-axis in d represents the delta (Δ) in mean quantities of pro-oxidants (p66Shc, pink plot and p-p66Shc, red plot) observed in SAMP8 mice relative to that in SAMR1 mice. The left Y-axis in e and f represents the delta (Δ) in mean quantities of DNA damage response proteins (p-Chk2, pink plot; p53, red plot; and p-p53, light red plot in e) and of senescence markers (p21, pink plot and p16, red plot, in f). The right Y-axis in f represents the delta (Δ) in mean quantities of the mitotic checkpoint protein BubR1 (light blue plot in f) and of the cell cycle regulator p19 (blue plot in f) observed in SAMP8 mice relative to that in SAMR1 mice. The mean quantities of proteins were derived from Figs. 6 and 7
Fig. 9
Fig. 9
Pharmacological mitigation of ROS prevents loss of hearing and hair cells in adult mice. a ABR thresholds recorded before (pale red plot) and after 2 months (pink plot) and 3 months (red plot) of mannitol treatment, or before (pale blue plot) and after 2 months (azure plot) and 3 months (blue plot) of EUK-207 treatment. b Mean ABR threshold from 2 to 32 kHz derived from a. Data are expressed as mean ± SEM (n = 10 per group). One-way ANOVA test was followed by post hoc Tukey’s test (**P ≤ 0.006, ***P ≤ 0.001 vs. mannitol). c Representative scanning electron microscopy micrographs showing the basal regions of cochleae from mannitol-treated and EUK-207-treated SAMP8 mice after 3 months of treatment. Scale bar = 15 μm. d Cytocochleograms representing the percentage of surviving hair cells in four cochlear regions located at 1.1, 2.6, 3.5, or 4.1 mm from the cochlear apex from mannitol-treated (red bars) and EUK-207-treated (blue bars) SAMP8 mice (n = 7 per group). Data are expressed as mean ± SEM. One-way ANOVA test was followed by post hoc Tukey’s test (*P ≤ 0.028, ***P ≤ 0.001 vs. mannitol-treated group)

References

    1. Lethbridge-Cejku M, Schiller JS, Bernadel L (2004) Summary health statistics for U.S. adults: National Health Interview Survey, 2002. Vital Health Stat Series 10, Data from the National Health Survey (222):1–151. - PubMed
    1. Jayakody DMP, Friedland PL, Martins RN, Sohrabi HR. Impact of aging on the auditory system and related cognitive functions: a narrative review. Front Neurosci. 2018;12:125. - PMC - PubMed
    1. Han C, Someya S. Mouse models of age-related mitochondrial neurosensory hearing loss. Mol Cell Neurosci. 2013;55:95–100. - PMC - PubMed
    1. Menardo J, Tang Y, Ladrech S, Lenoir M, Casas F, Michel C, Bourien J, Ruel J, Rebillard G, Maurice T, Puel JL, Wang J. Oxidative stress, inflammation, and autophagic stress as the key mechanisms of premature age-related hearing loss in SAMP8 mouse cochlea. Antioxid Redox Signal. 2012;16(3):263–274. - PubMed
    1. Jiang H, Talaska AE, Schacht J, Sha SH. Oxidative imbalance in the aging inner ear. Neurobiol Aging. 2007;28(10):1605–1612. - PMC - PubMed

MeSH terms