. 2019 Jun;196(3):345-352.
doi: 10.1111/cei.13264. Epub 2019 Feb 17.

Effect of pembrolizumab on CD4+ CD25+ , CD4+ LAP+ and CD4+ TIM-3+ T cell subsets

Affiliations

Effect of pembrolizumab on CD4+ CD25+ , CD4+ LAP+ and CD4+ TIM-3+ T cell subsets

S M Toor et al. Clin Exp Immunol. 2019 Jun.

Abstract

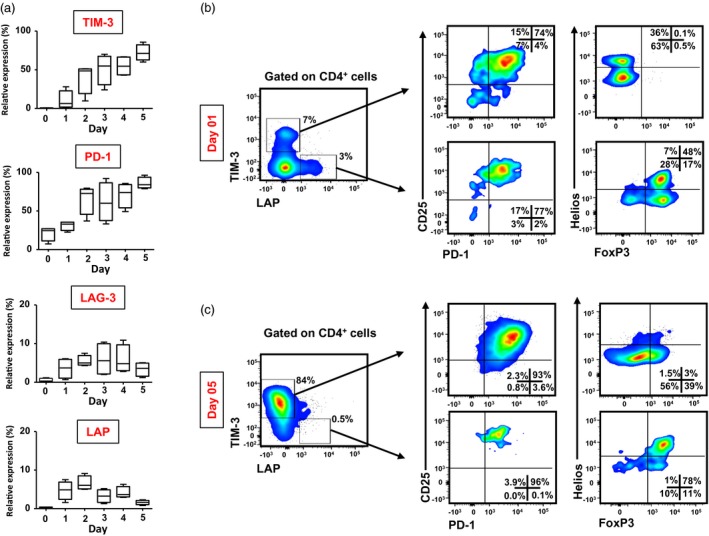
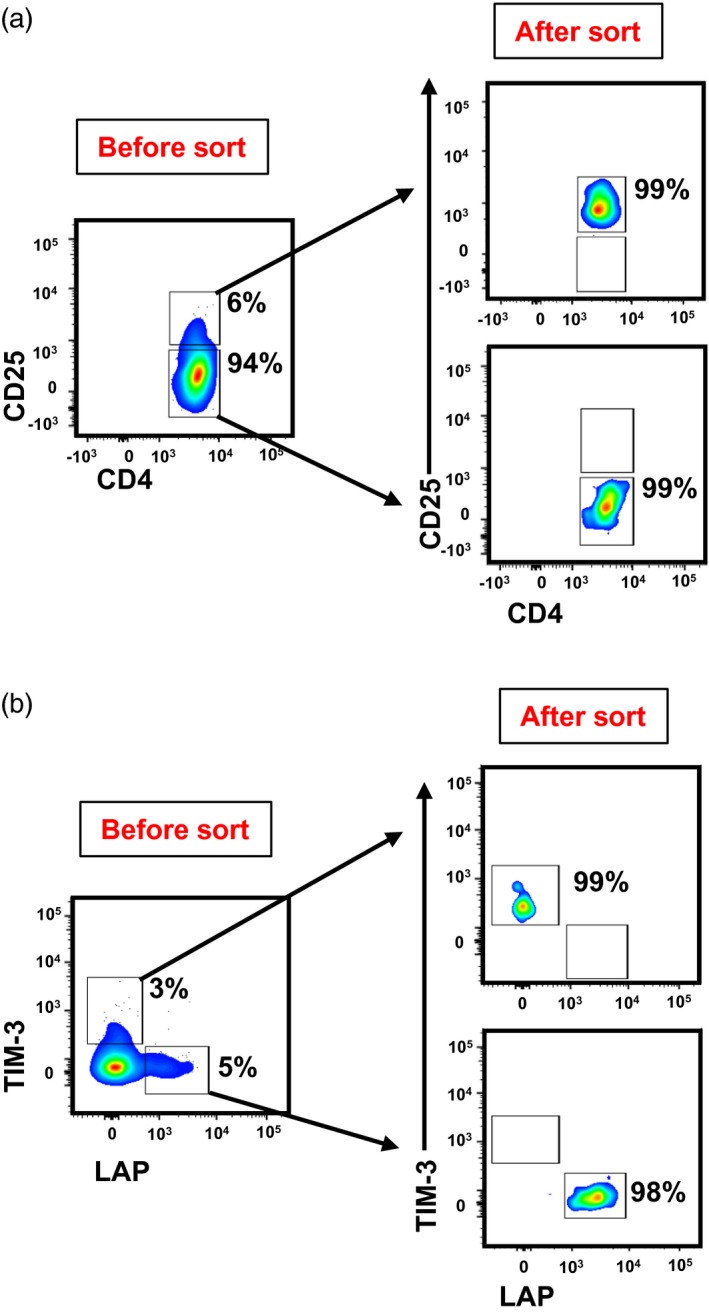
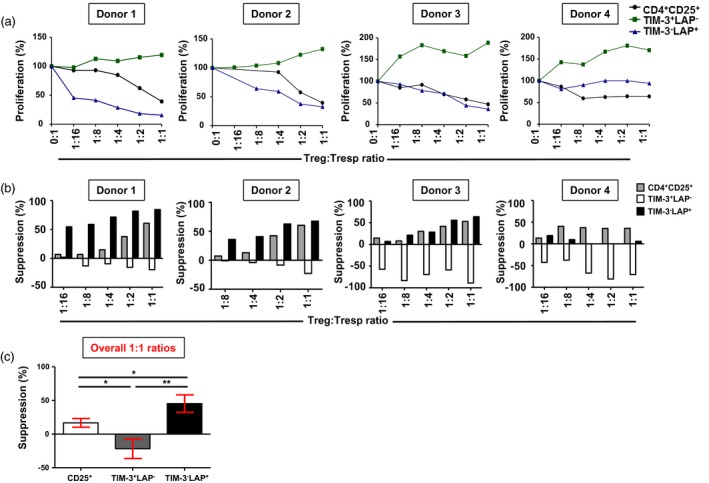
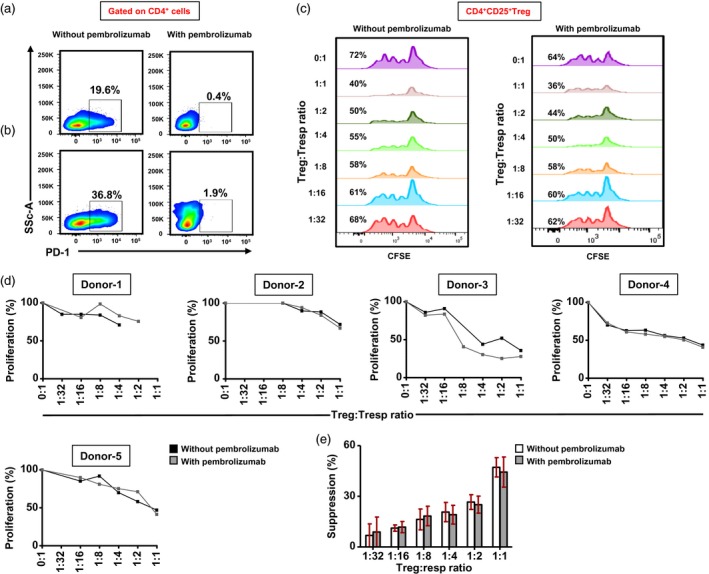
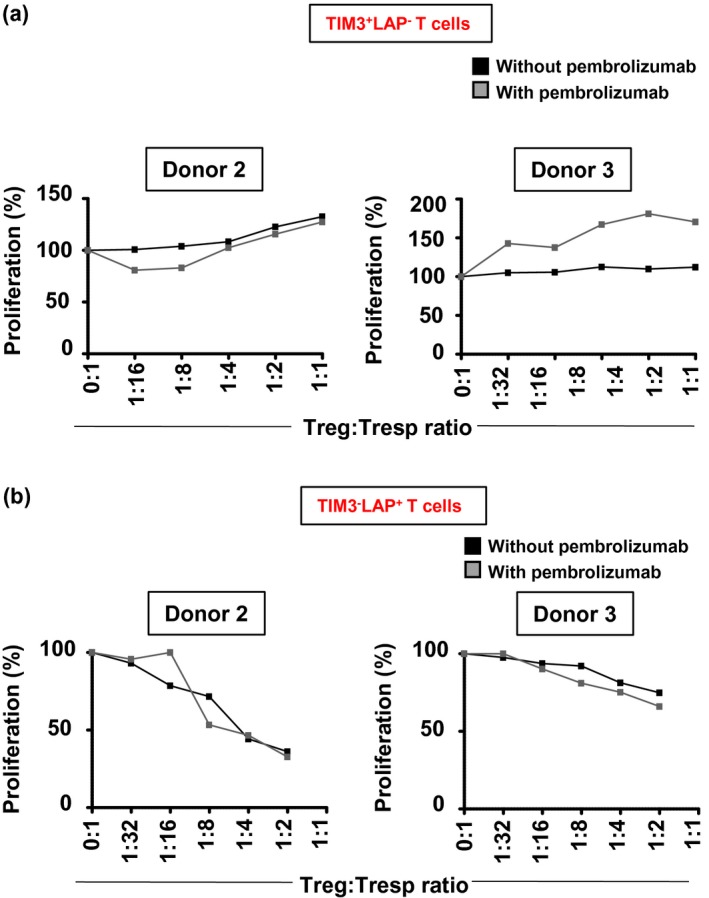
Tumor immune evasion involves the expansion of avidly proliferating immunosuppressive cells and inhibition of effector T cell proliferation. Immune checkpoints (IC) block the activation pathways of tumor-reactive T cells. IC pathways are often exploited by tumor cells to evade immune destruction, and blocking these pathways through IC inhibitors (ICI) has shown promising results in multiple malignancies. In this study, we investigated the effects of an ICI, pembrolizumab, on various T cell subsets in vitro. We compared the suppressive activity of CD4+ CD25+ regulatory T cells (conventional Treg ) with T cells expressing T cell immunoglobulin-3+ (TIM-3+ ) and latency-associated peptide (LAP)+ T cells. We found that LAP-expressing T cells were more suppressive than conventional Treg , but TIM-3-expressing T cells were not suppressive. Our results show that pembrolizumab does not modulate functions of Treg and mediates its immunostimulatory effects via the release of effector T cells from suppression. These findings may assist in the development of agents designed to intervene in IC pathways to overcome Treg resistance to ICI.

Keywords: cell activation; cell proliferation; regulatory T cells.


Conflict of interest statement

The authors declare no conflicts of interest.

Figures

Figure 1
Figure 1
Kinetics of immune checkpoint and regulatory T cell (Treg)‐related marker expression on CD4+ T cells following activation. Peripheral blood mononuclear cells (PBMC) from healthy donors (HD) were cultured for 5 days in the presence of soluble anti‐CD3 and anti‐CD28 antibodies, and stained for CD4, CD25, T cell immunoglobulin‐3 (TIM‐3), programmed death 1 (PD‐1), lymphocyte‐activation gene 3 (LAG‐3) and latency‐associated peptide (LAP) antibodies at 1‐day intervals. Box‐plots show the kinetics of TIM‐3, PD‐1, LAG‐3 and LAP expression for 5 days following activation (a). Representative flow cytometric plots show TIM‐3 and LAP expression on CD4+ cells, and CD25/PD‐1 expression and forkhead box protein 3 (FoxP3)/Helios expression in CD4+TIM‐3+/–LAP+/– subsets, following activation for 1 day (b) and 5 days (c). Live cells were gated first using 7‐aminoactinomycin D (7AAD) viability dye. Data are from four individual experiments.
Figure 2
Figure 2
Sorting strategy and purity of CD4+CD25+ conventional regulatory T cell (Treg) and CD4+ latency‐associated peptide (LAP)T cell immunoglobulin‐3 (TIM‐3)+ and CD4+LAP+TIM‐3 T cells. Activated peripheral blood mononuclear cells (PBMC) from healthy donors (HD) were stained with CD4, CD25, TIM‐3 and LAP antibodies to sort conventional Treg, responder T cells and CD4+TIM‐3+ LAP and CD4+TIM‐3LAP+ T cells. Representative flow cytometric plots gated on CD4+ cells from live cells, showing the gating strategy employed for sorting CD4+CD25+ conventional Treg and CD4+CD25 responder T cells, and the purity of sorted populations. (a) Representative flow cytometric plots CD4+ cells from live cells, showing the gating strategy employed for sorting CD4+TIM‐3+LAP and CD4+TIM‐3LAP+ T cells, and the purity of sorted populations (b).
Figure 3
Figure 3
Suppressive potential of various T cell subsets on CD4+CD25 responder T cells. Carboxyfluorescein diacetate succinimidyl ester (CFSE)‐based suppression assays were performed to investigate responder T cell proliferation. The effects of CD4+CD25+ conventional regulatory T cell (Treg) and CD4+ T cell immunoglobulin‐3 (TIM‐3)+/–latency‐associated peptide (LAP)+/– T cells on the proliferation of CD4+CD25 responder T cells were studied on sorted populations (> 95% purity). Line graphs show the effects on proliferation of CD4+CD25 responder T cells by varying ratios of Treg/TIM‐3+/–LAP+/– T cells and responder T cells in four healthy donors (HD) (a). Bar plots show the percentages of suppression of responder T cells by varying ratios of Treg and TIM‐3+/–LAP+/– T cells in four HD (b). Bar plot shows the comparison in suppressive activity of conventional Treg, TIM‐3+ T cells and LAP+ T cells (c). Data represent the mean values ± standard error of the mean (s.e.m.) from the four HD.
Figure 4
Figure 4
Effects of pembrolizumab on the suppressive activity of CD4+CD25+ conventional regulatory T cells (Treg). Sorted CD4+CD25+ Treg and CD4+CD25 responder T cells (Tresp) (both > 95% purity) were cultured in different ratios in the presence or absence of pembrolizumab (2 µg/ml). Efficacy of pembrolizumab was first examined by flow cytometry. Representative flow cytometric plots show the effects of pembrolizumab on programmed death 1 (PD‐1) expression after 24 h on non‐activated (a) and activated (b) CD4+ T cells. Representative histogram plots show the percentage of carboxyfluorescein diacetate succinimidyl ester (CFSE) loss in different Treg : Tresp ratios, treated with or without pembrolizumab (c). Line graphs show the effects of pembrolizumab treatment on Tresp proliferation in different Treg : Tresp ratios in five healthy donors (HD) (d). Bar plot shows the effects of pembrolizumab treatment on Treg suppression in five HD (e). Data represent the mean values ± standard error of the mean (s.e.m.) from five HD.
Figure 5
Figure 5
Effects of pembrolizumab on CD4+ latency‐associated peptide (LAP) T cell immunoglobulin‐3 (TIM‐3)+ and CD4+LAP+TIM3 T cells. Sorted CD4+TIM‐3+, CD4+ (LAP)+ T cells and CD4+CD25responder T cells (Tresp) (all > 95% purity) were cultured in different ratios in the presence or absence of pembrolizumab (2 µg/ml). Line graphs show the effect of pembrolizumab on proliferation of Tresp cells with varying ratios of CD4+TIM‐3+ T cells in two healthy donors (HD) (a). Line graphs show the effect of pembrolizumab on proliferation of Tresp cells with varying ratios of CD4+LAP+ T cells in two HD (b).

Similar articles

Cited by

References

    1. Lindau D, Gielen P, Kroesen M, Wesseling P, Adema GJ. The immunosuppressive tumour network: myeloid‐derived suppressor cells, regulatory T cells and natural killer T cells. Immunology 2013; 138:105–15. - PMC - PubMed
    1. Smith‐Garvin JE, Koretzky GA, Jordan MS. T cell activation. Annu Rev Immunol 2009; 27:591–619. - PMC - PubMed
    1. Buchholz VR, Schumacher TN, Busch DH. T cell fate at the single‐cell level. Annu Rev Immunol 2016; 34:65–92. - PubMed
    1. Jiang Y, Li Y, Zhu B. T‐cell exhaustion in the tumor microenvironment. Cell Death Dis 2015; 6:e1792. - PMC - PubMed
    1. Syn NL, Teng MWL, Mok TSK, Soo RA. De‐novo and acquired resistance to immune checkpoint targeting. Lancet Oncol 2017; 18:e731–41. - PubMed

Publication types

MeSH terms