. 2019 Jun;69(6):2608-2622.
doi: 10.1002/hep.30529. Epub 2019 Mar 13.

The BRUCE-ATR Signaling Axis Is Required for Accurate DNA Replication and Suppression of Liver Cancer Development

Affiliations

The BRUCE-ATR Signaling Axis Is Required for Accurate DNA Replication and Suppression of Liver Cancer Development

Chunmin Ge et al. Hepatology. 2019 Jun.

Abstract

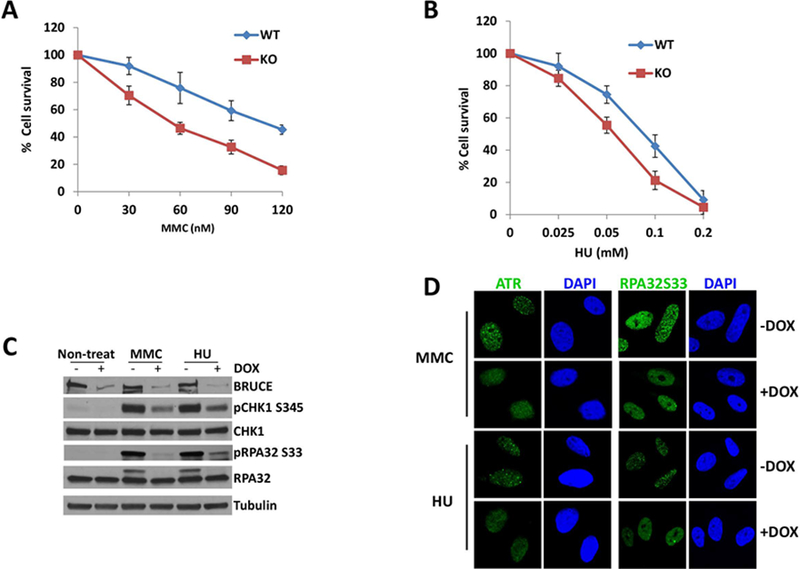
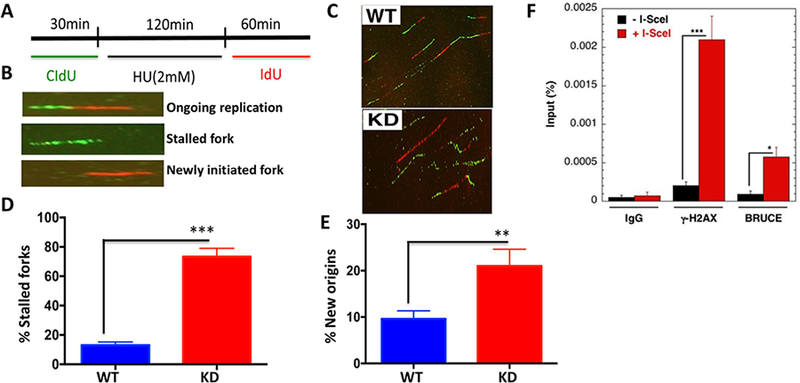
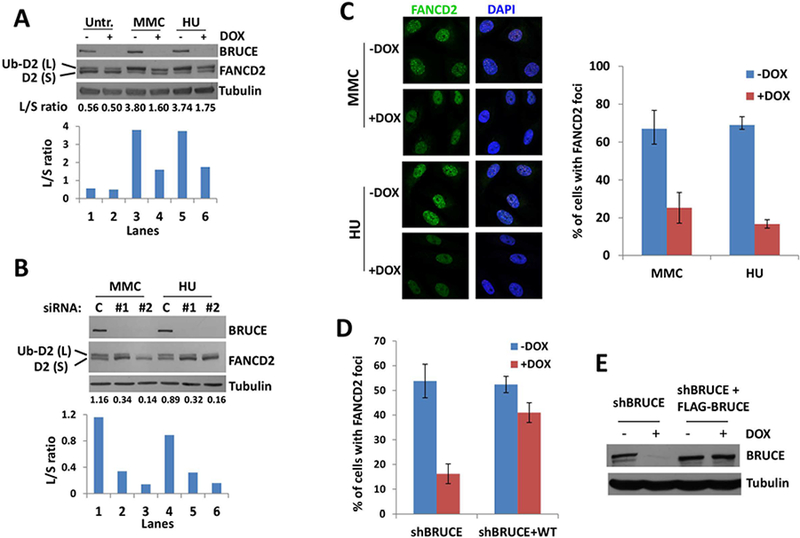
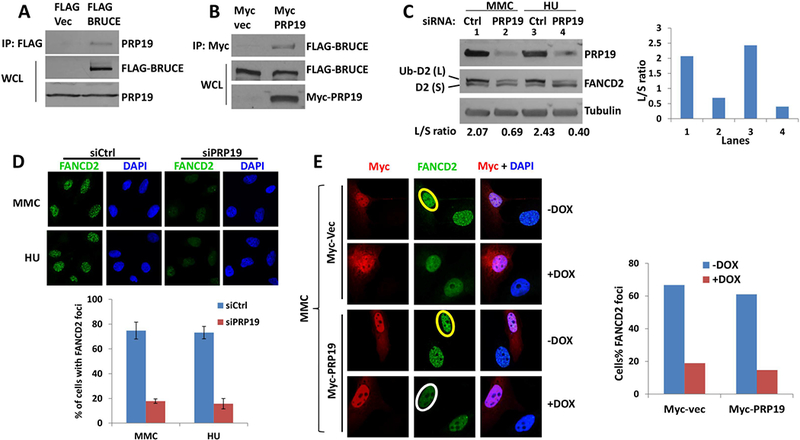
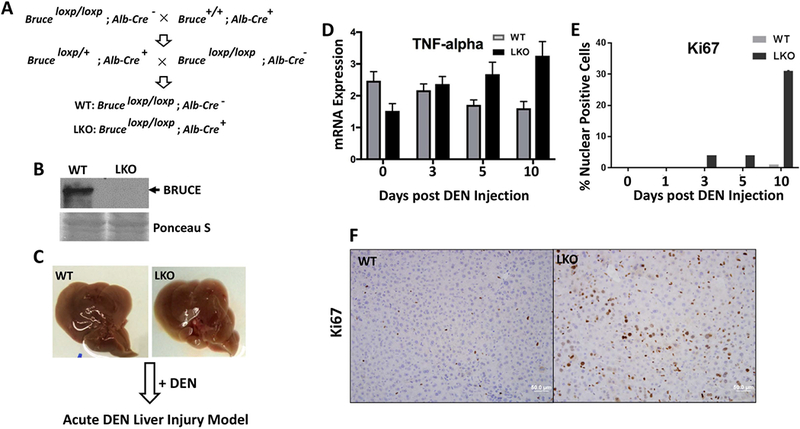
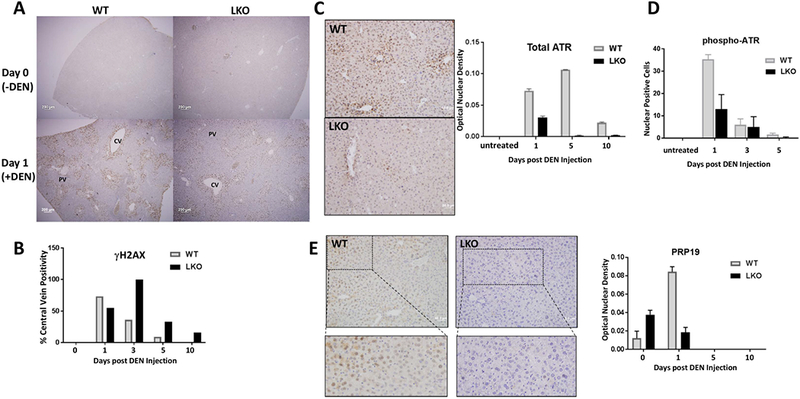
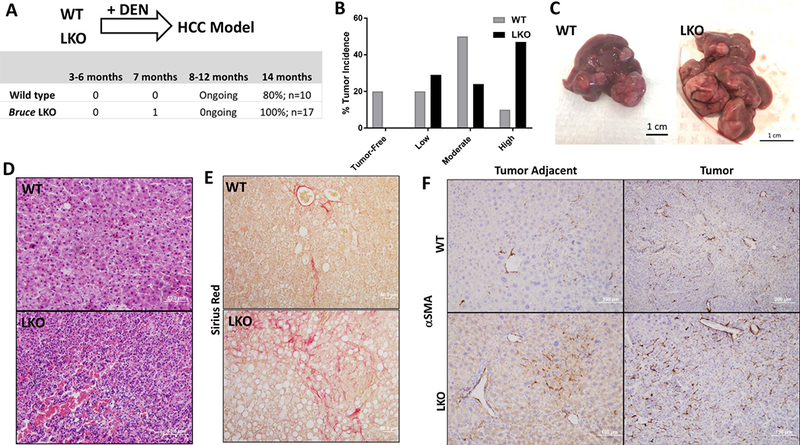
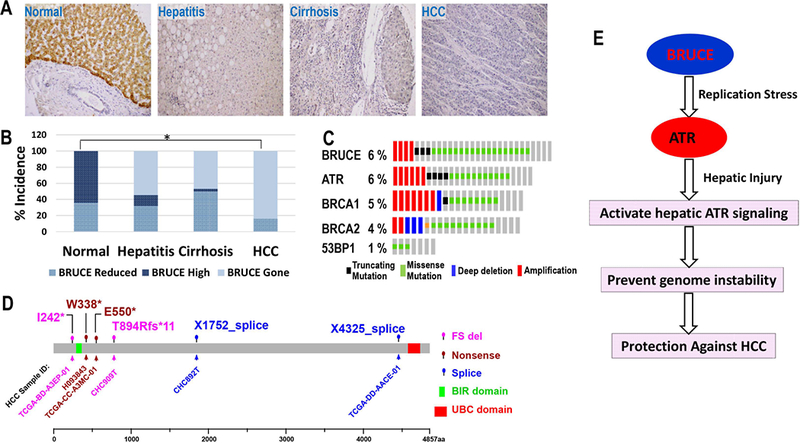
Replication fork stability during DNA replication is vital for maintenance of genomic stability and suppression of cancer development in mammals. ATR (ataxia-telangiectasia mutated [ATM] and RAD3-related) is a master regulatory kinase that activates the replication stress response to overcome replication barriers. Although many downstream effectors of ATR have been established, the upstream regulators of ATR and the effect of such regulation on liver cancer remain unclear. The ubiquitin conjugase BRUCE (BIR Repeat containing Ubiquitin-Conjugating Enzyme) is a guardian of chromosome integrity and activator of ATM signaling, which promotes DNA double-strand break repair through homologous recombination. Here we demonstrate the functions for BRUCE in ATR activation in vitro and liver tumor suppression in vivo. BRUCE is recruited to induced DNA damage sites. Depletion of BRUCE inhibited multiple ATR-dependent signaling events during replication stress, including activation of ATR itself, phosphorylation of its downstream targets CHK1 and RPA, and the mono-ubiquitination of FANCD2. Consequently, BRUCE deficiency resulted in stalled DNA replication forks and increased firing of new replication origins. The in vivo impact of BRUCE loss on liver tumorigenesis was determined using the hepatocellular carcinoma model induced by genotoxin diethylnitrosamine. Liver-specific knockout of murine Bruce impaired ATR activation and exacerbated inflammation, fibrosis and hepatocellular carcinoma, which exhibited a trabecular architecture, closely resembling human hepatocellular carcinoma (HCC). In humans, the clinical relevance of BRUCE down-regulation in liver disease was found in hepatitis, cirrhosis, and HCC specimens, and deleterious somatic mutations of the Bruce gene was found in human hepatocellular carcinoma in the Cancer Genome Atlas database. Conclusion: These findings establish a BRUCE-ATR signaling axis in accurate DNA replication and suppression of liver cancer in mice and humans and provides a clinically relevant HCC mouse model.


Conflict of interest statement

Potential conflict of interest: None.

Figures

Fig. 1.
Fig. 1.. BRUCE is required for the replication stress response and ATR activation
(A) Clonogenic survival assay shows that cells are sensitive to MMC treatment in the absence of BRUCE. (B) Clonogenic survival assay shows that cells are more sensitive to HU treatment in the absence of BRUCE. (C) U2OS shBRUCE cells were treated with DOX to deplete BRUCE. MMC or HU was added to medium at day 3 with a final concentration of 1 μm and 2 mM respectively. After another 24 hrs in culture, cells were collected and subjected to immunoblotting against antibodies as indicated. (D) U2OS cells were depleted of BRUCE in the presence of DOX and treated with 1 μm MMC or 2 mM HU for 24 hours. Cells were fixed and immunostained for ATR and phospho-RPA32; representative images are shown.
Fig. 2.
Fig. 2.. BRUCE localizes to DNA breaks induced by I-SceI endonuclease and suppresses replication fork stalling and new replication origin firing upon replication stress
(A) DNA fibers in HU-treated shBRUCE U2OS cells were labeled following the scheme and analyzed as outlined (B). (C) Representative DNA fiber images were taken and the frequency of stalled forks (D) and new origin firing (E) was quantified. **p < 0.01; ***p<0.001; Paired Student’s t test. (F) Chromatin IP/qPCR of BRUCE and γH2AX (control) with human fibroblast DR-95 cell line showing recruitment of BRUCE to sites of DNA breaks induced by I-SecI endounuclease.
Fig. 3.
Fig. 3.. BRUCE is required for activation of the ATR-FA pathway
(A) U2OS shBRUCE cells were treated with DOX to deplete BRUCE. MMC or HU were added to medium at day 3 with final concentrations of 1 μm and 2 mM, respectively. After another 24 hrs culture, cells were collected and subject to immunoblot against BRUCE, FANCD2 and Tubulin. Lower bar graph represents the intensity ratio between FANCD2 large band (Ub-D2) and small band (D2); quantification was carried out with ImageJ software. (B) U2OS cells were depleted of BRUCE by two distinct siRNAs and treated (or mock treated) with MMC or HU for 24 hrs with a final concentration of 1 μm and 2 mM, respectively. Cells were collected and subject to immunoblot against BRUCE, FANCD2 and Tubulin. The lower bar graph represents the intensity ratio of the FANCD2 large band (Ub-D2) and the small band (D2), quantification was performed with ImageJ software. (C) U2OS shBRUCE cells were depleted of BRUCE by DOX and treated with 1 μm MMC or 2 mM HU for 24 hours. Cells were fixed and stained for FANCD2 foci. Representative images are shown and quantification of FANCD2 foci is displayed on the right, bars represent SD from a triplicate experiment. (D) Quantification of FANCD2 foci in U2OS shBRUCE cells and shBRUCE cells reconstituted with FLAG-BRUCE (shBRUCE+WT). Error bars represent SD from a triplicate experiment. (E) Western blot showing abolished BRUCE expression in shBRUCE cells treated with DOX and recovery of BRUCE in shBRUCE cells reconstituted with FLAG-BRUCE (shBRUCE+WT).
Fig. 4.
Fig. 4.. BRUCE interacts with PRP19 which is required for FANCD2 mono-ubiquitination and foci formation
(A) U2OS cells stably expressing of FLAG-BRUCE were lysed and immunoprecipitation was carried out with anti-FLAG antibody. Elution was subjected to SDS-PAGE and immunoblotted for PRP19. (B) U2OS cells that stably expressed FLAG-BRUCE were transfected with Myc-vector or Myc-PRP19 expression vector, and immunoprecipitation was carried out with anti-MYC antibody. The eluate was subjected to SDS-PAGE and immunoblotting against FLAG (BRUCE). (C) U2OS cells were depleted of PRP19 by siRNA and treated with MMC or HU for 24 hrs with a final concentration at 1 μm and 2 mM respectively. Cells were collected and subject to immunoblot against BRUCE, FANCD2 and Tubulin, with the intensity of the ratio between FANCD2 large band (Ub-D2) and small band (D2) quantified with ImageJ software and shown to the right. (D) U2OS cells were depleted of PRP19 by siRNA and treated with 1 μm MMC or 2 mM HU for 24 hours. Cells were fixed and stained for FANCD2 foci, representative images are present with the quantification of FANCD2 foci shown below. Bars represent SD from a triplicate experiment. (E) U2OS cells were treated with DOX and transfected with MYC vector or MYC-PRP19 expression vector. After treatment with 1 μm MMC for 24 hours, cells were fixed and immunostained for MYC (Red) and FANCD2 (Green). Quantification of FANCD2 foci was shown to the right. Circle in yellow and white showing positive and negative nuclear FANCD2 foci, respectively.
Fig. 5.
Fig. 5.. Bruce liver-specific KO mice are more prone to acute liver injury by DEN
(A) Mouse breeding schematic demonstrates the cross of Bruceloxp/loxp mice with Albumin-Cre positive mice for generation of Bruce liver-specific KO (LKO) mice, genotypes confirmed. (B) Western blot analysis shows absent of BRUCE protein expression in LKO mice. (C) No detectible phenotypic differences among WT and LKO mouse livers (2-month age). (D) Significantly increased mRNA transcription levels of inflammation marker the tumor necrosis factor alpha (TNFα) in LKO livers treated with DEN. (E) Quantification of Ki67 IHC staining showed a significant increase in compensatory proliferation in LKO livers as compared to WT. (F) Representative photos of Ki67 IHC staining 10 days post DEN treatment.
Fig. 6.
Fig. 6.. Bruce LKO liver has increased level of DEN-induced DNA damage and impaired ATR-PRP19 activity
(A) IHC staining of γH2AX reveals DNA damage in both WT and LKO mouse livers one day post DEN induction. (B) IHC quantification of γH2AX showing persistent DNA damage in LKO livers. (C) Representative photos of the total ATR IHC five days post DEN treatment; IHC quantification of nuclear total ATR staining to the right. (D) IHC quantification of pATR-Thr1989 showing a decrease in ATR activity in LKO livers upon DEN treatment in a time course study with days post DEN exposure indicated. (E) Representative photos with zooms below for PRP19 IHC of the liver, one day post DEN treatment. To the right is IHC quantification of nuclear PRP19 staining showing a decrease in nuclear localization of PRP19 in LKO livers upon DEN treatment in a time course study.
Fig. 7.
Fig. 7.. Exacerbated fibrosis and HCC in the Bruce LKO liver
(A) DEN induced HCC model (Diagram) was established with WT and Bruce LKO mice by treatment with 25mg/kg of DEN and sacrificed after 14 months. BRUCE LKO mice developed HCC at a 100% incidence as compared to the lower 80% incidence in WT mice. (B) HCC severity was categorized into: low-HCC, medium-HCC, and high-HCC. Low-HCC describes a liver with all of the liver lobes are distinguishable with a few smaller tumors. Medium-HCC livers possessed larger tumors that engulfed at least 1–2 of the lobes of the liver. Finally, high-HCC described livers that contained many large tumors that engulfed all lobes of the liver. The most common HCC severity found in the WT mice was the medium-HCC whereas that in LKO mice was the high-HCC category. (C) Representation of a WT liver with a medium-HCC phenotype and a LKO liver with a high-HCC phenotype. (D) Hematoxylin & Eosin staining of WT and LKO tumors showing the LKO liver with increased lymphocyte infiltration and a trabecular pattern, a common feature found in human HCC. (E) Sirius Red staining (red staining) of WT and LKO tumors showing increased fibrosis in LKO livers. (F) α-Smooth muscle actin IHC of WT and LKO tumors and tumor adjacent tissue demonstrating increased fibrosis in LKO livers.
Fig. 8.
Fig. 8.. BRUCE protein downregulation and Bruce gene somatic mutations in human HCC
(A) Human normal liver section stained positive for BRUCE protein in hepatocytes (upper area, brown signals) by IHC; lower area bile duct; Steatohepatitic liver section stained for BRUCE showing both reduced BRUCE protein expression compared to normal liver tissue and significant lymphocyte infiltration and accumulated fat; Cirrhotic liver section showing both reduced BRUCE protein expression compared to normal liver tissue and one cirrhotic nodule in the right area of the photo; HCC section showing nearly negative BRUCE protein expression compared to normal liver tissue. (B) The IHC results in each category in panel A were semi-quantified by clinical scoring and converted to the incidence of BRUCE expression alteration into high, reduced and being gone (absent). The percentage of “BRUCE being gone”: steatohepatitis (54.5%), cirrhosis (46.7%) and HCC (84%). *p = 2.0 × 10⁻⁷; ONE-SIDED Fisher’s exact test. (C) TCGA HCC data portal showing a rate of 6% BRUCE somatic mutation, same or higher than that of ATR and BRCA1/2 genes with which BRUCE works together in the same DNA damage response pathway. (D) The Amino acid residues with somatic mutations are shown in the BRUCE protein diagram (4857 amino acids with its BIR and UBC domains indicated). The TCGA HCC sample identification number (ID) that reported each mutation site are shown. Three major types of mutations are found: FS (frame shift), nonsense mutation and splice alterations. (E) Diagram showing our working model: BRUCE promotes the ATR-replication stress response to assure accurate DNA replication and prevent genome instability. This new BRUCE-ATR axis is present in the liver and the in vivo significance of this pathway is to protect the liver against genotixin injury and suppress the HCC development.

References

    1. Tubbs A, Nussenzweig A. Endogenous DNA Damage as a Source of Genomic Instability in Cancer. Cell 2017;168:644–656. - PMC - PubMed
    1. Marechal A, Zou L. DNA damage sensing by the ATM and ATR kinases. Cold Spring Harb Perspect Biol 2013;5. - PMC - PubMed
    1. Hauser HP, Bardroff M, Pyrowolakis G, Jentsch S. A giant ubiquitin-conjugating enzyme related to IAP apoptosis inhibitors. J Cell Biol 1998;141:1415–1422. - PMC - PubMed
    1. Chen Z, Naito M, Hori S, Mashima T, Yamori T, Tsuruo T. A human IAP-family gene, apollon, expressed in human brain cancer cells. Biochem Biophys Res Commun 1999;264:847–854. - PubMed
    1. Lotz K, Pyrowolakis G, Jentsch S. BRUCE, a Giant E2/E3 Ubiquitin Ligase and Inhibitor of Apoptosis Protein of the trans-Golgi Network, Is Required for Normal Placenta Development and Mouse Survival. Mol Cell Biol 2004;24:9339–9350. - PMC - PubMed

Publication types

MeSH terms

Substances