

Primary progressive aphasia: a model for neurodegenerative disease
- PMID: 30694922
- PMCID: PMC6602793
- DOI: 10.1097/WCO.0000000000000673
Primary progressive aphasia: a model for neurodegenerative disease
Abstract
Purpose of review: Knowledge on primary progressive aphasia (PPA) has expanded rapidly in the past few decades. Clinical characteristics, neuroimaging correlates, and neuropathological features of PPA are better delineated. This facilitates scientific studies on the disease pathophysiology and allows speech and language therapy to be more precisely targeted. This review article begins with a summary of the current understanding of PPA and discusses how PPA can serve as a model to promote scientific discovery in neurodegenerative diseases.
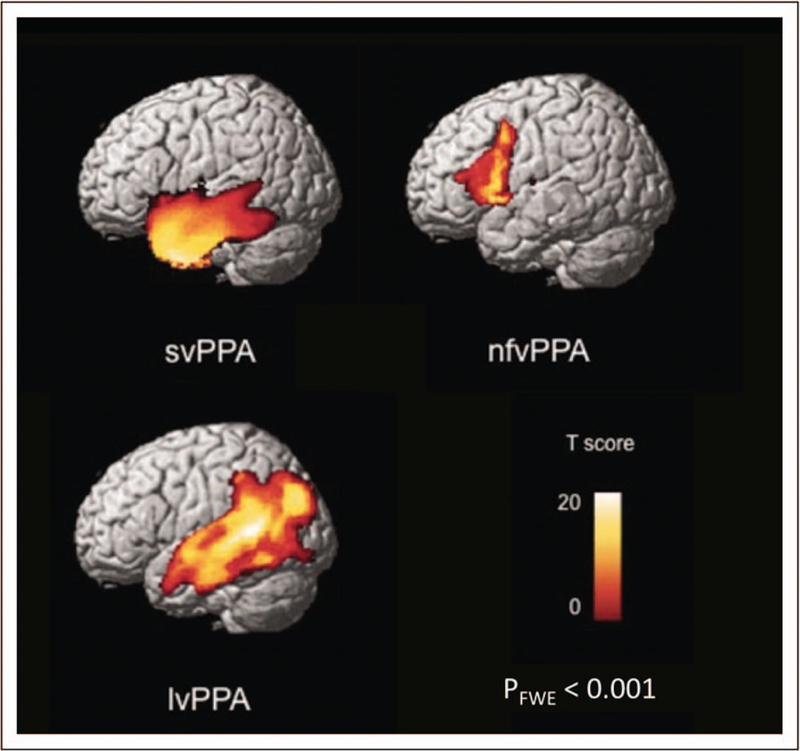
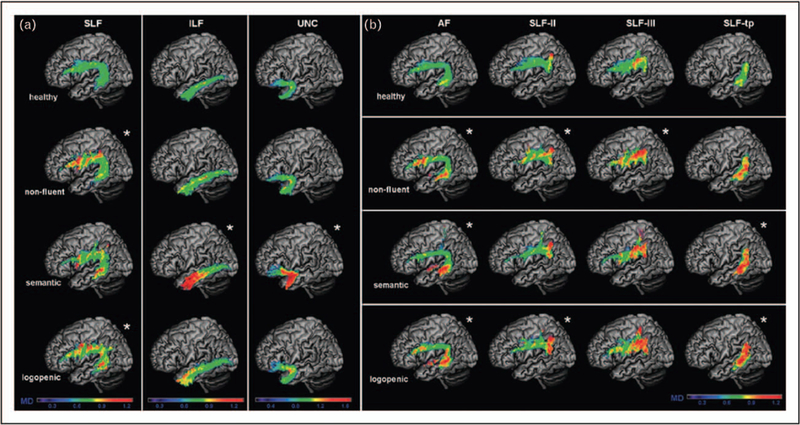
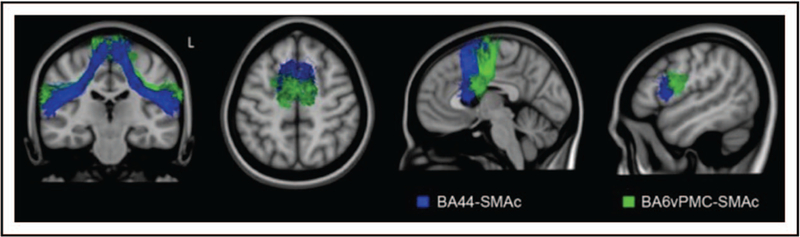
Recent findings: Studies on the different variants of PPA have demonstrated the high compatibility between clinical presentations and neuroimaging features, and in turn, enhances the understanding of speech and language neuroanatomy. In addition to the traditional approach of lesion-based or voxel-based mapping, scientists have also adopted functional connectivity and network topology approaches that permits a more multidimensional understanding of neuroanatomy. As a result, pharmacological and cognitive therapeutic strategies can now be better targeted towards specific pathological/molecular and cognitive subtypes.
Summary: Recent scientific advancement in PPA potentiates it to be an optimal model for studying brain network vulnerability, neurodevelopment influences and the effects of nonpharmacological intervention in neurodegenerative diseases.
Conflict of interest statement
Conflicts of interest
There are no conflicts of interest.
Figures
References
-
- Pick A Über die Beziehungen der senilen Atrophie zur Aphasie. Prager Medizinische Wochenschrift 1892; 17:165–167.
-
- Imura T Aphasia: characteristic symptoms in Japanese. Psychiatr Neurol Japon 1943; 46:196–218.
-
- Warrington EK. The selective impairment of semantic memory. Q J Exp Psychol 1975; 27:635–657. - PubMed
-
- Snowden J, Goulding PJ, Neary D. Semantic dementia: a form of circumscribed cerebral atrophy. Behav Neurol 1989; 2:167–182.
-
- Mesulam MM. Primary progressive aphasia–differentiation from Alzheimer’s disease. Ann Neurol 1987; 22:533–534. - PubMed
Publication types
MeSH terms
Grants and funding
- P50 AG023501/AG/NIA NIH HHS/United States
- R21 AG068757/AG/NIA NIH HHS/United States
- R01 AG038791/AG/NIA NIH HHS/United States
- U01 AG052943/AG/NIA NIH HHS/United States
- R01 NS100440/NS/NINDS NIH HHS/United States
- U01 AG045390/AG/NIA NIH HHS/United States
- U54 NS092089/NS/NINDS NIH HHS/United States
- K24 DC015544/DC/NIDCD NIH HHS/United States
- P01 AG019724/AG/NIA NIH HHS/United States
- R01 DC016291/DC/NIDCD NIH HHS/United States
- R56 NS050915/NS/NINDS NIH HHS/United States
- R01 NS050915/NS/NINDS NIH HHS/United States
LinkOut - more resources
Full Text Sources
Medical
Research Materials
Miscellaneous
