. 2019 Jan 29;14(1):e0211333.
doi: 10.1371/journal.pone.0211333. eCollection 2019.

Unique and overlapping GLI1 and GLI2 transcriptional targets in neoplastic chondrocytes

Affiliations

Unique and overlapping GLI1 and GLI2 transcriptional targets in neoplastic chondrocytes

Shabana Amanda Ali et al. PLoS One. .

Abstract

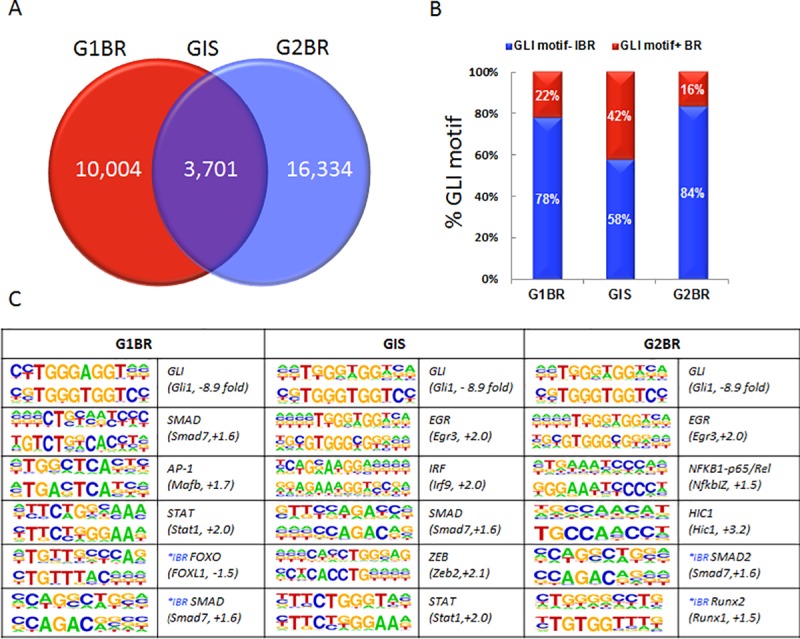
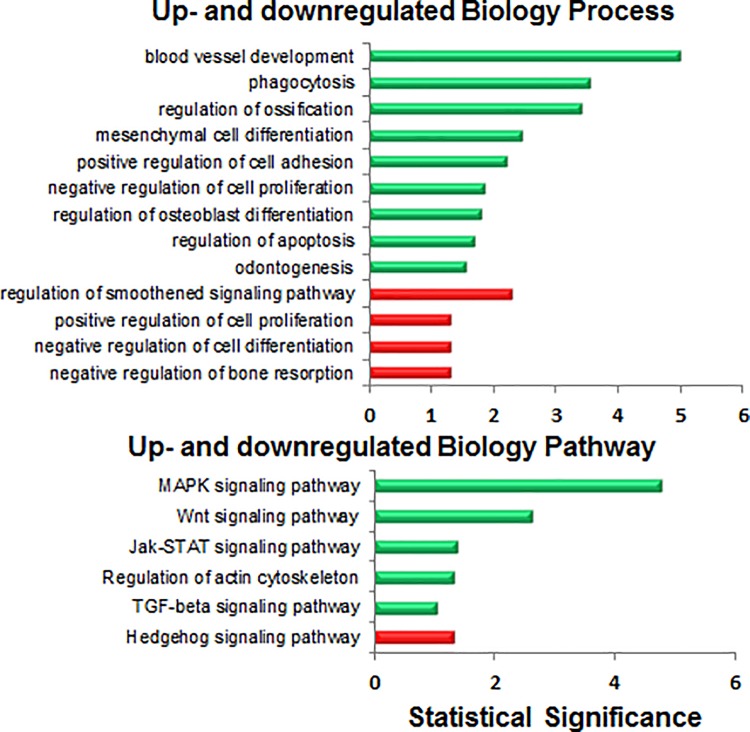
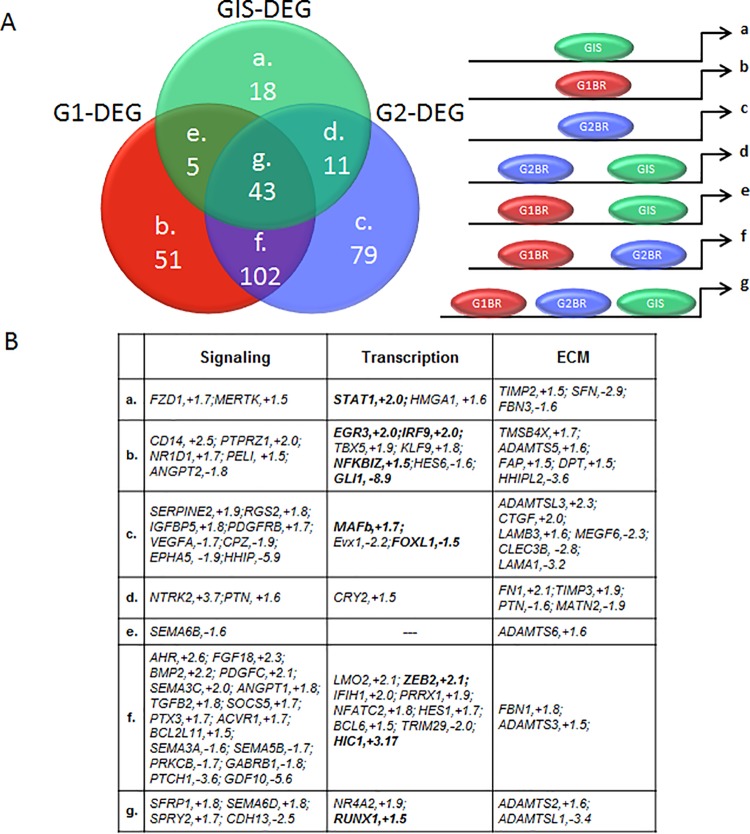
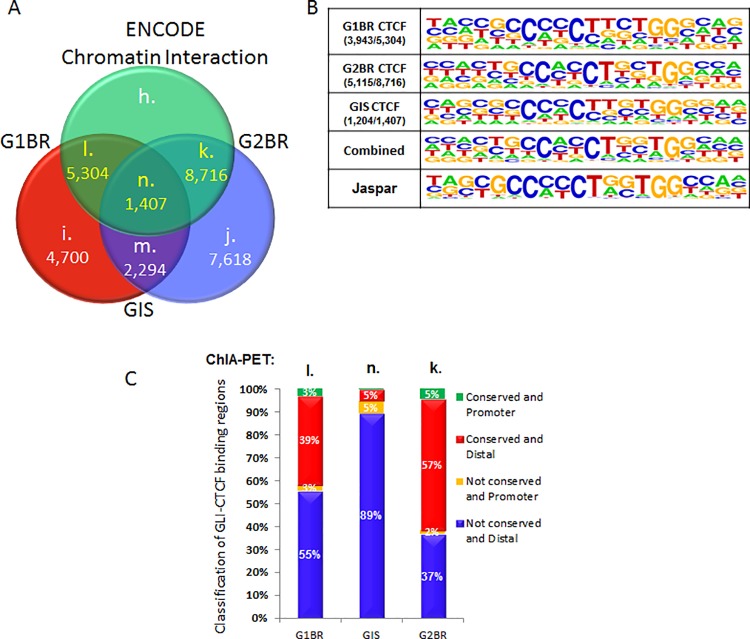
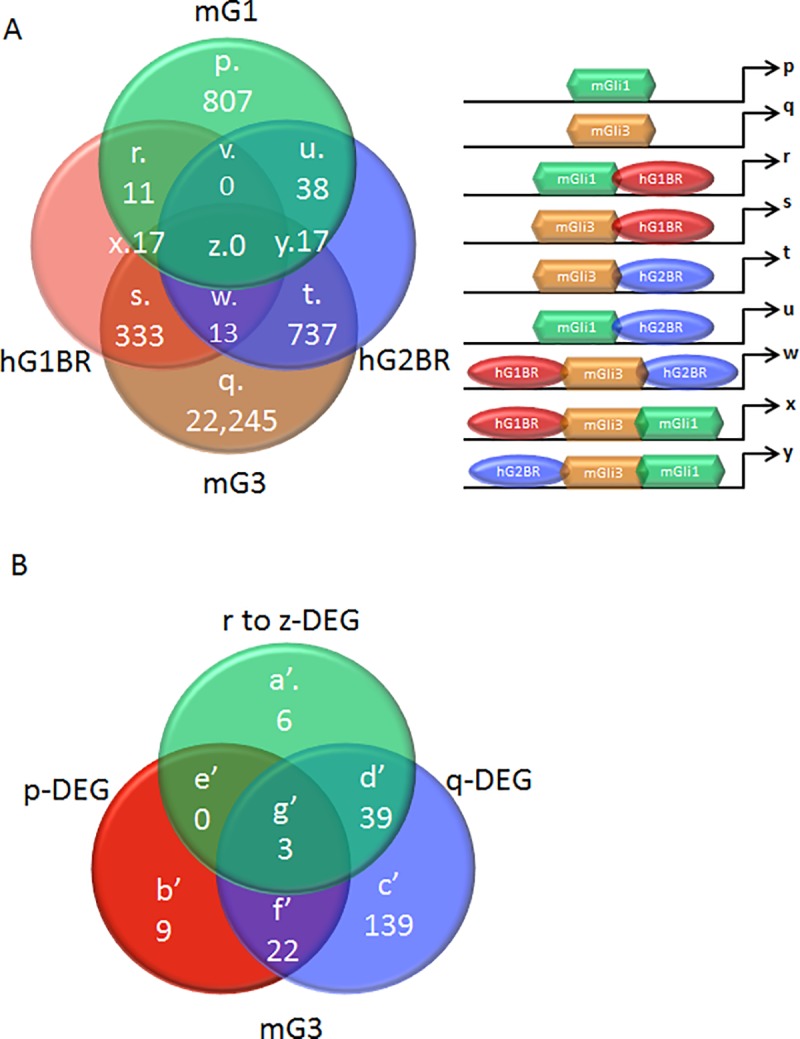
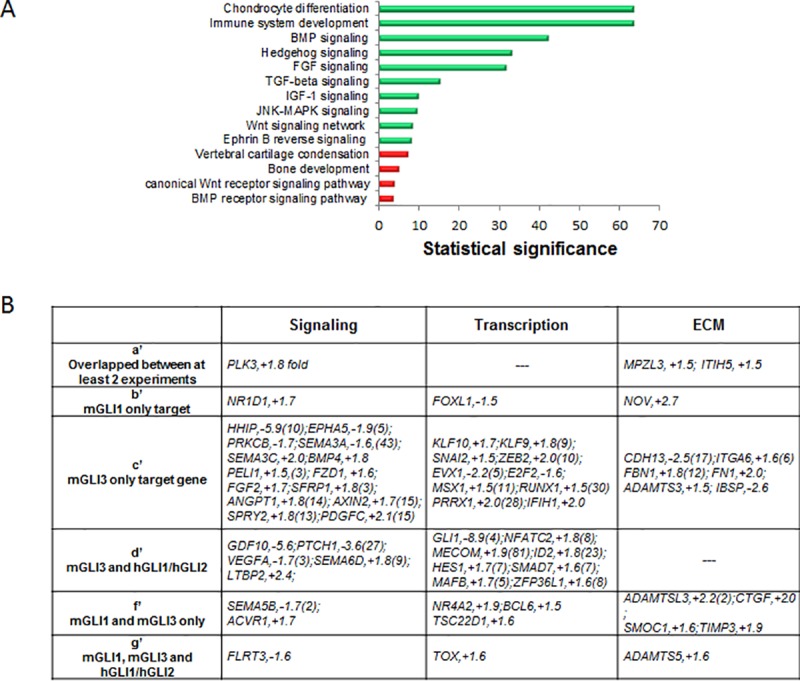
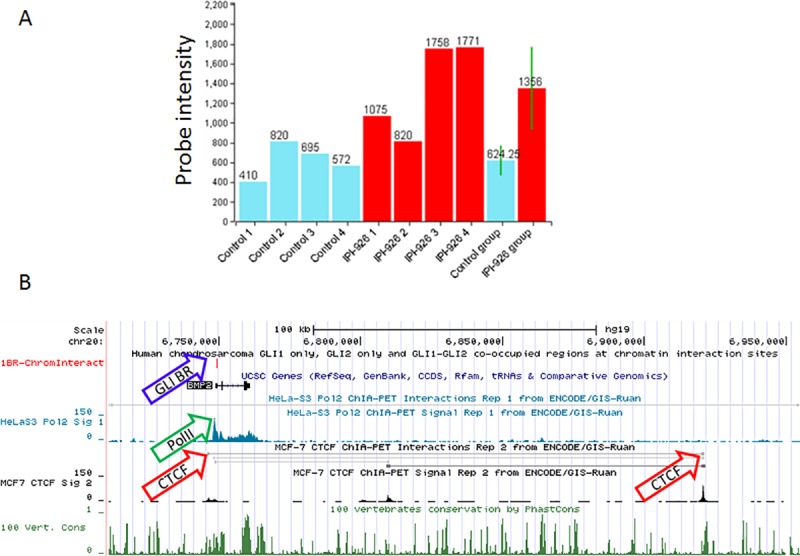
Excessive Hedgehog (Hh) signaling in chondrocytes is sufficient to cause formation of enchondroma-like lesions which can progress to chondrosarcoma. To elucidate potential underlying mechanisms, we identified GLI1 and GLI2 target genes in human chondrosarcoma. Using chromatin immunoprecipitation (ChIP) sequencing and microarray data, in silico analyses were conducted to identify and characterize unique and overlapping GLI1 and GLI2 binding regions in neoplastic chondrocytes. After overlaying microarray data from human chondrosarcoma, 204 upregulated and 106 downregulated genes were identified as Hh-responsive Gli binding targets. After overlaying published Gli ChIP-on-chip data from mouse, 48 genes were identified as potential direct downstream targets of Hedgehog signaling with shared GLI binding regions in evolutionarily conserved DNA elements. Among these was BMP2, pointing to potential cross-talk between TGF beta signaling and Hh signaling. Our identification of potential target genes that are unique and common to GLI1 and GLI2 in neoplastic chondrocytes contributes to elucidating potential pathways through which Hh signaling impacts cartilage tumor biology.


Conflict of interest statement

The authors have declared that no competing interests exist.

Figures

Fig 1
Fig 1. Characterization of GLI1 and GLI2 binding regions.
A) Identification of 10,004 GLI binding regions in the GLI1 fraction (red; G1BR), 16,334 in the GLI2 fraction (blue; G2BR) and3,701 binding regions containing both G1BR and G2BR within a 250-bp distance (purple; GIS). B) The GLI binding regions identified for GLI1 (G1BR), GLI2 (G2BR), and both (GIS) were divided based on the presence (red; GLI motif+ BR) or absence of a GLI-consensus DNA binding motif (blue; GLI motif- IBR) within 250-bp of the summit position of the GLI binding peak. C) De novo motif analysis of all GLI binding regions (G1BR, G2BR, GIS) was performed to identify potential factors which interact with GLI. Numbers in brackets indicate fold changes in gene expression of the potential associated transcription factors when Hh signaling is inhibited as determined from published microarray data. *IBR refers to binding motifs for factors which were identified in GLI binding regions that lack a GLI motif.
Fig 2
Fig 2. Unsupervised analysis of pathways and processes represented among GLI binding regions with differential gene expression.
Publically accessed microarray data were overlapped onto identified GLI binding regions (containing at least one G1BR, G2BR, or GIS) and analyzed to identify 204 upregulated genes and 106 downregulated genes. Green = upregulated. Red = downregulated.
Fig 3
Fig 3. Supervised analysis of signaling, transcription, and extracellular matrix (ECM) factors represented within categories of putative GLI transcriptional targets.
A) The 309 differentially expressed genes (DEG) which mapped onto identified GLI binding regions were separated into 7 bins (a-g) based on binding by GLI1 (G1), and/or GLI2 (G2), and/or both (GIS). B) Candidate genes were selected based on their potential to impact signaling, transcription, and expression of extracellular matrix genes that may have implications for chondrosarcoma pathogenesis.
Fig 4
Fig 4. GLI binding region co-localization with CTCF-binding regions in the human genome.
A) A total of 5,304 G1BR (set l), 1,407 GIS (set n), and 8,716 G2BR (set k) were located within 250-bp of the compiled ENCODE CTCF binding regions. B) Out of the GLI-CTCF overlapped regions, 3,943 (74%) binding regions in set l, 5,115 (58.7%) in set k, and 1,204 (85.6%) in set n harbor at least one CTCF binding consensus motif (DNA match score>65%). The consensus sequence logo reconstructed from the predicted CTCF binding sites (DNA match score>75%) resembles that of the Jaspar database record. C) Most GLI-CTCF overlapped DNA binding regions were located in non-conserved distal intergenic regions outside 2-kbp from the TSS of the nearest target gene (blue) or proximal promoter regions less than 2-kbp from the TSS (orange). Some overlapped binding regions were found in conserved distal regions (red) and proximal regions (green).
Fig 5
Fig 5. Conserved GLI binding regions in human and mouse.
A) Mouse GLI1 and GLI3 (mG1 and mG3) binding regions were compared to human GLI1 and GLI2 binding regions (hG1BR and hG2BR). The number of differentially and commonly targeted DNA sequences by GLI factors are shown, where sets p and q represent mouse-specific GLI1 and GLI3 binding regions, and sets r to z represent human-mouse conserved GLI binding regions. B) Differentially expressed genes (DEG) with putative GLI binding regions are further classified by human-mouse conservation of GLI binding region.
Fig 6
Fig 6. Unsupervised and supervised analysis of conserved GLI binding regions in human and mouse.
A) Unsupervised analysis of GO term enrichment for human-mouse conserved GLI binding regions. B) Candidate genes were selected based on their potential to impact signaling, transcription, and genes in the extracellular matrix that may have implications for chondrosarcoma pathogenesis. Letters a to g refer to the groupings shown in Fig 5B.
Fig 7
Fig 7. BMP2 regulation by Hh signaling.
A) Results from microarray data showing increased expression of BMP2 in response to Hh inhibition with IPI-926 (red; N = 4) as compared to control (blue; N = 4). The end bars represent the mean and standard deviation (P = 0.04). B) UCSC Genome Browser view of Human Feb 2009 (GRCh37/hg19) Assembly showing BMP2 with tracks for GLI binding sites (blue arrow), RNA PolII sites (green arrow), CTCF sites (red arrow), and conservation among 100 vertebrates.

References

    1. Jiang J, Hui CC. Hedgehog signaling in development and cancer. Dev Cell. 2008;15(6):801–12. 10.1016/j.devcel.2008.11.010 . - DOI - PMC - PubMed
    1. Ehlen HW, Buelens LA, Vortkamp A. Hedgehog signaling in skeletal development. Birth Defects Res C Embryo Today. 2006;78(3):267–79. 10.1002/bdrc.20076 . - DOI - PubMed
    1. Lin AC, Seeto BL, Bartoszko JM, Khoury MA, Whetstone H, Ho L, et al. Modulating hedgehog signaling can attenuate the severity of osteoarthritis. Nat Med. 2009;15(12):1421–5. 10.1038/nm.2055 . - DOI - PubMed
    1. Ali SA, Al-Jazrawe M, Ma H, Whetstone H, Poon R, Farr S, et al. Regulation of Cholesterol Homeostasis by Hedgehog Signaling in Osteoarthritic Cartilage. Arthritis Rheumatol. 2016;68(1):127–37. 10.1002/art.39337 - DOI - PMC - PubMed
    1. Ho L, Stojanovski A, Whetstone H, Wei QX, Mau E, Wunder JS, et al. Gli2 and p53 cooperate to regulate IGFBP-3- mediated chondrocyte apoptosis in the progression from benign to malignant cartilage tumors. Cancer Cell. 2009;16(2):126–36. 10.1016/j.ccr.2009.05.013 . - DOI - PubMed

Publication types

MeSH terms