. 2019 Jul;97(6):538-551.
doi: 10.1111/imcb.12239. Epub 2019 Feb 25.

Antibody opsonization enhances MAIT cell responsiveness to bacteria via a TNF-dependent mechanism

Affiliations

Antibody opsonization enhances MAIT cell responsiveness to bacteria via a TNF-dependent mechanism

Zoltán Bánki et al. Immunol Cell Biol. 2019 Jul.

Abstract

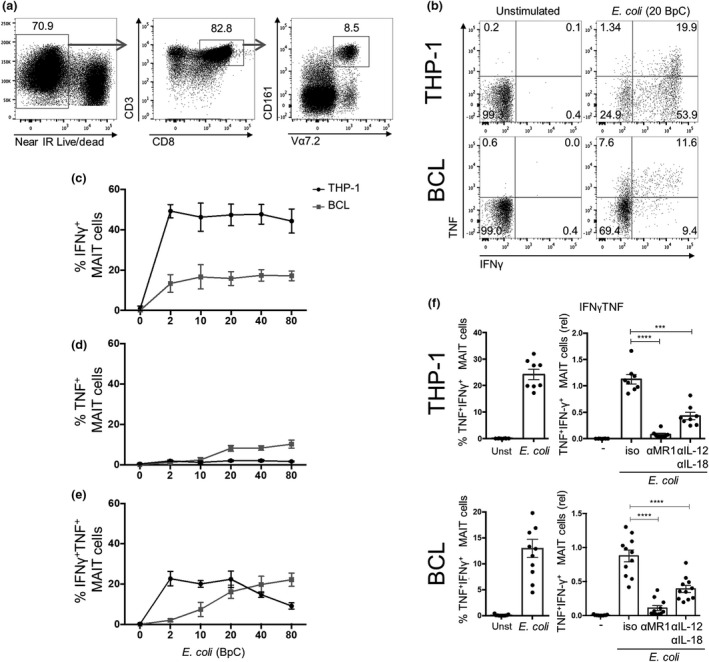
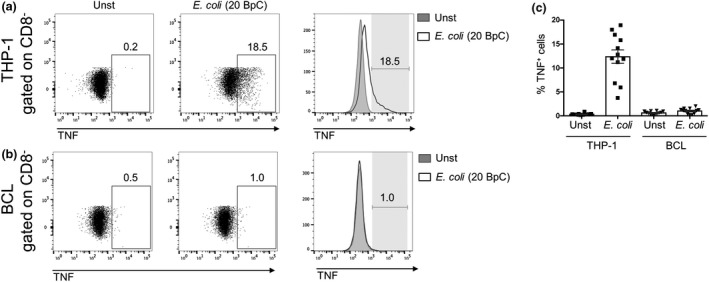
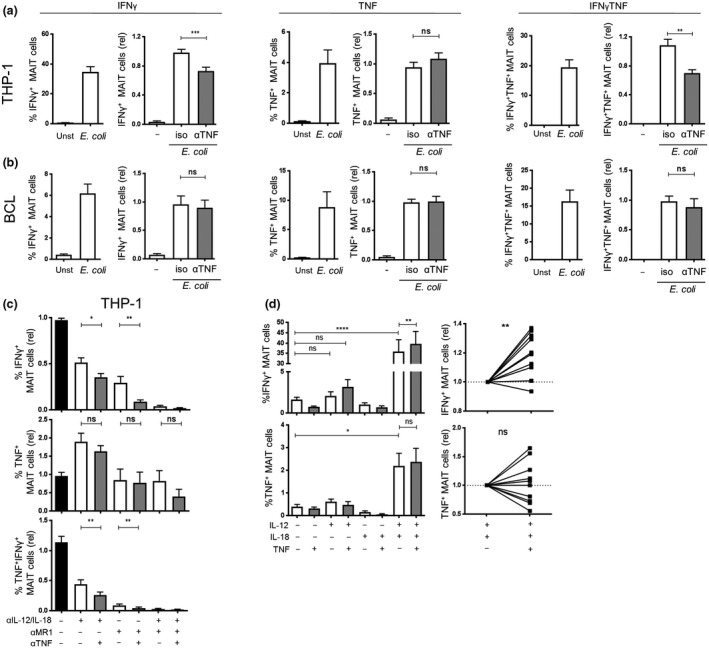
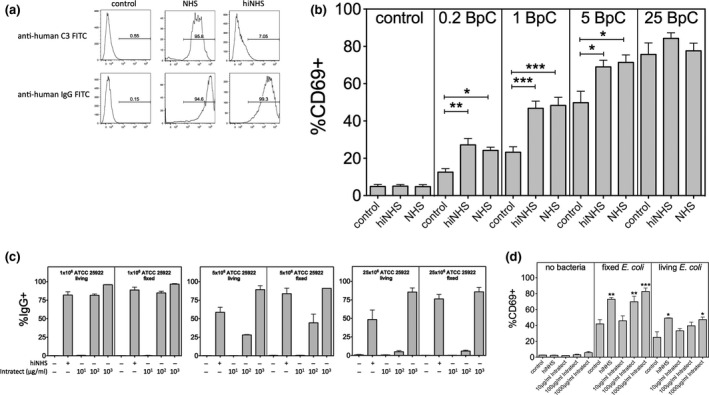
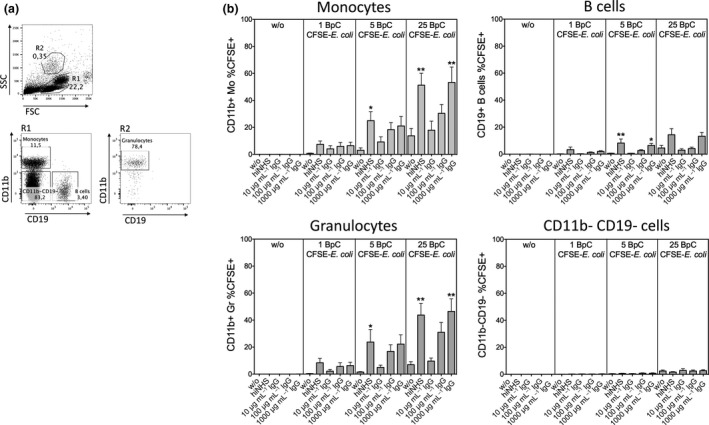
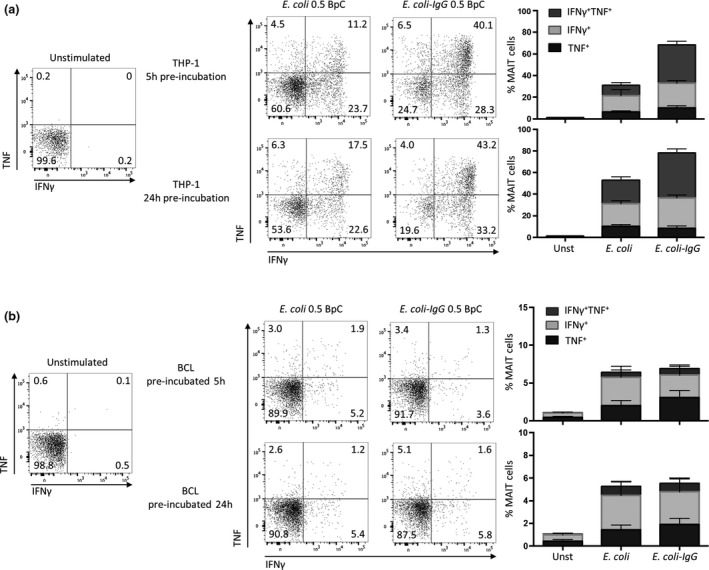
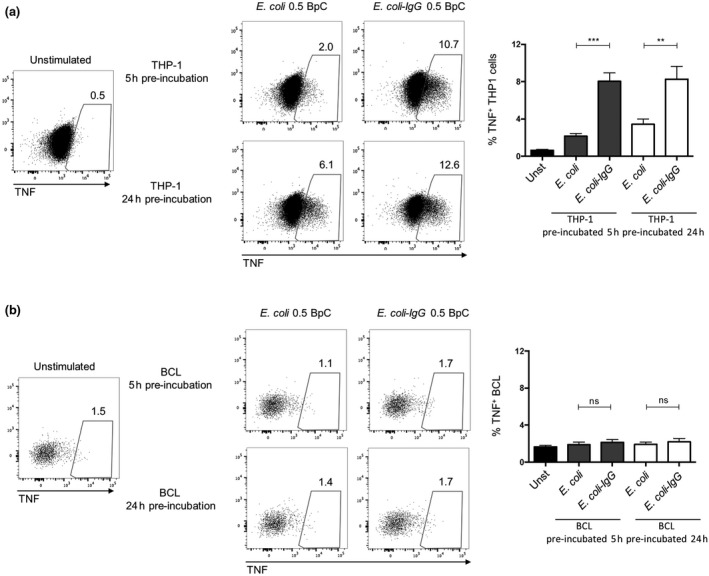
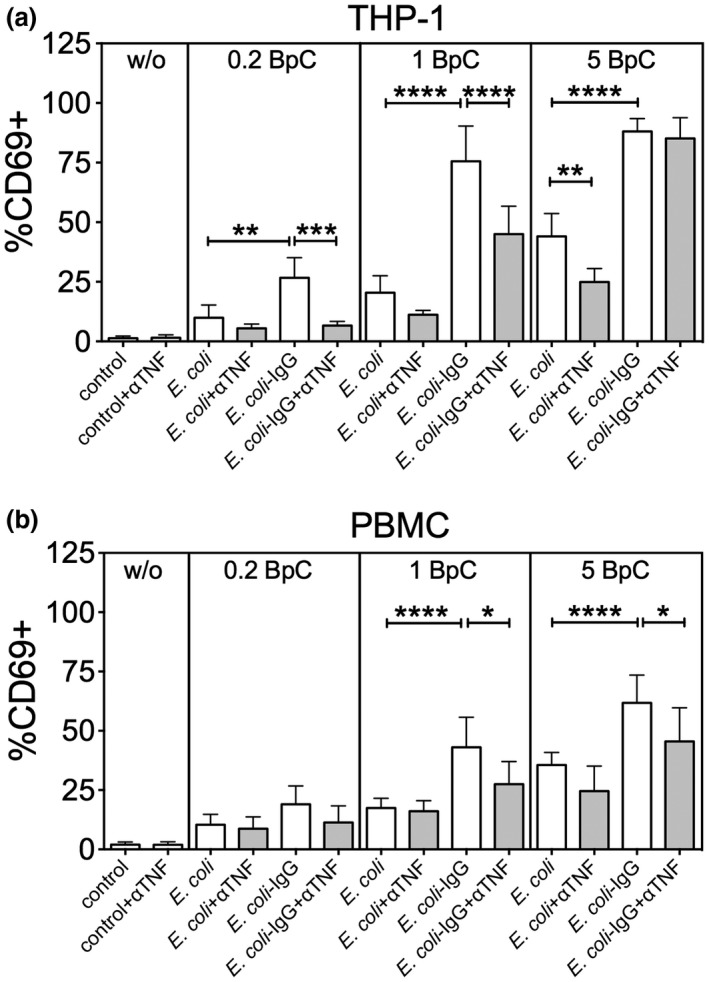
Mucosal-associated invariant T (MAIT) cells are an abundant human T-cell subset with antimicrobial properties. They can respond to bacteria presented via antigen-presenting cells (APCs) such as macrophages, which present bacterially derived ligands from the riboflavin synthesis pathway on MR1. Moreover, MAIT cells are also highly responsive to cytokines which enhance and even substitute for T-cell receptor-mediated signaling. The mechanisms leading to an efficient presentation of bacteria to MAIT cells by APCs have not been fully elucidated. Here, we showed that the monocytic cell line THP-1 and B cells activated MAIT cells differentially in response to Escherichia coli. THP-1 cells were generally more potent in inducing IFNγ and IFNγ/TNF production by MAIT cells. Furthermore, THP-1, but not B, cells produced TNF upon bacterial stimulation, which in turn supported IFNγ production by MAIT cells. Finally, we addressed the role of antibody-dependent opsonization of bacteria in the activation of MAIT cells using in vitro models. We found that opsonization had a substantial impact on downstream MAIT cell activation by monocytes. This was associated with enhanced activation of monocytes and increased TNF release. Importantly, this TNF acted in concert with other cytokines to drive MAIT cell activation. These data indicate both a significant interaction between adaptive and innate immunity in the response to bacteria, and an important role for TNF in MAIT cell triggering.

Keywords: TNF; Bacteria; E. coli; IgG-opsonization; MAIT cells; innate T cells.


Conflict of interest statement

The authors declare no conflict of interest.

Figures

Figure 1
Figure 1
THP‐1 cells and BCLs induce distinct cytokine pattern in human MAIT cells in response to Escherichia coli. (a) Gating strategy for live, TCRVα7.2+ CD161++ MAIT cells in CD8 T cells enriched from human PBMCs. Enriched CD8 T cells were co‐cultured for 20 h with THP‐1 or BCLs in the absence or presence of 20 BpC E. coli. MAIT cells were analyzed for the expression of IFNγ and TNF by intracellular cytokine staining. (b) A representative dot plot for both THP‐1 and BCL co‐cultures is shown indicating percent cytokine positive cells in quadrants. Mean ± s.e.m. of IFNγ+ (c), TNF + (d) and IFNγ+ TNF + (e) MAIT cells in co‐cultures of enriched CD8 T cells with THP‐1 cells or BCLs in the presence of different BpC E. coli is derived from eight donors pooled from two independent experiments. Blocking MR1 and IL‐12/IL‐18 signaling can diminish IFNγ+ TNF + (f) MAIT cells in co‐cultures of CD8 T cells with THP‐1 cells or BCLs in the presence of 20 BpC E. coli using isotype antibodies (iso) or blocking antibodies for MR1 (αMR1) or IL‐12/IL‐18 (αIL‐12/αIL‐18). Graphs on the left shows the absolute percentage and, on the right, the relative percentage IFNγ+ TNF + MAIT cells.
Figure 2
Figure 2
THP‐1 cells but not B cells produce TNF upon bacterial stimulation. THP‐1 cells (a) or BCLs (b) were co‐cultured with enriched CD8 T cells for 20 h in the absence (Unst) or presence of 20 BpC E. coli. THP‐1 cells or BCLs defined by gating on CD8 negative cells were analyzed for TNF expression after intracellular cytokine staining. Numbers next to gates represent percentage of positive cells. (c) Mean ± s.e.m. TNF + THP‐1 or BCLs are shown from 12 donors pooled from three independent experiments.
Figure 3
Figure 3
TNF enhances IFNγ expression of MAIT cells by THP‐1 cells but not by BCLs. Enriched CD8 T cells were co‐cultured for 20 h with THP‐1 cells (a) or BCLs (b) in the absence or presence of E. coli (20 BpC) and an isotype antibody or a TNF‐neutralizing antibody. MAIT cells were analyzed for the expression of IFNγ and TNF. Each graph on the left shows the absolute percentage of the indicated cytokine expressing MAIT cells, and each graph on the right shows the relative percentage of the indicated cytokine expressing MAIT cells after stimulation in the presence of an isotype control antibody or anti‐TNF antibody. (c) Enriched CD8 T cells were co‐cultured for 20 h with THP‐1 cells and E. coli (20 BpC), and the indicated combinations of blocking antibodies for MR1, IL‐12/IL‐18 or TNF. The percentages of MAIT cells expressing IFNγ or TNF are shown. (d) Enriched CD8 T cells were stimulated for 20 h with indicated combinations of recombinant IL‐12, IL‐18 and TNF. The graphs show the percentage (left) of MAIT cells expressing IFNγ or TNF. Right graphs show the effect of TNF on IFNγ or TNF expression of MAIT cells relative to IL‐12/IL‐18 treated cells. Data are shown as mean ± s.e.m. of 11 donors pooled from three experiments performed (for a and b), seven donors pooled from two experiments performed for c or 4–12 donors pooled from one to three experiments performed for d. *P < 0.05, **P < 0.01, ***P < 0.001, ****P < 0.0001, ns = not significant, paired t‐test (ac) or one‐way ANOVA with Sidak's multiple comparisons test (c).
Figure 4
Figure 4
IgG enhances MAIT cell activation in the presence of normal human serum. (a) Deposition of C3 and IgG molecules on formaldehyde‐fixed E. coli in the presence of normal human serum (NHS) or heat‐inactivated normal human serum (hiNHS). (b) Activation of MAIT cells by different amounts (bacteria per cell, BpC) of formaldehyde‐fixed E. coli (ATCC2592) in the presence or absence of NHS or hiNHS. Data are shown as mean ± s.e.m. of nine independent experiments. (c) Binding of IgG molecules to different amounts (1 × 106, 5 × 106 or 25 × 106) to either formaldehyde fixed or living E. coli (strain ATCC25922) in the presence or absence of hiNHS or different concentrations of purified IgG (Intratect). Data are shown as mean ± s.e.m. of two independent experiments. (d) Activation of MAIT cells by either formaldehyde‐fixed or living E. coli in the presence or absence of hiNHS or different concentrations of purified human IgG (Intratect). Data are shown as mean ± s.e.m. of four independent experiments.
Figure 5
Figure 5
Association of E. coli with monocytes, B cells and neutrophils is enhanced in the presence of both hiNHS and purified IgG. (a) Gating strategy to define different cell populations in PBMC. In SSC low gate (R1) CD11b+ cells represent monocytes and CD19+ cells are B cells. Granulocytes were defined in SSC high gate (R2) as CD11b+ cells. (b) Association of different amounts (1, 5 and 25 BpC) of formaldehyde‐fixed, CFSE‐labeled E. coli with SSC low CD11b+ monocytes, CD19+ B cells, SSC high CD11b+ granulocytes and CD11b/CD19 cells in the presence or absence of hiNHS or different concentrations of purified human IgG (Intratect). Data are shown as mean ± s.e.m. of seven donors from independent experiments.
Figure 6
Figure 6
IgG‐opsonization of E. coli enhances cytokine production of MAIT cells by THP‐1 cells, but not by BCLs. THP‐1 cells (a) or BCLs (b) were preincubated for 5 or 24 h in the absence or presence of IgG‐opsonized E. coli (E. coli‐IgG) or E. coli. Enriched CD8 T cells were co‐cultured for 20 h with preincubated THP‐1 cells or BCLs. MAIT cells, gated for as in Figure 1a, were analyzed for the expression of IFNγ or TNF. The graphs on the right show the percentages of MAIT cells expressing IFNγ or TNF. Data are representative of seven (THP‐1) or eight (BCLs) donors or shown as mean ± s.e.m. of seven (THP‐1) or eight (BCLs) donors pooled from two experiments.
Figure 7
Figure 7
IgG‐opsonization of E. coli increases TNF expression in THP‐1 cells, but not in BCLs. THP‐1 cells (a) or BCLs (b) were preincubated for 5 or 24 h in the absence or presence of IgG‐opsonized E. coli (E. coli‐IgG) or E. coli (0.5 BpC). Enriched CD8 T cells were co‐cultured for 20 h with preincubated THP‐1 cells or BCLs. THP‐1 cells or BCLs, gated for as CD8, were analyzed for the expression of TNF. **P < 0.01, ***P < 0.001, ns = not significant, one‐way ANOVA with Sidak's multiple comparisons test.
Figure 8
Figure 8
Blocking TNF reduces MAIT cell activation in the presence of both E. coli and IgG‐opsonized Ecoli. THP‐1 cells together with isolated CD8 T cells (a) or PBMCs (b) were co‐cultured with different amounts (0.2, 1 or 5 BpC) non‐opsonized or IgG‐opsonized E. coli in the presence or absence of a TNF‐neutralizing antibody (aTNF). Data are shown as mean ± s.e.m. of five (for THP‐1 cells) or seven (for PBMCs) independent experiments.

References

    1. Treiner E, Lantz O. CD1d‐ and MR1‐restricted invariant T cells: of mice and men. Curr Opin Immunol 2006; 18: 519–526. - PubMed
    1. Tilloy F, Treiner E, Park SH, et al An invariant T cell receptor alpha chain defines a novel TAP‐independent major histocompatibility complex class Ib‐restricted alpha/beta T cell subpopulation in mammals. J Exp Med 1999; 189: 1907–1921. - PMC - PubMed
    1. Huang S, Gilfillan S, Cella M, et al Evidence for MR1 antigen presentation to mucosal‐associated invariant T cells. J Biol Chem 2005; 280: 21183–21193. - PubMed
    1. Le Bourhis L, Dusseaux M, Bohineust A, et al MAIT cells detect and efficiently lyse bacterially‐infected epithelial cells. PLoS Pathog 2013; 9: e1003681. - PMC - PubMed
    1. Kurioka A, Ussher JE, Cosgrove C, et al MAIT cells are licensed through granzyme exchange to kill bacterially sensitized targets. Mucosal Immunol 2015; 8: 429–440. - PMC - PubMed

Publication types