

The herpesviral antagonist m152 reveals differential activation of STING-dependent IRF and NF-κB signaling and STING's dual role during MCMV infection
- PMID: 30696688
- PMCID: PMC6396373
- DOI: 10.15252/embj.2018100983
The herpesviral antagonist m152 reveals differential activation of STING-dependent IRF and NF-κB signaling and STING's dual role during MCMV infection
Abstract
Cytomegaloviruses (CMVs) are master manipulators of the host immune response. Here, we reveal that the murine CMV (MCMV) protein m152 specifically targets the type I interferon (IFN) response by binding to stimulator of interferon genes (STING), thereby delaying its trafficking to the Golgi compartment from where STING initiates type I IFN signaling. Infection with an MCMV lacking m152 induced elevated type I IFN responses and this leads to reduced viral transcript levels both in vitro and in vivo This effect is ameliorated in the absence of STING Interestingly, while m152 inhibits STING-mediated IRF signaling, it did not affect STING-mediated NF-κB signaling. Analysis of how m152 targets STING translocation reveals that STING activates NF-κB signaling already from the ER prior to its trafficking to the Golgi. Strikingly, this response is important to promote early MCMV replication. Our results show that MCMV has evolved a mechanism to specifically antagonize the STING-mediated antiviral IFN response, while preserving its pro-viral NF-κB response, providing an advantage in the establishment of an infection.
Keywords: STING; IRF3; NF‐κB; herpesvirus; innate immunity.
© 2019 The Authors. Published under the terms of the CC BY 4.0 license.
Conflict of interest statement
The authors declare that they have no conflict of interest.
Figures
- A
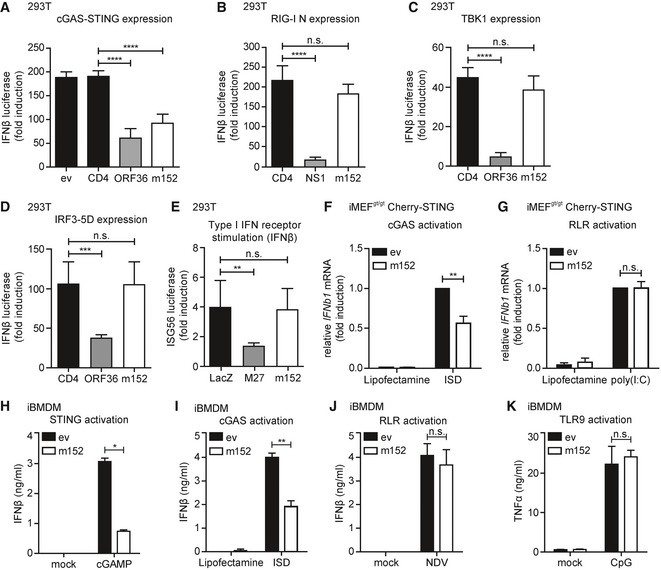
293T cells were co‐transfected with expression plasmids for Cherry‐STING, the murine IFNβ‐luciferase reporter (IFNβ‐Luc), a Renilla luciferase normalization control (pRL‐TK), and the indicated expression plasmids or empty vector (ev). Cells were additionally co‐transfected with expression plasmids for cGAS‐GFP (stimulated) or IRES‐GFP (unstimulated). 20 hours post‐transfection, cells were lysed and a dual‐luciferase assay was performed.
- B
An expression plasmid for RIG‐I N (stimulated) or ev (unstimulated) was co‐transfected with IFNβ‐Luc, pRL‐TK and the indicated expression plasmids in 293T cells and analyzed as in (A).
- C
An expression plasmid for TBK1 (stimulated) or ev (unstimulated) was co‐transfected together with IFNβ‐Luc, pRL‐TK and the indicated expression plasmids and analyzed as in (A).
- D
293T cells were co‐transfected with a plasmid expressing constitutively active IRF3 (IRF3‐5D; stimulated) or IRES‐GFP (unstimulated) together with IFNβ‐Luc, pRL‐TK and the indicated expression plasmids and analyzed as in (A).
- E
The ISG56‐luciferase reporter, pRL‐TK, and the indicated expression plasmids were co‐transfected in 293T cells. 24 hours post‐transfection, cells were stimulated with 0.1 ng/μl human IFNβ or mock stimulated and analyzed 16 h later as described in (A).
- F, G
iMEFgt/gt stably expressing Cherry‐STING and either ev or V5‐tagged m152 were stimulated with 5 μg/ml ISD (F), 10 μg/ml poly(I:C) (G), or mock stimulated with Lipofectamine. 4 hours post‐stimulation, RNA was extracted to determine IFNβ mRNA transcripts by qRT–PCR.
- H–K
iBMDM stably expressing ev or m152‐V5 were stimulated in duplicates with 10 μg/ml cGAMP (H), 5 μg/ml ISD (I), Newcastle disease virus (NDV) infection (J), or 1 μM CpG DNA (K). 6 (H) or 16 (I‐K) hours later, secreted IFNβ (H‐J) or TNFα (K) levels were determined by ELISA.
- A, B
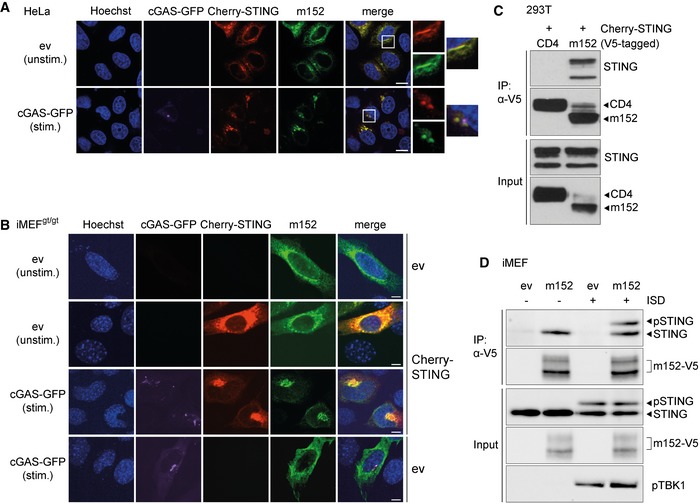
(A) HeLa cells were co‐transfected with expression plasmids for Cherry‐STING, V5‐tagged m152, and either ev (unstimulated) or cGAS‐GFP (stimulated). (B) iMEFgt/gt were co‐transfected with expression plasmids for V5‐tagged m152 together with either Cherry‐STING or ev in combination with cGAS‐GFP (stimulated) or ev (unstimulated). Twenty‐four hours post‐transfection, cells were fixed for immunolabeling with an anti‐V5 antibody. White boxes indicate the region shown at a higher magnification. Scale bar represents 10 μm.
- C
Lysates of Cherry‐STING and either CD4‐V5 or m152‐V5 expressing 293T cells were subjected to immunoprecipitation (IP) with an anti‐V5 antibody. Input and IP samples were analyzed by IB with the indicated antibodies.
- D
iMEF stably expressing ev or m152‐V5 were left unstimulated or stimulated with 10 μg/ml ISD and lysed 90 min later. m152 was immunoprecipitated with an anti‐V5 antibody, and samples were analyzed by IB with V5, STING, and phospho‐TBK1 (pTBK1)‐specific antibodies.
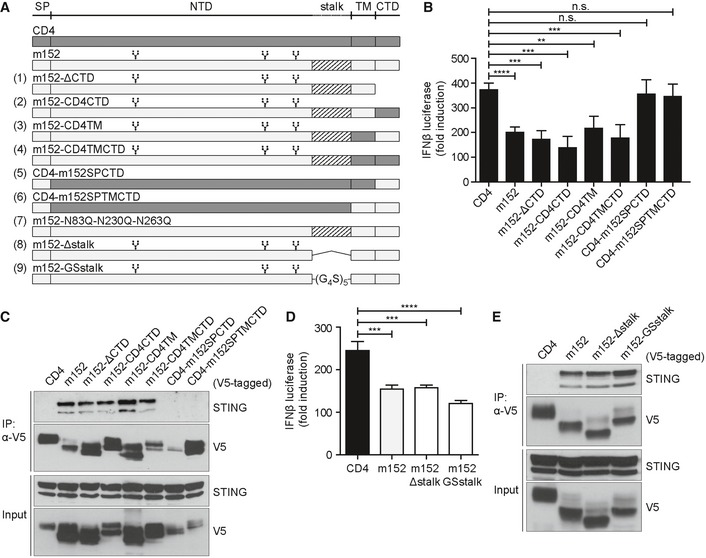
Schematic representation of wild‐type m152, wild‐type CD4, CD4‐m152 chimeric constructs, m152 glycosylation mutants, and m152 stalk mutants used in this study. CD4‐m152 chimeras (1–6): The relevant domain of m152 was replaced singly or in combination with the respective domain of murine CD4. m152 glycosylation mutant (7): asparagine (N) at position 83, 230, and 263 was mutated to glutamine (Q). m152 stalk mutants (8‐9): m152‐Δstalk has a deletion of amino acids 300‐326 (8), and for m152‐GSstalk, a glycine‐serine linker ((G4S)5) was inserted to replace the stalk region (9). SP = signal peptide, NTD = N‐terminal domain, TM = transmembrane domain, CTD = C‐terminal domain. Branched symbols represent the three glycosylation sites of m152.
Cherry‐STING, IFNβ‐Luc, pRL‐TK, cGAS‐GFP (stimulated), or IRES‐GFP (unstimulated) and indicated expression plasmids as shown in (A) were transiently expressed in 293T cells and a dual‐luciferase assay was performed. Data are combined from two out of three independent experiments and shown as mean ± SD.
293T cells were co‐transfected with expression plasmids for Cherry‐STING and indicated chimeras as shown in (A). An anti‐V5 IP was performed, and samples were analyzed by IB with indicated antibodies. IB shown is representative of three independent experiments.
Cherry‐STING, IFNβ‐Luc, pRL‐TK, and either CD4, m152, m152‐Δstalk, or m152‐GSstalk were transiently expressed in 293T cells. For stimulation, samples were co‐transfected with cGAS‐GFP, and unstimulated samples with IRES‐GFP. Lysates were analyzed as described in (B). Data are combined from two out of three independent experiments and shown as mean ± SD.
293T cells were co‐transfected with expression plasmids for Cherry‐STING and either CD4, m152, m152‐Δstalk, or m152‐GSstalk. An anti‐V5 IP was performed, and samples were analyzed by IB with indicated antibodies. Immunoblot shown is representative of three independent experiments.
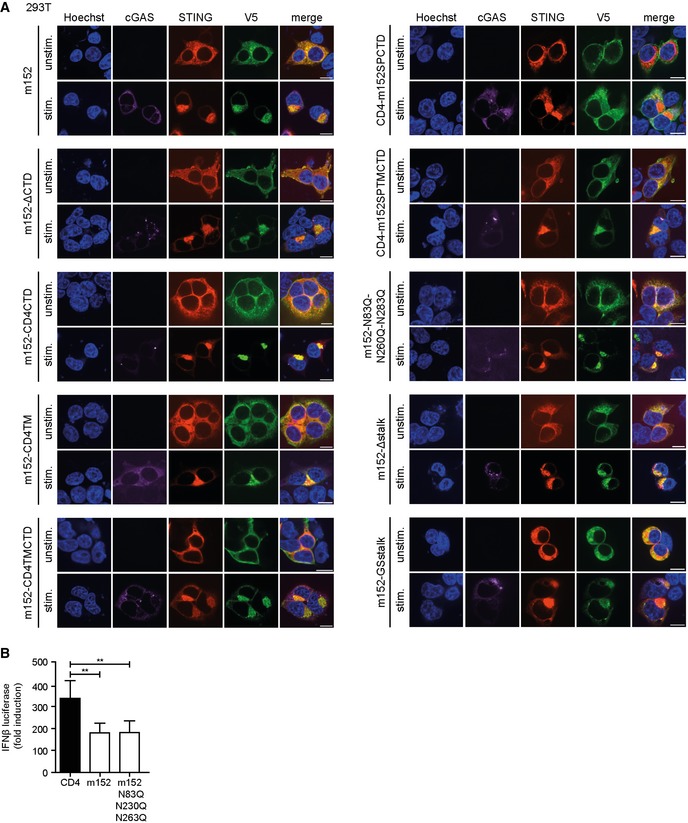
293T cells were co‐transfected with expression plasmids for Cherry‐STING, V5‐tagged m152, or the respective m152 mutant (as described in Fig 3A) and either ev (unstimulated) or cGAS‐GFP (stimulated). Twenty‐four hours post‐transfection, cells were fixed for immunolabeling with an anti‐V5 antibody. Scale bar represents 10 μm.
293T cells were co‐transfected with expression plasmids for Cherry‐STING, IFNβ‐Luc, pRL‐TK and either CD4, m152 or the m152‐N83Q‐N230Q‐N263Q mutant. For stimulation, samples were co‐transfected with cGAS‐GFP whereas unstimulated samples were co‐transfected with IRES‐GFP. A dual‐luciferase assay was performed. Data are combined from three independent experiments and shown as mean ± SD.
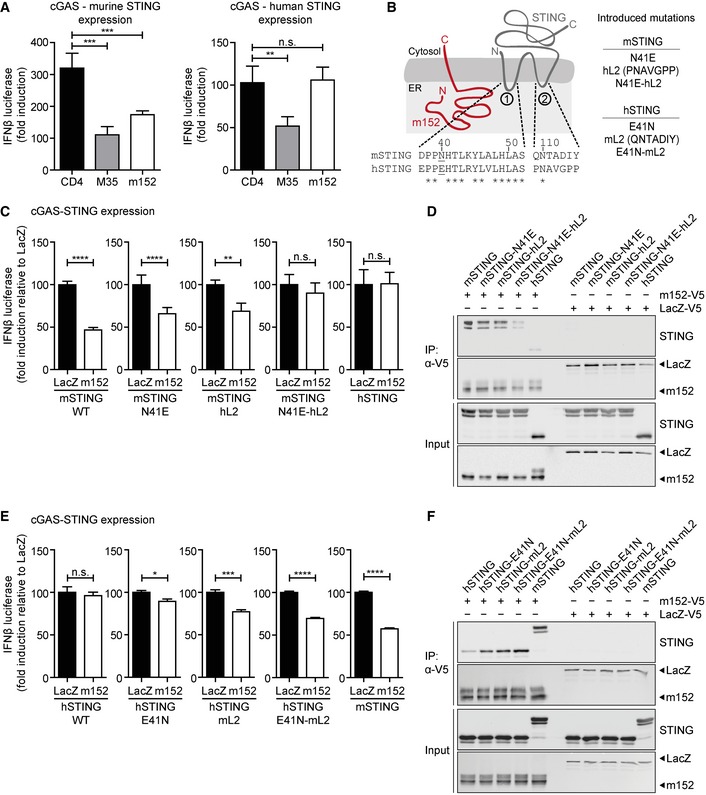
- A
293T cells were co‐transfected with expression plasmids for IFNβ‐Luc, pRL‐TK, cGAS‐GFP (stimulated), or IRES‐GFP (unstimulated) and indicated expression plasmids together with murine Cherry‐STING (left panel) or human STING (right panel). Lysates were analyzed by dual‐luciferase assay. Data are combined from two out of three independent experiments and shown as mean ± SD.
- B
Schematic representation of the predicted m152 (red) and STING (gray) topology in the ER membrane. (1) and (2) specify the ER‐luminal loop regions of STING with the sequence alignments from murine and human STING shown below. In murine STING, N41 in loop (1) was mutated to E41 and loop (2) was exchanged with loop (2) of human STING (hL2). The resultant constructs were designated mSTING N41E, mSTING hL2, and mSTING N41E‐hL2. In human STING, mutations were introduced vice versa, resulting in hSTING E41N, hSTING mL2, and hSTING E41N‐mL2.
- C
IFNβ‐Luc, pRL‐TK, cGAS‐GFP (stimulated), or IRES‐GFP (unstimulated) and either LacZ or m152 together with the indicated murine STING mutants described in (B) were transiently expressed in 293T cells. Luciferase activity was measured as described in (A).
- D
293T cells were co‐transfected with expression plasmids for either LacZ or m152 together with the indicated murine STING mutants described in (B). An anti‐V5 IP was performed, and samples were analyzed by IB with the indicated antibodies.
- E, F
Luciferase assay (E) and co‐IP (F) were performed as described in (C) and (D), respectively, using the indicated human STING mutants in place of the murine STING mutants described in (B).
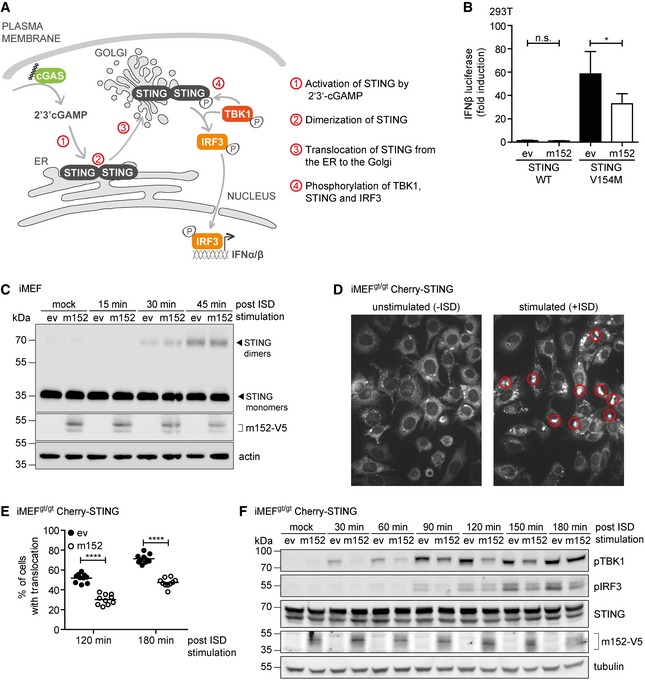
Schematic representation of the key steps in the cGAS‐STING signaling pathway.
293T cells were co‐transfected with expression plasmids for IFNβ‐Luc, pRL‐TK, and either ev or m152. Cells were further co‐transfected with either Cherry‐STING WT or the constitutively active Cherry‐STING V154M (stimulated) or with IRES‐GFP (unstimulated). Data are combined from three independent experiments and shown as mean ± SD.
iMEF stably expressing ev or m152‐V5 were stimulated with 10 μg/ml ISD for the indicated times or left unstimulated (mock). Cell lysates were analyzed by SDS–PAGE under non‐reducing conditions and subjected to IB with the specified antibodies.
Two representative still images from live cell imaging experiments with iMEFgt/gt stably expressing Cherry‐STING transfected with ISD (right panel) or left unstimulated (left panel). Red circles highlight representative translocated STING in ISD stimulated cells, which is used as an indicator of activation.
iMEFgt/gt stably expressing Cherry‐STING and either ev or m152‐V5 were stimulated with ISD. Live cell imaging was performed and STING translocation quantified 120 and 180 min post‐stimulation. Data shown are one representative of two independent experiments.
iMEFgt/gt stably expressing Cherry‐STING and V5‐tagged m152 or corresponding ev were stimulated with 5 μg/ml ISD for the indicated time or left unstimulated (mock). Lysates were subjected to IB with the specified antibodies.
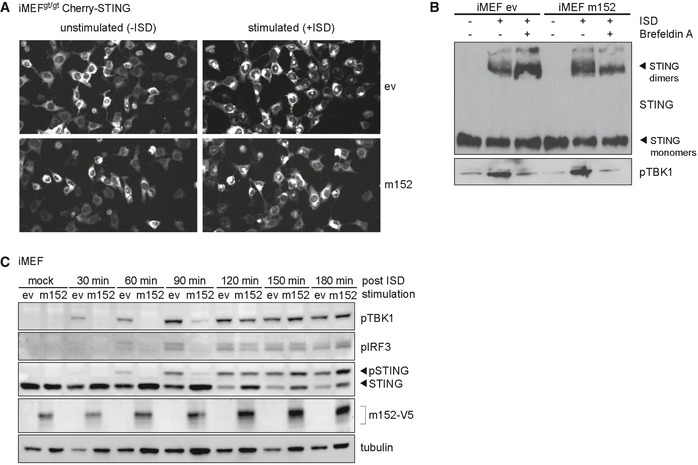
Representative still images from live cell imaging experiments with iMEFgt/gt stably expressing Cherry‐STING and either m152‐V5 or empty vector (ev) transfected with ISD for 120 min (right panel) or left unstimulated (left panel).
iMEF stably expressing m152‐V5 and respective control cells (ev) were mock stimulated or stimulated with 10 μg/ml ISD in the presence or absence of Brefeldin A. 90 min post‐stimulation, cell lysates were analyzed by SDS–PAGE under non‐reducing conditions and subjected to immunoblotting with antibodies specific to STING and phospho‐TBK1.
iMEF stably expressing V5‐tagged m152 or corresponding control cells (ev) were stimulated with 5 μg/ml ISD for the indicated time or left unstimulated (mock). Lysates were subjected to IB with the specified antibodies. IB shown are representative of two independent experiments.
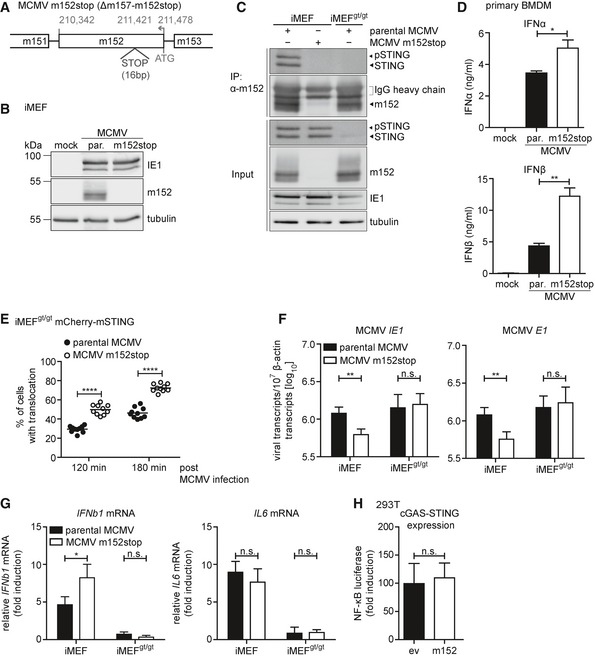
- A
Schematic representation of the recombinant MCMV m152stop virus constructed on the MCMV Δm157 backbone (here referred to as parental MCMV and MCMV m152stop for simplicity). Shown is the transcriptional coding region of m152. STOP indicates the introduced 16 base pair (bp) stop cassette.
- B
iMEF were infected by centrifugal enhancement with either parental MCMV (par.) or MCMV m152stop at an MOI of 0.5 or mock infected. Three hours post‐infection (hpi), cells were lysed and subjected to immunoblotting (IB) with the specified antibodies.
- C
iMEF and iMEFgt/gt were infected by centrifugal enhancement with parental MCMV or MCMV m152stop, or parental MCMV alone, respectively (MOI 0.5). Three hpi lysates were subjected to an anti‐m152 IP, and samples were analyzed by IB with indicated antibodies. IB shown is representative of two independent experiments.
- D
Primary BMDM were infected with parental MCMV (par.) or MCMV m152stop at an MOI of 0.1 or mock infected. At 16 hpi, secreted levels of IFNα or IFNβ were quantified by ELISA. Data are representative of two independent experiments.
- E
iMEFgt/gt stably expressing Cherry‐STING were infected with parental MCMV or MCMV m152stop (MOI 0.5). Live cell imaging was performed and STING translocation quantified 120 and 180 min post‐stimulation. Data shown are representative of two independent experiments.
- F, G
iMEF or iMEFgt/gt were infected by centrifugal enhancement with parental MCMV or MCMV m152stop (MOI 0.01). At 6 hpi, total RNA was extracted to determine MCMV IE1 and MCMV E1 (F), IFNb1 and IL6 (G) transcripts by qRT–PCR. Data shown are combined from two out of three independent experiments.
- H
293T cells were co‐transfected with Cherry‐STING, the pNF‐κB luciferase reporter, pRL‐TK, cGAS‐GFP (stimulated), or IRES‐GFP (unstimulated) and either ev or m152. Cells were lysed and analyzed as described in Fig 1. Data are combined from three independent experiments.
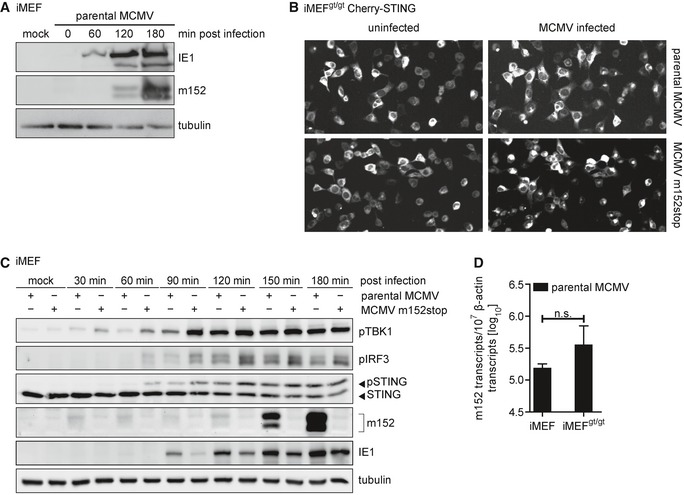
iMEF were infected by centrifugal enhancement with parental MCMV at an MOI of 0.5 or mock infected. Cells were lysed at the indicated time points, and lysates were subjected to immunoblotting with antibodies specific to the MCMV proteins immediate‐early protein 1 (IE1) and m152. Tubulin levels were determined with a tubulin antibody.
Representative still images from live cell imaging experiments with iMEFgt/gt stably expressing Cherry‐STING infected with the parental MCMV (upper panel) or MCMV m152stop (lower panel) at 120 min post‐infection.
iMEF were infected by centrifugal enhancement with parental MCMV or MCMV m152stop at an MOI of 0.1 or mock infected. Cells were lysed at the indicated time points, and lysates were subjected to immunoblotting with specified antibodies.
iMEF or iMEFgt/gt were infected by centrifugal enhancement with parental MCMV at an MOI of 0.01. Six hpi, total RNA was extracted and m152 transcript levels were determined by qRT–PCR. Data were normalized to 107 cellular β‐actin transcripts and are shown as mean ± SD.
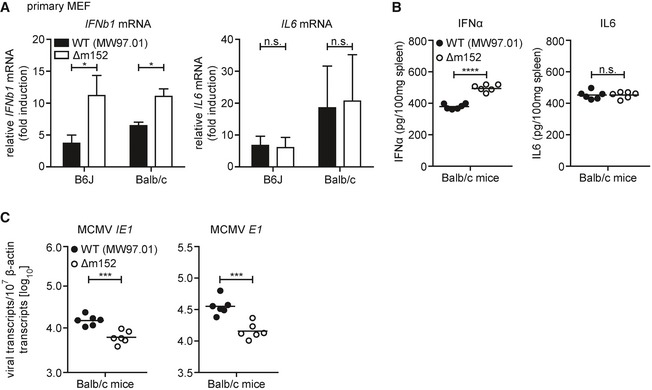
Primary MEF from B6J or Balb/c mice were infected by centrifugal enhancement with MCMV WT (MW97.01) or MCMV Δm152 at an MOI of 0.1. Four hpi total RNA was extracted to determine IFNb1 and IL6 transcripts by qRT–PCR. Data were normalized to 107 cellular β‐actin transcripts and combined from three (left panel) or two (right panel) independent experiments.
Balb/c mice were i.v. infected with 1 × 10⁶ PFU MCMV WT (MW97.01) or MCMV Δm152. IFNα (left panel) and IL‐6 (right panel) levels in spleen organ homogenates were analyzed 6 hpi by ELISA.
Balb/c mice were i.v. infected with 1 × 10⁶ PFU MCMV WT (MW97.01) or MCMV Δm152. Six hpi, RNA was extracted from spleen homogenates and MCMV IE1 (left panel) and MCMV E1 (right panel) transcript levels were determined by qRT–PCR. Data were normalized to 107 cellular β‐actin transcripts.
- A–C
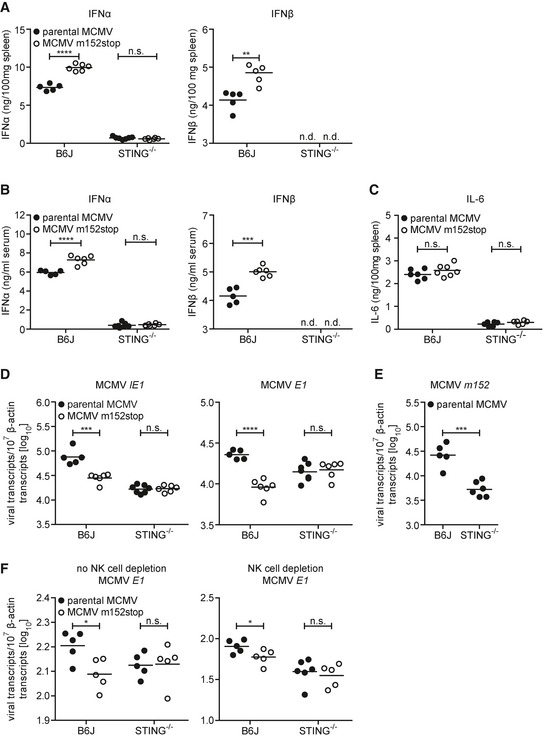
Type I IFN levels in spleen homogenates (A) and serum (B) and IL‐6 levels in spleen homogenates (C) of C57BL/6J (B6J) or STING−/− mice following i.v. infection with 4 × 10⁵ PFU parental MCMV or MCMV m152stop were analyzed 6 hpi by ELISA. IFNβ levels of STING−/− mice were below the detection limit (n.d.).
- D
B6J or STING−/− mice were i.v. infected with 4 × 10⁵ PFU parental MCMV or MCMV m152stop. Six hpi, RNA was extracted from spleen homogenates and expression of MCMV IE1 and E1 transcripts was determined by qRT–PCR.
- E
B6J or STING−/− mice were i.v. infected with 4 × 10⁵ PFU parental MCMV. Six hpi, RNA was extracted from spleen homogenates and m152 transcript levels were determined by qRT–PCR.
- F
B6J or STING−/− mice were depleted of NK cells via treatment with anti‐NK1.1 (right panel) or left untreated (left panel). One day after NK cell depletion, B6J or STING−/− mice were i.v. infected with 4 × 10⁵ PFU parental MCMV or MCMV m152stop. Sixteen hpi, RNA was extracted from spleen homogenates and MCMV E1 transcript levels were determined by qRT–PCR. Data were normalized to 107 cellular β‐actin transcripts (D–F).
- A
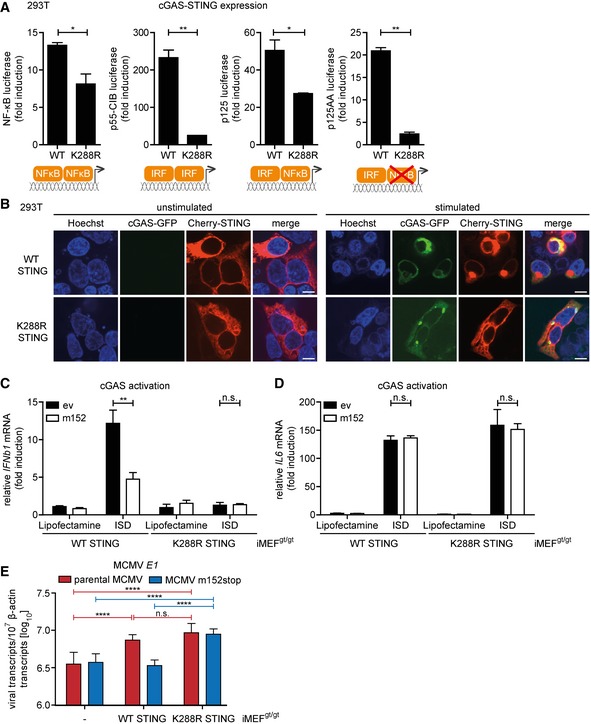
293T cells were co‐transfected with Cherry‐STING, pRL‐TK, cGAS‐GFP (stimulated), or IRES‐GFP (unstimulated) and either the pNF‐κB, p55‐CIB, p125, or p125AA luciferase reporter. Data are representative of two independent experiments.
- B
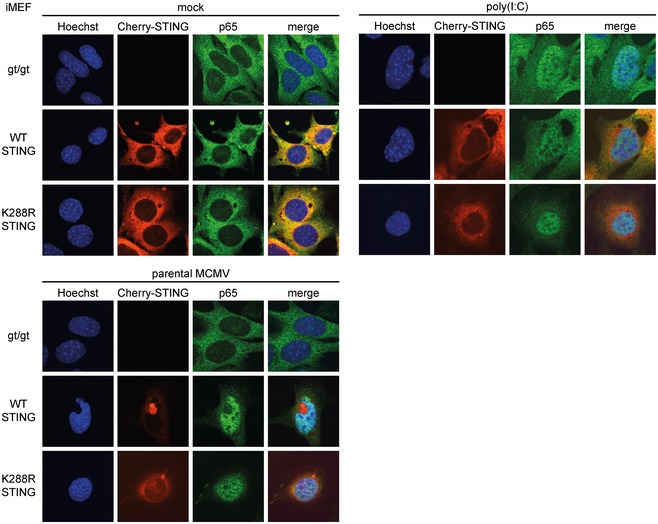
293T cells were co‐transfected with expression plasmids for cGAS‐GFP (stimulated) or ev (unstimulated) together with either cherry‐tagged WT STING or cherry‐tagged K288R STING. Cells were fixed for imaging 24 h post‐transfection. Scale bar represents 10 μm.
- C, D
iMEFgt/gt stably expressing cherry‐tagged WT STING or K288R STING and either ev or V5‐tagged m152 were stimulated with ISD (10 μg/ml) or mock stimulated. At 4 hpi, total RNA was extracted to determine IFNb1 (C) and IL6 (D) transcripts by qRT–PCR. Data shown are combined from three (C) or two (D) out of three independent experiments.
- E
iMEFgt/gt (‐) and iMEFgt/gt stably expressing either cherry‐tagged WT STING or K288R STING were infected by centrifugal enhancement with parental MCMV or MCMV m152stop (MOI 0.01). Six hpi total RNA was extracted to determine MCMV E1 transcripts by qRT–PCR. Data shown are combined from three independent experiments.
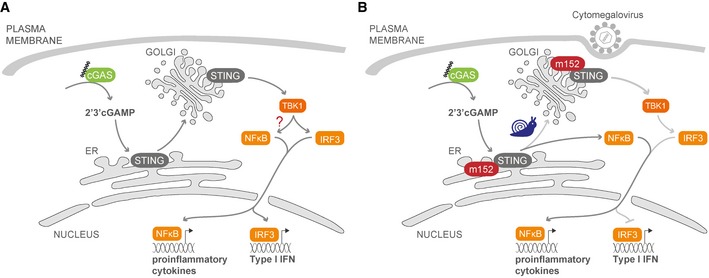
Upon stimulation with DNA or by viral infection, the pattern recognition receptor (PRR) cGAS produces the second messenger 2′3′‐cGAMP, which binds to the ER‐resident protein STING. STING then dimerizes and translocates from the ER to the Golgi, from where it activates the signaling pathway leading to induction of type I IFN via the kinase TBK1 and the IRF3 transcription factor. cGAS‐STING signaling also induces activation of the NF‐κB transcription factor, leading to proinflammatory cytokine expression, but from which subcellular compartment this signaling pathway is initiated is not understood.
The viral type I membrane protein m152 is expressed immediately after MCMV infection. m152 binds STING in the ER via their respective luminal domains and traffics with STING to the Golgi. In the presence of m152, trafficking of STING is delayed, leading to a reduced type I IFN, but intact NF‐κB, response. Mutation of K288 in STING results in a STING mutant that cannot leave the ER and thereby cannot activate the type I IFN response, but is still able to induce the NF‐κB pathway. These results suggest that STING induces the NF‐κB pathway from the ER, prior to its trafficking to the Golgi.
Similar articles
-
The murine cytomegalovirus M35 protein antagonizes type I IFN induction downstream of pattern recognition receptors by targeting NF-κB mediated transcription.PLoS Pathog. 2017 May 25;13(5):e1006382. doi: 10.1371/journal.ppat.1006382. eCollection 2017 May. PLoS Pathog. 2017. PMID: 28542326 Free PMC article.
-
STAT2-Dependent Immune Responses Ensure Host Survival despite the Presence of a Potent Viral Antagonist.J Virol. 2018 Jun 29;92(14):e00296-18. doi: 10.1128/JVI.00296-18. Print 2018 Jul 15. J Virol. 2018. PMID: 29743368 Free PMC article.
-
The Cytomegalovirus M35 Protein Directly Binds to the Interferon-β Enhancer and Modulates Transcription of Ifnb1 and Other IRF3-Driven Genes.J Virol. 2023 Jun 29;97(6):e0040023. doi: 10.1128/jvi.00400-23. Epub 2023 Jun 8. J Virol. 2023. PMID: 37289084 Free PMC article.
-
Multifaceted evasion of the interferon response by cytomegalovirus.J Interferon Cytokine Res. 2009 Sep;29(9):609-19. doi: 10.1089/jir.2009.0064. J Interferon Cytokine Res. 2009. PMID: 19708810 Free PMC article. Review.
-
The tiers and dimensions of evasion of the type I interferon response by human cytomegalovirus.J Mol Biol. 2013 Dec 13;425(24):4857-71. doi: 10.1016/j.jmb.2013.08.023. Epub 2013 Sep 5. J Mol Biol. 2013. PMID: 24013068 Free PMC article. Review.
Cited by
-
Positive Role of the MHC Class-I Antigen Presentation Regulator m04/gp34 of Murine Cytomegalovirus in Antiviral Protection by CD8 T Cells.Front Cell Infect Microbiol. 2020 Aug 26;10:454. doi: 10.3389/fcimb.2020.00454. eCollection 2020. Front Cell Infect Microbiol. 2020. PMID: 32984075 Free PMC article.
-
Memory CD8 T Cells Generated by Cytomegalovirus Vaccine Vector Expressing NKG2D Ligand Have Effector-Like Phenotype and Distinct Functional Features.Front Immunol. 2021 Jun 3;12:681380. doi: 10.3389/fimmu.2021.681380. eCollection 2021. Front Immunol. 2021. PMID: 34168650 Free PMC article.
-
The cytosolic DNA-sensing cGAS-STING pathway in neurodegenerative diseases.CNS Neurosci Ther. 2024 Mar;30(3):e14671. doi: 10.1111/cns.14671. CNS Neurosci Ther. 2024. PMID: 38459658 Free PMC article. Review.
-
In vitro and in vivo effects of 3-indoleacetonitrile-A potential new broad-spectrum therapeutic agent for SARS-CoV-2 infection.Antiviral Res. 2023 Jan;209:105465. doi: 10.1016/j.antiviral.2022.105465. Epub 2022 Nov 17. Antiviral Res. 2023. PMID: 36402240 Free PMC article.
-
Structural Models for Roseolovirus U20 And U21: Non-Classical MHC-I Like Proteins From HHV-6A, HHV-6B, and HHV-7.Front Immunol. 2022 Apr 4;13:864898. doi: 10.3389/fimmu.2022.864898. eCollection 2022. Front Immunol. 2022. PMID: 35444636 Free PMC article. Review.
References
-
- Arapovic J, Lenac Rovis T, Reddy AB, Krmpotic A, Jonjic S (2009a) Promiscuity of MCMV immunoevasin of NKG2D: m138/fcr‐1 down‐modulates RAE‐1epsilon in addition to MULT‐1 and H60. Mol Immunol 47: 114–122 - PubMed
-
- Arase H, Mocarski ES, Campbell AE, Hill AB, Lanier LL (2002) Direct recognition of cytomegalovirus by activating and inhibitory NK cell receptors. Science 296: 1323–1326 - PubMed
-
- Barton GM, Kagan JC, Medzhitov R (2006) Intracellular localization of Toll‐like receptor 9 prevents recognition of self DNA but facilitates access to viral DNA. Nat Immunol 7: 49–56 - PubMed
Publication types
MeSH terms
Substances
LinkOut - more resources
Full Text Sources
Other Literature Sources
Medical
Research Materials
