. 2019 Jan 15:9:717.
doi: 10.3389/fgene.2018.00717. eCollection 2018.

FLOating-Window Projective Separator (FloWPS): A Data Trimming Tool for Support Vector Machines (SVM) to Improve Robustness of the Classifier

Affiliations

FLOating-Window Projective Separator (FloWPS): A Data Trimming Tool for Support Vector Machines (SVM) to Improve Robustness of the Classifier

Victor Tkachev et al. Front Genet. .

Abstract

Here, we propose a heuristic technique of data trimming for SVM termed FLOating Window Projective Separator (FloWPS), tailored for personalized predictions based on molecular data. This procedure can operate with high throughput genetic datasets like gene expression or mutation profiles. Its application prevents SVM from extrapolation by excluding non-informative features. FloWPS requires training on the data for the individuals with known clinical outcomes to create a clinically relevant classifier. The genetic profiles linked with the outcomes are broken as usual into the training and validation datasets. The unique property of FloWPS is that irrelevant features in validation dataset that don't have significant number of neighboring hits in the training dataset are removed from further analyses. Next, similarly to the k nearest neighbors (kNN) method, for each point of a validation dataset, FloWPS takes into account only the proximal points of the training dataset. Thus, for every point of a validation dataset, the training dataset is adjusted to form a floating window. FloWPS performance was tested on ten gene expression datasets for 992 cancer patients either responding or not on the different types of chemotherapy. We experimentally confirmed by leave-one-out cross-validation that FloWPS enables to significantly increase quality of a classifier built based on the classical SVM in most of the applications, particularly for polynomial kernels.

Keywords: bioinformatics; gene expression; machine learning; oncology; personalized medicine; support vector machines.


Figures

FIGURE 1
FIGURE 1
Data trimming pipeline. (A) selection of relevant features in FloWPS according to the m-condition. A violet dot shows the position of a validation point. Turquoise dots stand for the points from the training dataset. The features (here: f1 and f2) are considered relevant when they satisfy the criterion that at least m flanking training points must be present on both sides relative to the validation point along the feature-specific axis. In the figure, it is exemplified that m-condition is satisfied for f1 feature when m = 0 only, and for the f2, when m ≤ 5. (B) After selection of the relevant features, only k nearest neighbors in the training sets are selected to construct the SVM model. On the figure, k = 4, although k starting from 20 was used in our calculations, to build SVM model.
FIGURE 2
FIGURE 2
Optimization of data trimming parameters m and k for a given individual. (A) Overall scheme for prediction for an individual sample i = 1, N. All but one individuals serve as a training dataset. For a training dataset at the fitting step, the AUC for a classifier prediction is calculated and plotted (B) as a function of data trimming parameters m and k. Positions of this AUC topogram where AUC > p ⋅ max(AUC), p = 0.95, are considered prediction-accountable (highlighted with bright yellow color) and form the prediction-accountable set S. This AUC topogram, as well as the set S, is individual for every validation point i.
FIGURE 3
FIGURE 3
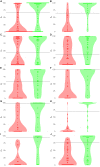
Distribution (violin plots together with each instance showed as a red/green dot) of FloWPS predictions (PF) for patients without (red plots and dots) and with (green plots and dots) positive clinical response to chemotherapy treatment. For FloWPS, core marker genes and p = 0.90 settings were used. Black horizontal line shows the discrimination threshold (τ) between responders and non-responders for each classifier. Panels represent different data sources, (A) GSE25066; (B) GSE41998; (C) GSE9782; (D) GSE39754; (E) GSE68871; (F) GSE55134; (G) TARGET-50; (H) TARGET-10; (I) and (J): TARGET-20 with and without busulfan and cyclophosphamide, respectively.
FIGURE 4
FIGURE 4
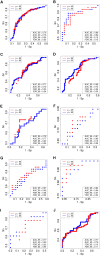
Receiver–operator curves (ROC) showing the dependence of sensitivity (Sn) upon specificity (Sp) for FloWPS-based classifier of treatment response for datasets with core marker genes. Red dots: confidence parameter p = 0.95, blue dots: p = 0.90. Panels represent different clinically annotated datasets, (A) GSE25066; (B) GSE41998; (C) GSE9782; (D) GSE39754; (E) GSE68871; (F) GSE55134; (G) TARGET-50; (H) TARGET-10; (I,J) TARGET-20 with and without busulfan and cyclophosphamide, respectively.
FIGURE 5
FIGURE 5
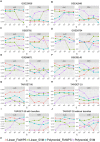
AUC and FDR for (non)responders classifier as a function of cost/penalty parameter C for classical SVM (without data trimming) and FloWPS for both linear and polynomial kernels. Calculations were done for core marker gene datasets and confidence parameter p = 0.90. Different panels represent different datasets, (A) GSE25066; (B) GSE41998; (C) GSE9782; (D) GSE39754; (E) GSE68871; (F) GSE55134; (G) TARGET-50; (H) TARGET-10; (I,J) TARGET-20 with and without busulfan and cyclophosphamide, respectively. (K) Legend showing FloWPS and SVM modifications.
FIGURE 6
FIGURE 6
(A) Global machine learning methods, such as SVM, may fail to separate classes in datasets without global order. (B) Machine-learning with data trimming works locally and may separate classes more accurately.

Similar articles

Cited by

References

    1. Ahmed F., Ansari H. R., Raghava G. P. S. (2009a). Prediction of guide strand of microRNAs from its sequence and secondary structure. BMC Bioinformatics 10:105. 10.1186/1471-2105-10-105 - DOI - PMC - PubMed
    1. Ahmed F., Kumar M., Raghava G. P. S. (2009b). Prediction of polyadenylation signals in human DNA sequences using nucleotide frequencies. In Silico Biol. 9 135–148. - PubMed
    1. Ahmed F., Kaundal R., Raghava G. P. S. (2013). PHDcleav: a SVM based method for predicting human Dicer cleavage sites using sequence and secondary structure of miRNA precursors. BMC Bioinformatics 14(Suppl. 14):S9. 10.1186/1471-2105-14-S14-S9 - DOI - PMC - PubMed
    1. Altman N. S. (1992). An introduction to kernel and nearest-neighbor nonparametric regression. Am. Stat. 46 175–185. 10.1080/00031305.1992.10475879 - DOI
    1. Amin S. B., Yip W.-K., Minvielle S., Broyl A., Li Y., Hanlon B., et al. (2014). Gene expression profile alone is inadequate in predicting complete response in multiple myeloma. Leukemia 28 2229–2234. 10.1038/leu.2014.140 - DOI - PMC - PubMed

LinkOut - more resources