

Ontogeny of vocal rhythms in harbor seal pups: an exploratory study
- PMID: 30697246
- PMCID: PMC6347067
- DOI: 10.1093/cz/zoy055
Ontogeny of vocal rhythms in harbor seal pups: an exploratory study
Abstract
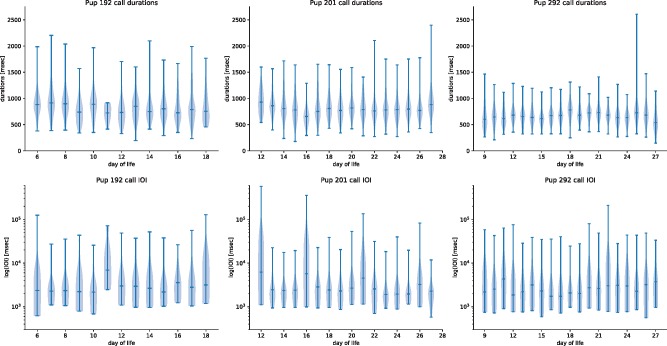
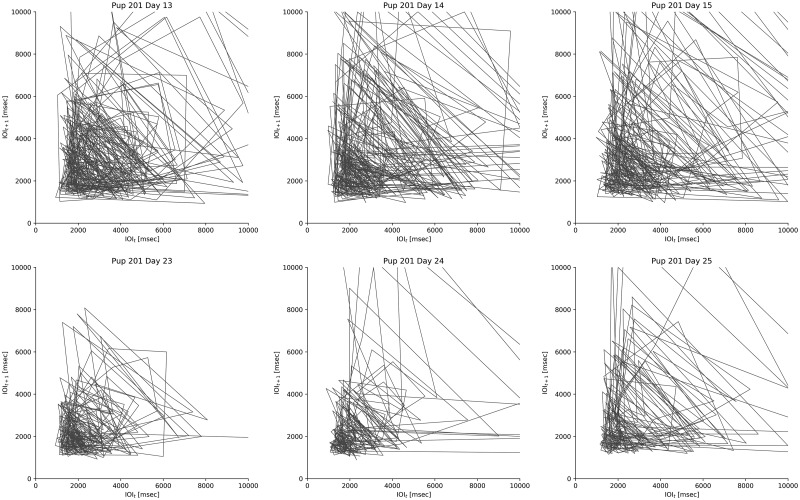
Puppyhood is a very active social and vocal period in a harbor seal's life Phoca vitulina. An important feature of vocalizations is their temporal and rhythmic structure, and understanding vocal timing and rhythms in harbor seals is critical to a cross-species hypothesis in evolutionary neuroscience that links vocal learning, rhythm perception, and synchronization. This study utilized analytical techniques that may best capture rhythmic structure in pup vocalizations with the goal of examining whether (1) harbor seal pups show rhythmic structure in their calls and (2) rhythms evolve over time. Calls of 3 wild-born seal pups were recorded daily over the course of 1-3 weeks; 3 temporal features were analyzed using 3 complementary techniques. We identified temporal and rhythmic structure in pup calls across different time windows. The calls of harbor seal pups exhibit some degree of temporal and rhythmic organization, which evolves over puppyhood and resembles that of other species' interactive communication. We suggest next steps for investigating call structure in harbor seal pups and propose comparative hypotheses to test in other pinniped species.
Keywords: bioacoustics; pinnipeds; rhythm; timing; vocal development.
Figures


Similar articles
-
Spontaneous rhythms in a harbor seal pup calls.BMC Res Notes. 2018 Jan 3;11(1):3. doi: 10.1186/s13104-017-3107-6. BMC Res Notes. 2018. PMID: 29298731 Free PMC article.
-
Vocal plasticity in harbour seal pups.Philos Trans R Soc Lond B Biol Sci. 2021 Dec 20;376(1840):20200456. doi: 10.1098/rstb.2020.0456. Epub 2021 Nov 1. Philos Trans R Soc Lond B Biol Sci. 2021. PMID: 34719248 Free PMC article.
-
Can harbor seals (Phoca vitulina) discriminate familiar conspecific calls after long periods of separation?PeerJ. 2021 Nov 15;9:e12431. doi: 10.7717/peerj.12431. eCollection 2021. PeerJ. 2021. PMID: 34820184 Free PMC article.
-
Comment on "Temporal and spatial variation in harbor seal (Phoca vitulina L.) roar calls from southern Scandinavia" [J. Acoust. Soc. Am. 141, 1824-1834 (2017)].J Acoust Soc Am. 2018 Jan;143(1):504. doi: 10.1121/1.5021770. J Acoust Soc Am. 2018. PMID: 29390742
-
Finding the Beat: From Socially Coordinated Vocalizations in Songbirds to Rhythmic Entrainment in Humans.Front Hum Neurosci. 2016 Jun 6;10:255. doi: 10.3389/fnhum.2016.00255. eCollection 2016. Front Hum Neurosci. 2016. PMID: 27375455 Free PMC article. Review.
Cited by
-
Manatee calf call contour and acoustic structure varies by species and body size.Sci Rep. 2022 Nov 15;12(1):19597. doi: 10.1038/s41598-022-23321-7. Sci Rep. 2022. PMID: 36379989 Free PMC article.
-
Isochrony in barks of Cape fur seal (Arctocephalus pusillus pusillus) pups and adults.Ecol Evol. 2024 Mar 7;14(3):e11085. doi: 10.1002/ece3.11085. eCollection 2024 Mar. Ecol Evol. 2024. PMID: 38463637 Free PMC article.
-
Mutual mother-pup acoustic identification in Asian particolored bats.Ecol Evol. 2022 Nov 22;12(11):e9554. doi: 10.1002/ece3.9554. eCollection 2022 Nov. Ecol Evol. 2022. PMID: 36440317 Free PMC article.
-
The Relevance of Ecological Transitions to Intelligence in Marine Mammals.Front Psychol. 2020 Sep 8;11:2053. doi: 10.3389/fpsyg.2020.02053. eCollection 2020. Front Psychol. 2020. PMID: 33013519 Free PMC article.
-
Measuring rhythms of vocal interactions: a proof of principle in harbour seal pups.Philos Trans R Soc Lond B Biol Sci. 2023 Apr 24;378(1875):20210477. doi: 10.1098/rstb.2021.0477. Epub 2023 Mar 6. Philos Trans R Soc Lond B Biol Sci. 2023. PMID: 36871583 Free PMC article.
References
-
- Adret P, 1992. Vocal learning induced with operant techniques: an overview. Netherlands J Zool 43:125–142.
-
- Atkinson S, 1997. Reproductive biology of seals. Rev Reprod 2:175–194. - PubMed
-
- Aubin T, Jouventin P, 1998. Cocktail-party effect in king penguin colonies. Proc Biol Sci 265:1665–1673.
LinkOut - more resources
Full Text Sources
Miscellaneous