. 2018 Nov 1;3(1):69-90.
doi: 10.1210/js.2018-00140. eCollection 2019 Jan 1.

Prolonged Exposure to Insulin Inactivates Akt and Erk1/2 and Increases Pancreatic Islet and INS1E β-Cell Apoptosis

Affiliations

Prolonged Exposure to Insulin Inactivates Akt and Erk1/2 and Increases Pancreatic Islet and INS1E β-Cell Apoptosis

Nadia Rachdaoui et al. J Endocr Soc. .

Abstract

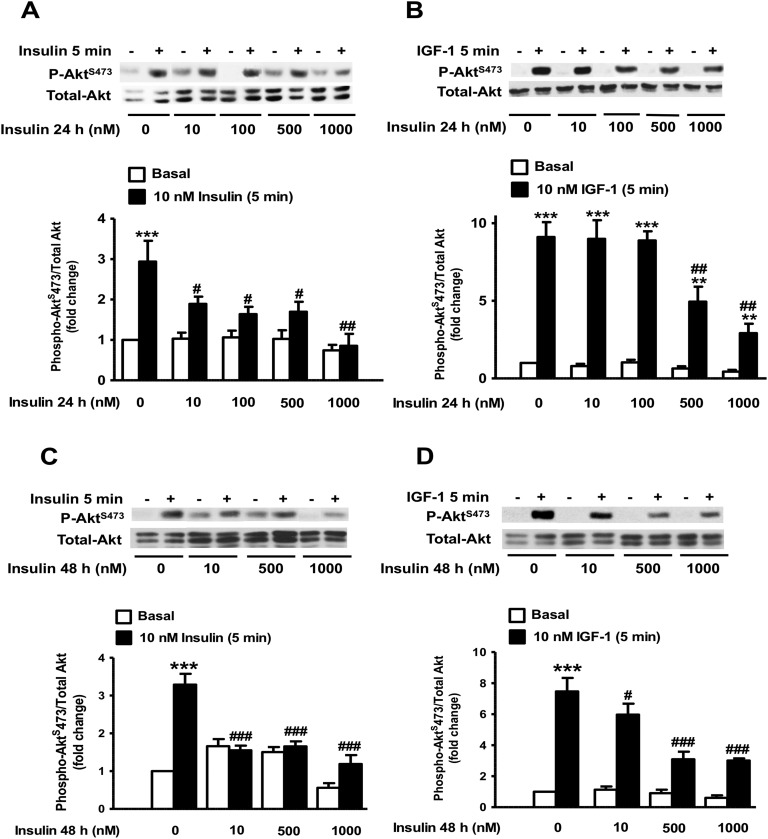
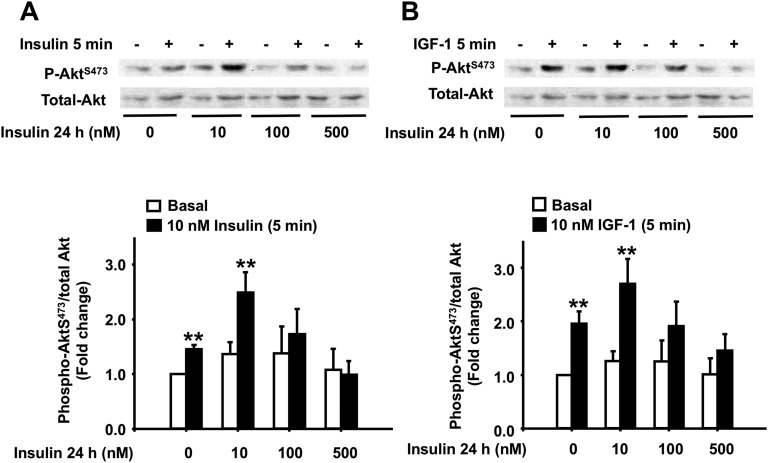
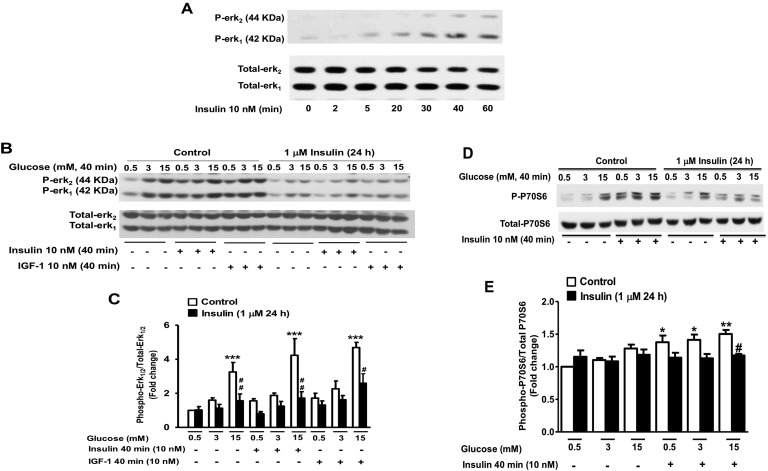
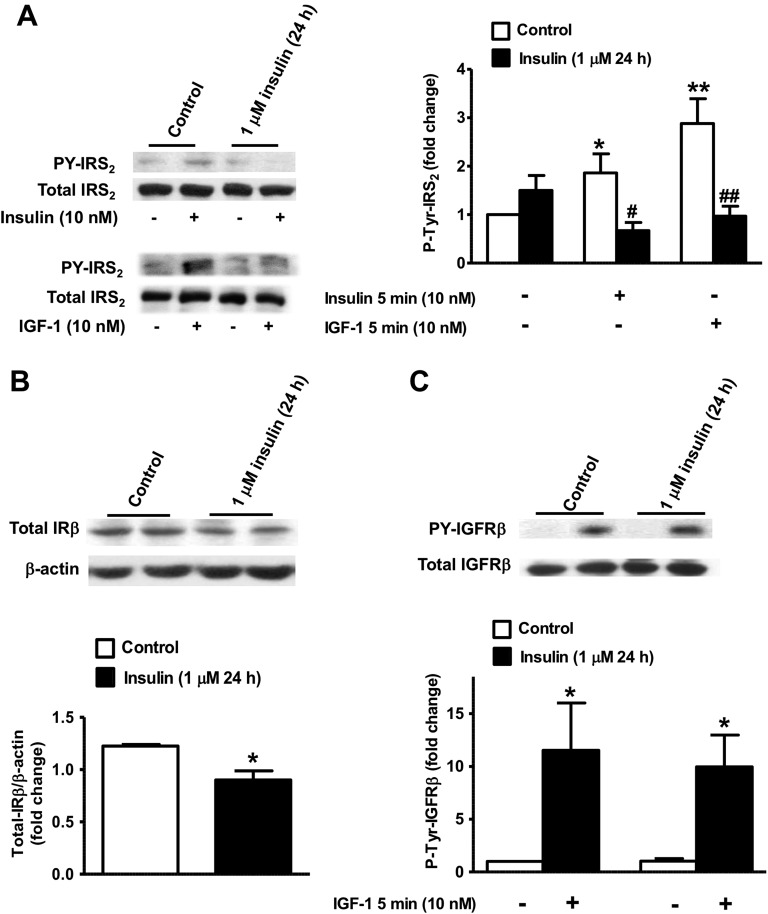
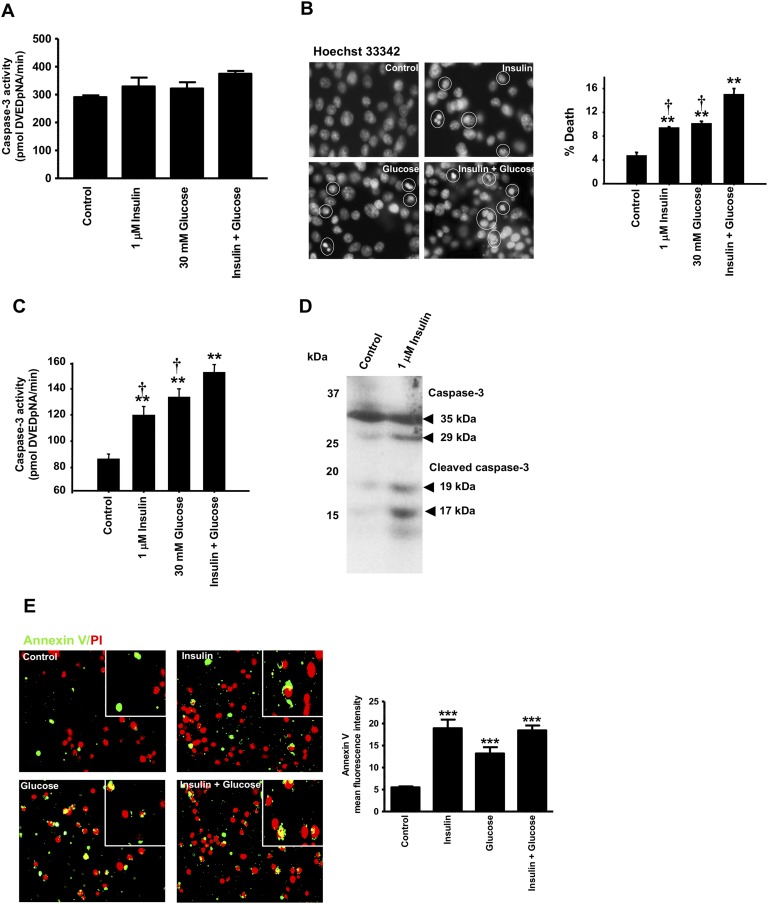
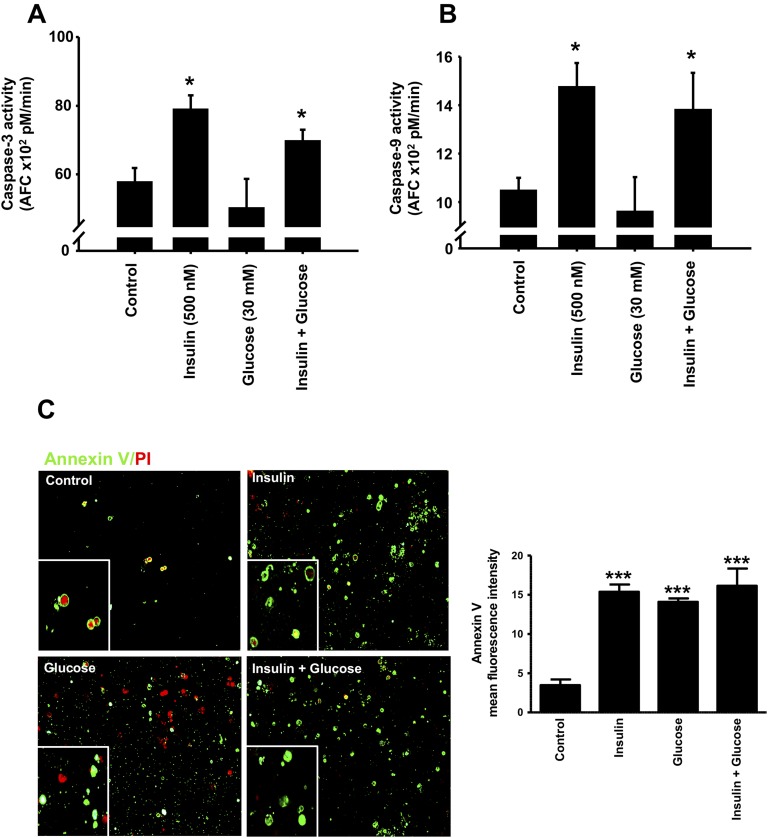
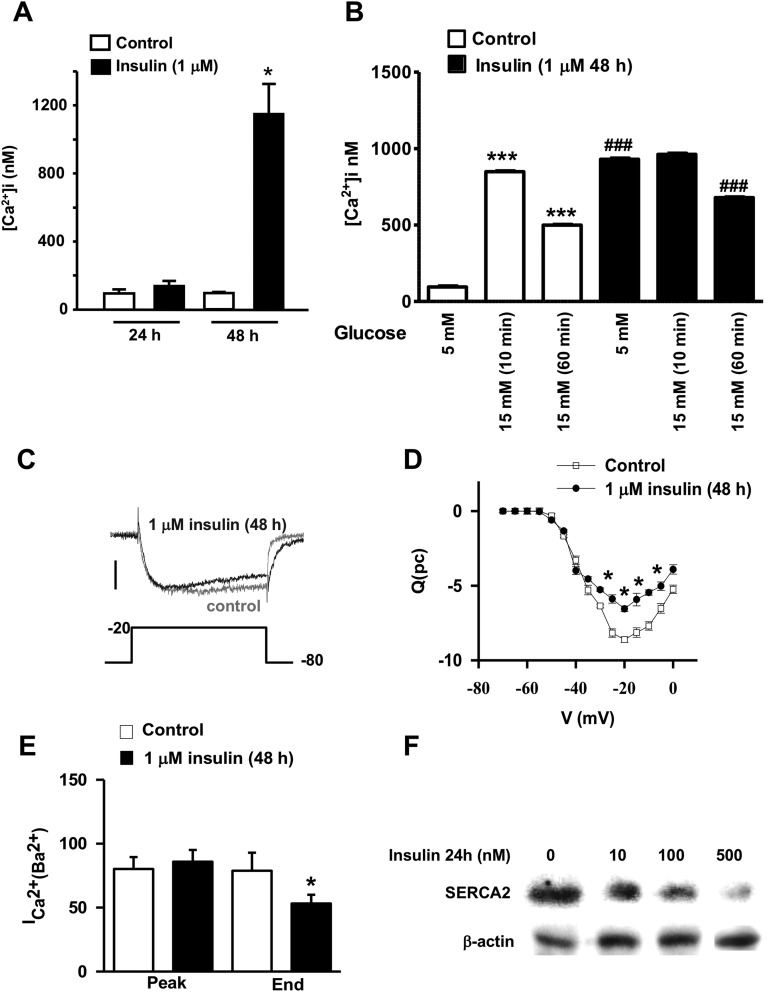
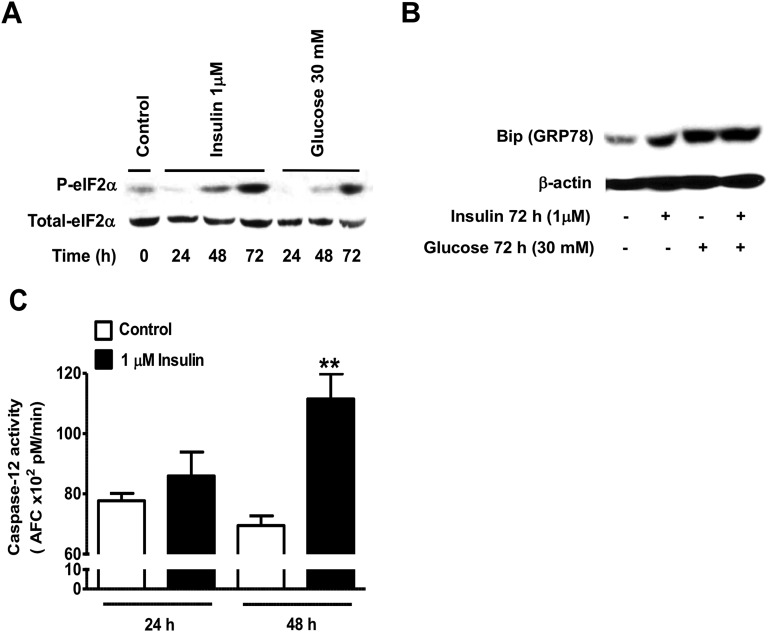
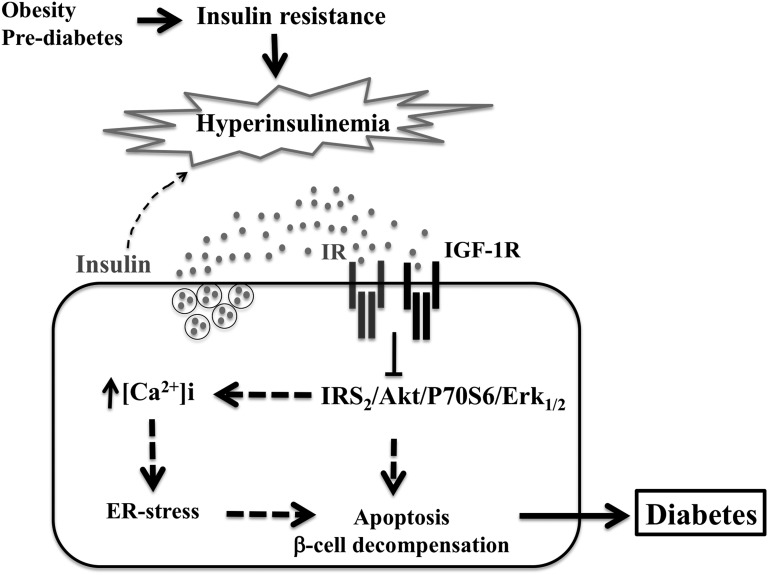
Chronic hyperinsulinemia, in vivo, increases the resistance of peripheral tissues to insulin by desensitizing insulin signaling. Insulin, in a heterologous manner, can also cause IGF-1 resistance. The aim of the current study was to investigate whether insulin-mediated insulin and IGF-1 resistance develops in pancreatic β-cells and whether this resistance results in β-cell decompensation. Chronic exposure of rat islets or INS1E β-cells to increasing concentrations of insulin decreased AktS473 phosphorylation in response to subsequent acute stimulation with 10 nM insulin or IGF-1. Prolonged exposure to high insulin levels not only inhibited AktS473 phosphorylation, but it also resulted in a significant inhibition of the phosphorylation of P70S6 kinase and Erk1/2 phosphorylation in response to the acute stimulation by glucose, insulin, or IGF-1. Decreased activation of Akt, P70S6K, and Erk1/2 was associated with decreased insulin receptor substrate 2 tyrosine phosphorylation and insulin receptor β-subunit abundance; neither IGF receptor β-subunit content nor its phosphorylation were affected. These signaling impairments were associated with decreased SERCA2 expression, perturbed plasma membrane calcium current and intracellular calcium handling, increased endoplasmic reticulum stress markers such as eIF2α S51 phosphorylation and Bip (GRP78) expression, and increased islet and β-cell apoptosis. We demonstrate that prolonged exposure to high insulin levels induces not only insulin resistance, but in a heterologous manner causes resistance to IGF-1 in rat islets and insulinoma cells resulting in decreased cell survival. These findings suggest the possibility that chronic exposure to hyperinsulinemia may negatively affect β-cell mass by increasing β-cell apoptosis.

Keywords: ER-stress; hyperinsulinemia; insulin/IGF-1 signaling; islet and β-cell apoptosis.


Figures

Figure 1.
Figure 1.
Effect of prolonged exposure to insulin on the acute insulin and IGF-1 phosphorylation of Akt in INS1E β-cells. (A–D) INS1E β-cells were treated with the indicated concentrations of insulin for 24 or 48 h, then exposed to 10 nM insulin (A and C) or 10 nM IGF-1 (B and D) for 5 min. Phospho-AktS473 was measured by Western blot using specific antibodies in whole-cell lysates and normalized to total Akt. Data are presented as fold change over the basal nontreated cells. Representative autoradiograms are shown. Means ± SEM are from four to nine independent experiments. **P < 0.005, ***P < 0.0005, comparing 10 nM insulin or 10 nM IGF-1 to basal; #P < 0.05, ##P < 0.005, ###P < 0.0005, comparing chronic insulin to control cells.
Figure 2.
Figure 2.
Effect of prolonged exposure to insulin on the acute insulin and IGF-1 phosphorylation of Akt in rat pancreatic islets. (A and B) Cultured rat isolated islets were treated with the indicated concentrations of insulin for 24 h, then exposed to 10 nM insulin (A) or 10 nM IGF-1 (B) for 5 min. Phospho-Akt S473 was measured by Western blot using specific antibodies in whole-cell lysates and normalized to total Akt. Data are presented as fold change over the basal nontreated islets. Representative autoradiograms are shown. Means ± SEM are from four independent experiments. **P < 0.005.
Figure 3.
Figure 3.
Effect of prolonged exposure to insulin on the acute glucose, insulin, and IGF-1 phosphorylation of Erk1/2 and P70S6K in INS1E β-cells. (A) Time course of Erk1/2 phosphorylation in response to the stimulation by 10 nM insulin. (B–E) INS1E β-cells were treated with 1 μM insulin for 24 h and then exposed to increasing concentrations of glucose (0.5, 3, and 15 mM) alone or in combination with 10 nM insulin or 10 nM IGF-1 for 40 min. Phospho-Erk1/2 (B and C) and phospho-P70S6K (D and E) were measured by Western blot using specific antibodies in whole-cell lysates and normalized to total Erk1/2 and total P70S6K. A representative autoradiogram of four to six independent experiments is shown. *P < 0.05, **P < 0.005, ***P < 0.0005, 15 mM glucose, 10 nM insulin, or IGF-1 compared with basal; #P < 0.05, ##P < 0.005, chronic insulin treatment compared with control nontreated.
Figure 4.
Figure 4.
Effect of prolonged exposure to insulin on the acute insulin and IGF-1 activation of IRS2, IRβ, and IGFRβ in INS1E β-cells. INS1-E β-cells were treated for 24 h with 1 μM insulin then exposed for 5 min to 10 nM insulin or 10 nM IGF-1. (A) Left: representative anti-IRS2 autoradiograms of phospho-tyrosine IRS2 measured in phospho-tyrosine immunoprecipitates and of total IRS2 in whole-cell lysates. Right: IRS2 tyrosine phosphorylation was measured by Western blot using an anti-IRS2–specific antibody in immunoprecipitates. Data are presented as fold change to basal nontreated cells. (B) Total IR content was analyzed in whole-cell lysates using an anti-IRβ antibody and intensity was normalized to β-actin. (C) Tyrosine phosphorylated IGFRβ was measured in phospho-tyrosine immunoprecipitates using anti-IGFRβ and presented as fold change to basal nontreated cells. Total IGFRβ was analyzed in whole-cell lysates. Means ± SEM are from three to five independent experiments. *P < 0.05, **P < 0.005, 10 nM insulin or 10 nM IGF-1 in control compared with basal nontreated cells; #P < 0.05, ##P < 0.005, chronic insulin compared with control nontreated.
Figure 5.
Figure 5.
Effect of prolonged exposure to insulin, glucose, or their combination on INS1E β-cell apoptosis. (A–E) INS1E β-cells were treated for 24 h (A) or 72 h (B–E) with 1 μM insulin, 30 mM glucose, or 1 μM insulin plus 30 mM glucose. (A) Caspase-3 activity assay using DEVD-pNA was measured. Results are expressed as picomoles DEVD-pNA/min. (B) DNA fragmentation analysis was determined by Hoechst 33342 staining at ×20 original magnification. Representative images and quantitative measure of cells with fragmented DNA or condensed chromatin are shown. (C) Caspase-3 activity assay using DEVD-pNA was measured after 72-h treatment with insulin, glucose, or their combination. Results are expressed as picomoles DEVD-pNA/min. (D) Immunoblotting for cleaved caspase-3 in control and insulin-treated cells. A representative autoradiogram of three independent experiments is shown. (E) INS1E β-cells in suspension were stained with annexin V and propidium iodide and visualized using a fluorescence microscope at ×20 original magnification. The mean fluorescence intensity was measured using ImageJ. Means ± SEM are from three to four independent experiments with each done in duplicates. **P < 0.005, ***P < 0.0005, chronic insulin, glucose, or their combination compared with control nontreated cells; P < 0.05 compared with insulin plus glucose treated cells.
Figure 6.
Figure 6.
Effect of prolonged exposure to insulin on apoptosis in rat pancreatic islets. Islets were treated for 72 h with 500 nM insulin, 30 mM glucose, or insulin plus glucose, and caspase-3 (A) and caspase-9 (B) activities were measured using fluorometric substrates (DEVD-AFC and LEHD-AFC, respectively). Results are expressed as picomoles of FCA/min. (C) Annexin V staining of dispersed islet cells was measured using an annexin V Alexa Fluor 488 conjugate using a fluorescence microscope at ×20 original magnification and mean fluorescence intensity was measured using ImageJ. Means ± SEM are from four independent experiments with each done in duplicates. *P < 0.05, ***P < 0.0005, chronic insulin, glucose, or insulin plus glucose compared with control nontreated cells.
Figure 7.
Figure 7.
Effect of prolonged exposure to insulin on [Ca2+]i, total calcium current (ICa2+), and SERCA2 protein. (A and B) INS1E β-cells cultured on glass coverslips were loaded with fura-2–PE3 (2 µmol/L) and Mag–fluo-4-AM (1 μM), respectively (Molecular Probes, Eugene, OR). Pluronic acid (0.01%) was added to the medium and cells were incubated for 30 min at 37°C. [Ca2+]i was measured using an Olympus IX-50 inverted epifluorescence microscope (Olympus, Tokyo, Japan). Absolute [Ca2+]i was determined from R of Ca2+-bound fura-2 (excited at 340 nm) to unbound fura-2 (excited at 380 nM). The Ca2+ levels were determined using a standard equation for calibration. Rmax and Rmin were obtained by adding ionomycin (10 µM) or EGTA (1 mM), respectively, to fura-2–loaded β-cells at the end of each experiment. [Ca2+]i was obtained using an excitation wavelength of 488 nm and an emission band-pass filter of 515/15 nm. Means ± SEM are from four independent experiments. The ICa2+ (Ba2+) from control and insulin pretreated cells for 48 h were evoked by a 100 msec step depolarization under whole-cell voltage clamp configuration. *P < 0.05, chronic insulin (48 h) compared with chronic insulin (24 h); ***P < 0.0005, 15 mM glucose (10 and 60 min control) compared with 5 mM basal; ###P < 0.0005, chronic insulin compared with control nontreated cells. (C) Representative two typical traces at the maximal current (−20 mV) from control (gray) and insulin-pretreated cells (1 μM, 48 h) (black). (D) Average integrated current (C)–voltage (V) relationships. Data represent means ± SEM from control (□, n = 18) or insulin-treated cells (●, n=6). (E) Quantification of the magnitude of the peak of the calcium current and the end of the voltage step (95 msec) of the maximal current (determined by the correspondent Influx-Voltage relationship for each cell tested, usually about −20 mV). *P < 0.05, compared with control nontreated cells. (F) Islets were treated with the indicated concentrations of insulin for 24 h, and then the expression of the ER-Ca2+-ATPase SERCA2 was analyzed by Western blot using a specific antibody in islet whole-cell lysates. A representative autoradiogram of four independent experiments is shown.
Figure 8.
Figure 8.
Effect of prolonged exposure to high insulin levels on ER stress markers. (A and B) INS1E β-cells were treated with the indicated concentrations of insulin or glucose for 24, 48, or 72 h and then ER stress markers such as eIF2α (A) and Bip (B) were measured by immunoblot in whole-cell lysates using specific antibodies. The activity of the ER stress–activated caspase-12 was also quantified using the fluorometric substrate LEHD-AFC and results are expressed as picomoles of FCA/min (C). Means ± SEM are from four independent experiments with each done in duplicates. *P < 0.05, compared with control nontreated cells.
Figure 9.
Figure 9.
Chronic exposure to hyperinsulinemia participates in pancreatic β-cell decompensation. In conditions of insulin resistance and increased insulin secretion in the vicinity of pancreatic β-cells, such as in obesity and prediabetes, chronic exposure of pancreatic β-cells to insulin might induce insulin and IGF-1 resistance and inhibition of IRS2/Akt/P70S6K and IRS2/ERk1/2 activation. Because these pathways play an important role in pancreatic β-cell survival, inhibition of Akt and Erk1/2 could result in increased islet and β-cell death through both mitochondrial and calcium-sensitive ER stress apoptotic pathways and therefore lead to pancreatic β-cell decompensation and the progression of diabetes.

Similar articles

Cited by

References

    1. Chiasson JL, Rabasa-Lhoret R. Prevention of type 2 diabetes: insulin resistance and beta-cell function. Diabetes. 2004;53(Suppl 3):S34–S38. - PubMed
    1. Shanik MH, Xu Y, Skrha J, Dankner R, Zick Y, Roth J. Insulin resistance and hyperinsulinemia: is hyperinsulinemia the cart or the horse? Diabetes Care. 2008;31(Suppl 2):S262–S268. - PubMed
    1. Lin X, Taguchi A, Park S, Kushner JA, Li F, Li Y, White MF. Dysregulation of insulin receptor substrate 2 in β cells and brain causes obesity and diabetes. J Clin Invest. 2004;114(7):908–916. - PMC - PubMed
    1. Otani K, Kulkarni RN, Baldwin AC, Krutzfeldt J, Ueki K, Stoffel M, Kahn CR, Polonsky KS. Reduced β-cell mass and altered glucose sensing impair insulin-secretory function in βIRKO mice. Am J Physiol Endocrinol Metab. 2004;286(1):E41–E49. - PubMed
    1. Kulkarni RN, Holzenberger M, Shih DQ, Ozcan U, Stoffel M, Magnuson MA, Kahn CR. β-Cell-specific deletion of the Igf1 receptor leads to hyperinsulinemia and glucose intolerance but does not alter β-cell mass. Nat Genet. 2002;31(1):111–115. - PubMed

LinkOut - more resources