

Understanding Material Characteristics through Signature Traits from Helium Pycnometry
- PMID: 30698443
- PMCID: PMC6594170
- DOI: 10.1021/acs.langmuir.8b03731
Understanding Material Characteristics through Signature Traits from Helium Pycnometry
Abstract
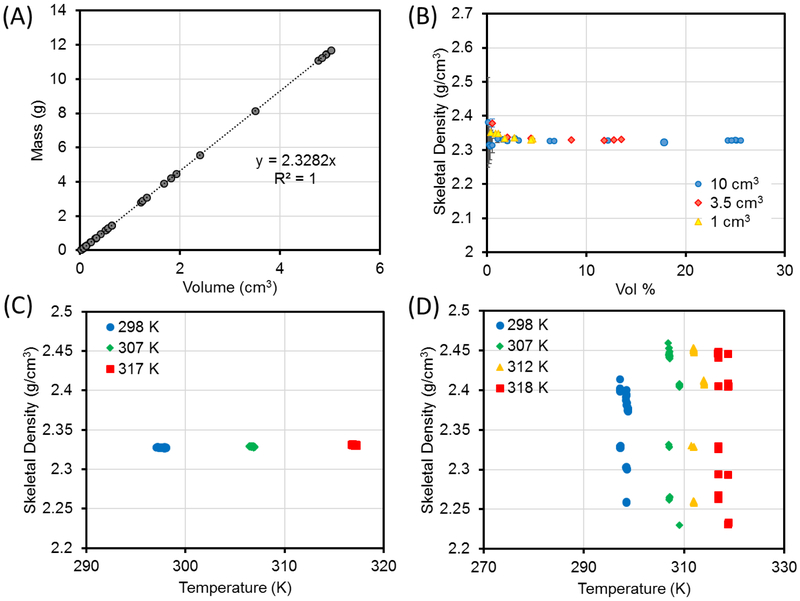
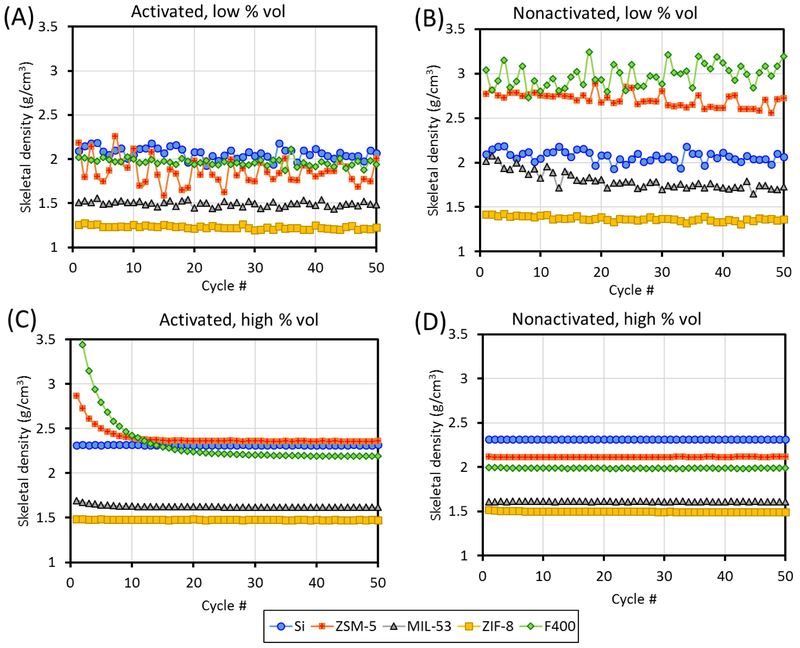
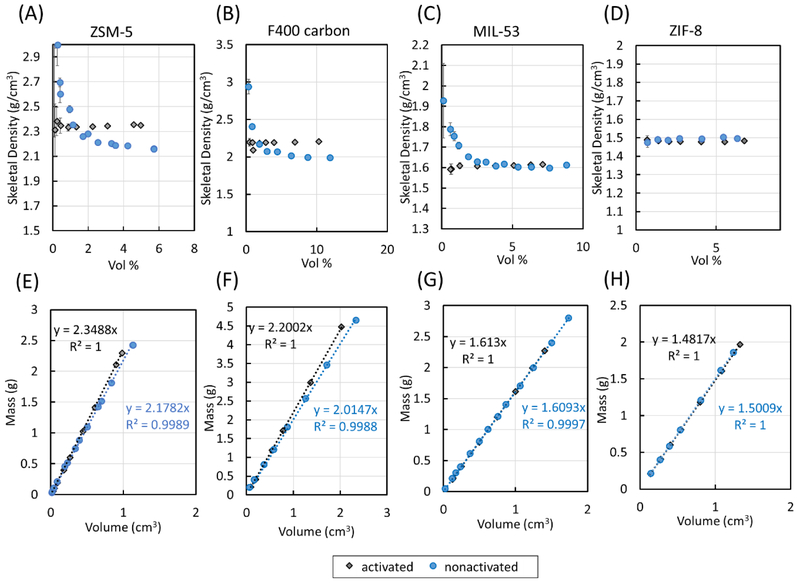
Although helium pycnometry is generally the method of choice for skeletal density measurements of porous materials, few studies have provided a wide range of case studies that demonstrate how to best interpret raw data and perform measurements using it. The examination of several different classes of materials yielded signature traits from helium pycnometry data that are highlighted. Experimental parameters important in obtaining the most precise and accurate value of skeletal density from the helium pycnometer are as high as possible percent fill volume and good thermostability. The degree of sample activation is demonstrated to affect the measured skeletal density of porous zeolitic, carbon, and hybrid inorganic-organic materials. In the presence of a significant amount of physisorbed contaminants (water vapor, atmospheric gases, residual solvents, etc.), which was the case for ZSM-5, MIL-53, and F400, but not ZIF-8, the skeletal density tended to be overestimated in the low percent volume region. In addition, the kinetic data (i.e., skeletal density vs measurement cycle) reveals distinctive traits for a properly activated vs a nonactivated sample for all examined samples: activated samples with a significant amount of mass loss show a curved down plot that eventually reaches the equilibrium value, whereas nonactivated, nonporous, or extremely hydrophobic samples exhibit a flat line. This work illustrates how helium pycnometry can provide information about the structure of a material, and that, conversely, when the structure of the material and its percent mass loss after activation (amount of physisorbed contaminants) are known, the behavior of activated and nonactivated samples in terms of skeletal density, percent fill volume, and measurement cycle can be predicted.
Figures

References
-
- Rouquerol F; Rouquerol J; Sing K Adsorption by Powers & Porous Solids: Principles, Methodology and Applications; Academic Press: London, UK, 1999.
-
- Krokida MK; Maroulis ZB Quality change during drying of food materials In Drying Technology in Agriculture and Food Sciences; Mujumdar AS, Ed. Science Publishers Inc: Enfield, NH, 2000; pp 61–106.
-
- Peyvandi A; Sbia LA; Soroushian P; Sobolev K Effect of the cementitious paste density on the performance efficiency of carbon nanofiber in concrete nanocomposite. Constr. Build. Mater 2013, 48, 265–269.
-
- Amer N; Storey C Jr., Delatte NJ In Effect of Density on Mechanical Properties and Durability of Roller Compacted Concrete; Portland Cement Association R&D; Serial No. 2940, 2008.
-
- Hancock BC; Colvin JT; Mullarney MP; Zinchuk AV The Relative Densities of Pharmaceutical Powders, Blends, Dry Granulations, and Immediate-Release Tablets. Pharm. Technol 2003, 27, 64–80.
Publication types
Grants and funding
LinkOut - more resources
Full Text Sources
Other Literature Sources
