

Fracture admission trends in England over a ten-year period
- PMID: 30698459
- PMCID: PMC6400910
- DOI: 10.1308/rcsann.2019.0002
Fracture admission trends in England over a ten-year period
Abstract
Introduction: Fractures are a common reason for admission to hospital around the world. Varying incidences have been reported but these are mainly based on small studies from individual centres. The aim of our study was to analyse fracture admissions in England over a ten-year period.
Methods: Data were collated from the Hospital Episodes Statistics database. Since 2004, data have been collected for all admitted patients in England using the International Classification of Diseases codes for the primary diagnosis. Data were analysed for the ten-year period between 2004-2005 and 2013-2014.
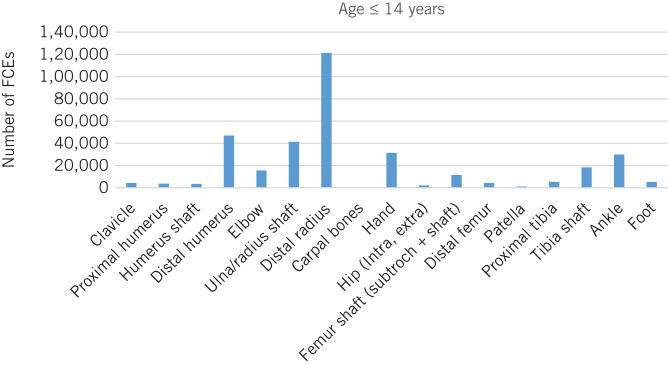
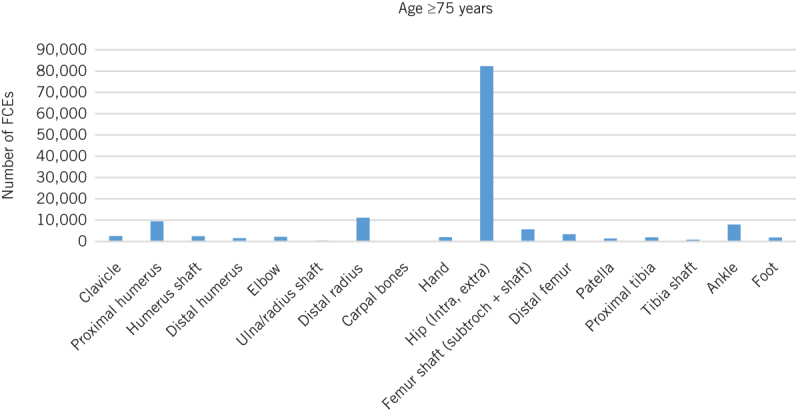
Results: There were 2,489,052 fracture admissions in England over the 10-year study period. The risk of admission for fracture was 47.84 per 10,000 population. The rate of fracture admission has remained stable. Hip fractures were the most common fracture requiring hospitalisation (n=641,263), followed by distal radius fractures (n=406,313), ankle fractures (n=332,617) and hand fractures (n=244,013). Hip fractures accounted for 58% of hospital bed days, ankle fractures for 10%, and femoral shaft fractures and subtrochanteric femoral fractures for 5% each. The number of bed days per year for hip fractures has reduced from 1,549,939 bed days in 2004-2005 to 1,319,642 in 2013-2014.
Conclusions: This study provides an updated picture of the incidence of fractures that required hospital admission over a ten-year period in England. It may be used as a platform from which the effect of modern patient treatment pathways can be monitored.
Keywords: Fracture; Fracture incidence; Hospital admission.
Figures


References
-
- Aitken SA, Hutchison JD, McQueen MM, Court-Brown CM. The importance of epidemiological fracture data: injury epidemiology for the non-epidemiologist. Bone Joint J 2014; : 863–867. - PubMed
-
- Clement ND, Aitken S, Duckworth AD et al. Multiple fractures in the elderly. J Bone Joint Surg Br 2012; : 231–236. - PubMed
-
- Court-Brown CM, Clement ND, Duckworth AD et al. The spectrum of fractures in the elderly. Bone Joint J 2014; : 366–372. - PubMed
-
- Royal College of Physicians National Hip Fracture Database (NHFD) Annual Report 2015. London: RCP; 2015.
-
- Court-Brown CM, Biant L, Bugler KE, McQueen MM. Changing epidemiology of adult fractures in Scotland. Scott Med J 2014; : 30–34. - PubMed
MeSH terms
LinkOut - more resources
Full Text Sources
Medical