. 2019 Mar 1;142(3):586-605.
doi: 10.1093/brain/awy353.

Astrocyte adenosine deaminase loss increases motor neuron toxicity in amyotrophic lateral sclerosis

Affiliations

Astrocyte adenosine deaminase loss increases motor neuron toxicity in amyotrophic lateral sclerosis

Scott P Allen et al. Brain. .

Abstract

As clinical evidence supports a negative impact of dysfunctional energy metabolism on the disease progression in amyotrophic lateral sclerosis, it is vital to understand how the energy metabolic pathways are altered and whether they can be restored to slow disease progression. Possible approaches include increasing or rerouting catabolism of alternative fuel sources to supplement the glycolytic and mitochondrial pathways such as glycogen, ketone bodies and nucleosides. To analyse the basis of the catabolic defect in amyotrophic lateral sclerosis we used a novel phenotypic metabolic array. We profiled fibroblasts and induced neuronal progenitor-derived human induced astrocytes from C9orf72 amyotrophic lateral sclerosis patients compared to normal controls, measuring the rates of production of reduced nicotinamide adenine dinucleotides from 91 potential energy substrates. This approach shows for the first time that C9orf72 human induced astrocytes and fibroblasts have an adenosine to inosine deamination defect caused by reduction of adenosine deaminase, which is also observed in induced astrocytes from sporadic patients. Patient-derived induced astrocyte lines were more susceptible to adenosine-induced toxicity, which could be mimicked by inhibiting adenosine deaminase in control lines. Furthermore, adenosine deaminase inhibition in control induced astrocytes led to increased motor neuron toxicity in co-cultures, similar to the levels observed with patient derived induced astrocytes. Bypassing metabolically the adenosine deaminase defect by inosine supplementation was beneficial bioenergetically in vitro, increasing glycolytic energy output and leading to an increase in motor neuron survival in co-cultures with induced astrocytes. Inosine supplementation, in combination with modulation of the level of adenosine deaminase may represent a beneficial therapeutic approach to evaluate in patients with amyotrophic lateral sclerosis.

Keywords: C9orf72; ALS; metabolism: inosine: adenosine deaminase.


Figures

Figure 1
Figure 1
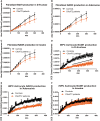
NADH production kinetic analysis of the top hits from the fibroblast and astrocyte phenotypic metabolic screen. (A) NADH production in fibroblasts with d-fructose as the sole energy source. (B) NADH production in fibroblasts with adenosine as the sole energy source. (C) NADH production in fibroblasts with inosine as the sole energy source. (D) NADH production in induced astrocytes (iAstrocytes) with d-fructose as the sole energy source. (E) NADH production in induced astrocytes with adenosine as the sole energy source. (F) NADH production in induced astrocytes with inosine as the sole energy source. Controls depicted in black and C9orf72 patients in orange. Fibroblast NADH production was measured using a BMG PHERAstar plate reader taking absorbance readings every 15 min over a 6-h period. Induced astrocyte NADH production was measured using an OmniLog metabolic profiling system, taking readings every 5 min over a 6-h period. Data presented as mean with standard error, for eight controls and six patients in triplicate for the fibroblasts and three controls and three patients for the induced astrocytes in triplicate. Background intensity values were subtracted from raw data values before being normalized to cell number (by Cyquant analysis). To detect differences in NADH production between controls and patients, two-way ANOVA, with Sidak post-test, area under the curve (AUC) and initial rate analysis by linear regression was performed. *P ≤ 0.05, multiple consecutive significant time points are represented as arrows. For all AUC and rate analyses see Supplementary Table 3.
Figure 2
Figure 2
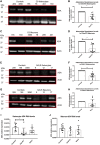
RNA and protein levels of adenosine deaminase (ADA) are reduced in C9orf72 and sporadic ALS patient cell models. (A and E) Western blot in human induced astrocytes. (B and F) induced astrocyte densitometry analysis. (C and G) Western blot in human induced neurons. (D and H) Induced neuron (iNeuron) densitometry analysis. (I) RT-PCR analysis of ADA RNA levels in induced astrocytes. (J) RT-PCR analysis of ADA RNA levels in induced neurons. Densitometry analysis performed by normalizing the ADA levels to the actin loading control and setting the control values to one then comparing the patient value to the matched control value. Representative western blots of three controls versus three patients performed n = 3/4 before densitometry analysis by Wilcoxon matched rank analysis. *P ≤ 0.05, **P ≤ 0.01, ***P ≤ 0.001. Individual RT-PCR data presented with mean and standard deviation followed by unpaired t-tests. Dashed lines = indicates cropped image. For full length gels see the Supplementary material.
Figure 3
Figure 3
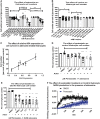
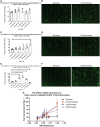
C9orf72 and sporadic ALS induced astrocytes are more susceptible to adenosine-mediated toxicity. (A) The effect of adenosine supplementation on induced astrocyte cell number. (B) The effect of inosine supplementation on induced astrocyte cell number. (C) The effect of ADA expression on adenosine mediated toxicity, analysed by Pearson’s correlation analysis (R2 = 0.8891, P = 0.0048, 95% confidence intervals = 0.5597 to 0.9939). (D) The effect of 4 mM adenosine on control induced astrocytes after pentostatin treatment. (E) The effect of 4 mM adenosine on C9orf72 induced astrocytes after pentostatin treatment. All data normalized to glucose control at 100%, each data point indicates one cell line performed once, all assays performed on three controls and three patient astrocyte lines in triplicate. Data transformed Y = 1/Y and Y = Logit(Y) prior to Kruskal Wallis analysis with a Dunn’s post-test. *P ≤ 0.05, **P ≤ 0.01, ***P ≤ 0.001, ****P ≤ 0.0001. Cons = controls; C9 = C9orf72 patients; Glu = glucose. (F) The effect of pentostatin treatment on control induced astrocyte NADH production in the presence of adenosine. For AUC and rate analysis see Supplementary Table 3. Data presented as mean with standard error, controls n = 3 in triplicate. Background intensity values were subtracted from raw data values before being normalized to cell number (by Cyquant analysis). Two-way ANOVA, with Sidak post-test, area under the curve (AUC) and initial rate analysis by linear regression was performed to detect differences in NADH production between DMSO and pentostatin treated cells. *P ≤ 0.05.
Figure 4
Figure 4
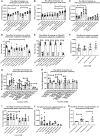
Inosine supplementation increase glycolytic energy output in C9orf72 induced astrocytes. (A) The effect of inosine supplementation on total ATP levels. (B) The effect of inosine supplementation on glycolytic ATP levels. (C) The effect of inosine supplementation on mitochondrial ATP levels. (D) The effect of inosine supplementation on control induced astrocyte metabolic equilibrium. (E) The effect of inosine supplementation on C9orf72 induced astrocyte metabolic equilibrium. (F) The effect of inosine supplementation on mitochondrial coupled respiration. (G) The effect of inosine supplementation on glycolytic flux. (H) The effect of inosine supplementation on glycolytic capacity flux. (I) The effect of inosine supplementation on spare respiratory capacity flux. (J) The effect of inosine supplementation on cellular lactate levels. (K) The effect of inosine supplementation on cellular uric acid levels. Induced astrocytes (iAstrocytes) were supplemented with inosine for 24 h. Each data point indicates one cell line performed once. All assays were performed on three controls and three patient astrocyte lines in triplicate. All data were analysed by Kruskal Wallis analysis with a Dunn’s post-test. *P ≤ 0.05, **P ≤ 0.01, ***P ≤ 0.001, ****P ≤ 0.0001. Cons = controls; Pats = C9orf72 patients; Glu = glucose; HG = high glucose (16 mM).
Figure 5
Figure 5
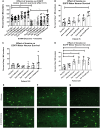
C9orf72 induced astrocyte inosine supplementation increases motor neuron survival in co-culture. Induced astrocytes (iAstrocytes) were treated with 0.4–13.5 mM inosine for 24 h prior to 72 h co-culture with EGFP motor neurons (MN). (A) Number of motor neurons with axons after 72 h expressed as a percentage of the number alive at the start of the assay. (BD) Number of motor neurons with axons after 72 h expressed as a percentage of the number alive at the start of the assay for Patients 78, 183 and 201. (EG) Representative images of the motor neurons after 72 h in glucose (5 mM) or glucose + inosine (4 mM). All data were transformed Y = 1/Y and Y = Logit(Y) prior to Kruskal Wallis analysis with a Dunn’s post-test and are presented with mean and standard deviation. *P ≤ 0.05, **P ≤ 0.01.
Figure 6
Figure 6
Sporadic ALS induced astrocyte inosine supplementation increases motor neuron survival in co-culture. Induced astrocytes were treated with 0.4–13.5 mM inosine for 24 h prior to 72-h co-culture with EGFP motor neurons (MN). (A) Number of motor neurons with axons after 72-h incubation with sporadic ALS-9 expressed as a percentage of the number alive at the start of the assay. (C) Number of motor neurons with axons after 72-h incubation with sporadic ALS-12 expressed as a percentage of the number alive at the start of the assay. (E) Number of motor neurons with axons after 72-h incubation with sporadic ALS-17 expressed as a percentage of the number alive at the start of the assay. (B, D and F) Representative images of the motor neurons after 72 h in glucose or glucose plus inosine. All data were transformed Y = 1/Y and Y = Logit(Y) prior to Kruskal Wallis analysis with a Dunn’s post-test and are presented with mean and standard deviation. *P ≤ 0.05, **P ≤ 0.01, ***P ≤ 0.001, ****P ≤ 0.0001. (G) The effect of induced astrocyte ADA expression on motor neuron cell survival in the presence of glucose or inosine. Pearson’s correlation analysis performed on the data, which is presented as the mean of cell survival with standard deviation. For Pearson’s analysis results see Supplementary Table 3.
Figure 7
Figure 7
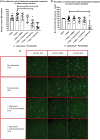
Inhibition of adenosine deaminase with pentostatin increases control induced astrocyte mediated toxicity towards motor neurons in the presence of adenosine. (A) Number of motor neurons (MN) with axons alive after 48 h, expressed as a percentage of the number alive at the start of the assay. (B) Number of motor neurons with axons at the start of the assay, expressed as a percentage of the glucose control. (C) Representative images of the three controls tested in triplicate. Control induced astrocytes were treated with pentostatin for 18 h prior to incubation with 4 mM adenosine for 24 h and then addition of EGFP motor neurons. All data were transformed Y = 1/Y and Y = Logit(Y) prior to Kruskal Wallis analysis with a Dunn’s post-test and are presented with mean and standard deviation. *P ≤ 0.05, **P ≤ 0.01, ***P ≤ 0.001.

Comment in

Similar articles

Cited by

References

    1. Al-Sarraj S, King A, Troakes C, Smith B, Maekawa S, Bodi I, et al.p62 positive, TDP-43 negative, neuronal cytoplasmic and intranuclear inclusions in the cerebellum and hippocampus define the pathology of C9orf72-linked FTLD and MND/ALS. Acta Neuropathol 2011; 122: 691–702. - PubMed
    1. Albasanz JL, Perez S, Barrachina M, Ferrer I, Martin M. Up-regulation of adenosine receptors in the frontal cortex in Alzheimer’s disease. Brain Pathol 2008; 18: 211–9. - PMC - PubMed
    1. Allen CF, Shaw PJ, Ferraiuolo L. Can astrocytes be a target for precision medicine? Adv Exp Med Biol 2017; 1007: 111–28. - PubMed
    1. Allen SP, Duffy LM, Shaw PJ, Grierson AJ. Altered age-related changes in bioenergetic properties and mitochondrial morphology in fibroblasts from sporadic amyotrophic lateral sclerosis patients. Neurobiol Aging 2015; 36: 2893–903. - PubMed
    1. Allen SP, Rajan S, Duffy L, Mortiboys H, Higginbottom A, Grierson AJ, et al.Superoxide dismutase 1 mutation in a cellular model of amyotrophic lateral sclerosis shifts energy generation from oxidative phosphorylation to glycolysis. Neurobiol Aging 2014; 35: 1499–509. - PubMed

Publication types

MeSH terms