. 2019 Mar 18;47(5):2446-2454.
doi: 10.1093/nar/gkz030.

The y-ome defines the 35% of Escherichia coli genes that lack experimental evidence of function

Affiliations

The y-ome defines the 35% of Escherichia coli genes that lack experimental evidence of function

Sankha Ghatak et al. Nucleic Acids Res. .

Abstract

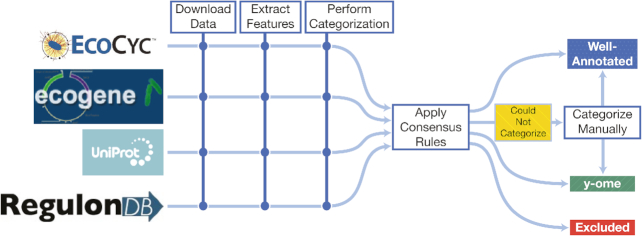
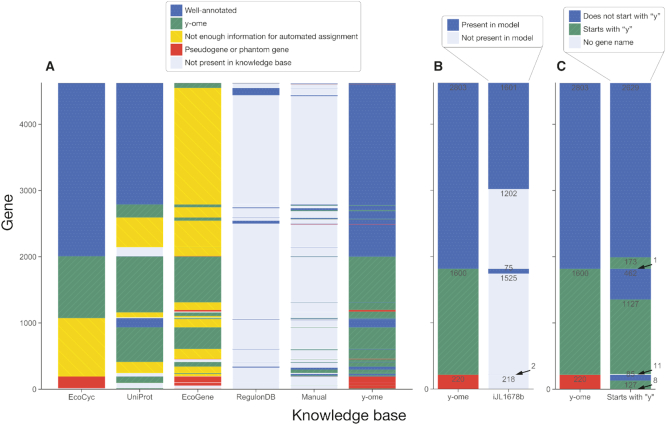
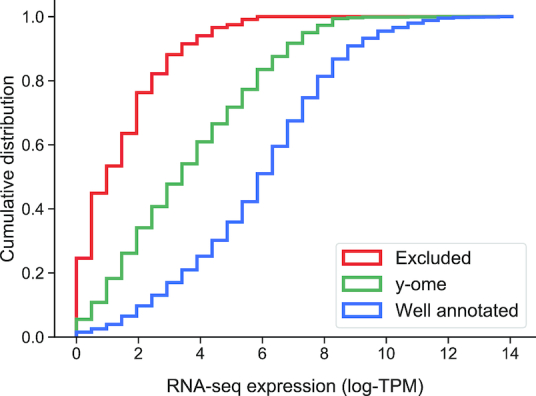
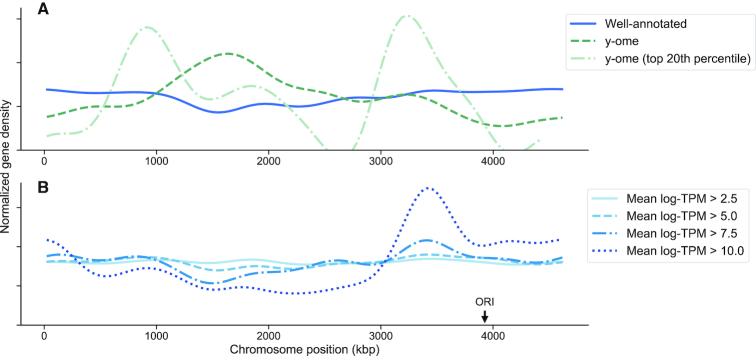
Experimental studies of Escherichia coli K-12 MG1655 often implicate poorly annotated genes in cellular phenotypes. However, we lack a systematic understanding of these genes. How many are there? What information is available for them? And what features do they share that could explain the gap in our understanding? Efforts to build predictive, whole-cell models of E. coli inevitably face this knowledge gap. We approached these questions systematically by assembling annotations from the knowledge bases EcoCyc, EcoGene, UniProt and RegulonDB. We identified the genes that lack experimental evidence of function (the 'y-ome') which include 1600 of 4623 unique genes (34.6%), of which 111 have absolutely no evidence of function. An additional 220 genes (4.7%) are pseudogenes or phantom genes. y-ome genes tend to have lower expression levels and are enriched in the termination region of the E. coli chromosome. Where evidence is available for y-ome genes, it most often points to them being membrane proteins and transporters. We resolve the misconception that a gene in E. coli whose primary name starts with 'y' is unannotated, and we discuss the value of the y-ome for systematic improvement of E. coli knowledge bases and its extension to other organisms.


Figures

Figure 1.
Figure 1.
A workflow for defining the y-ome of E. coli K-12 MG1655. Data were collected from four E. coli knowledge bases, and automated categorization was applied to determine their annotation level. Next, consensus rules were applied to combine categorizations from multiple databases. When the consensus rules could not be applied, genes were manually curated and placed in one of the categories. Thus, genes were categorized as ‘Well-Annotated’ or ‘y-ome’ according to the definition of the y-ome (see Section ‘Definition of the y-ome’). Pseudogenes and phantom genes were treated separately in the ‘Excluded’ category.
Figure 2.
Figure 2.
Gene annotation across knowledge bases. The y-axes represent all unique genes in the database. Gene order is maintained within each subplot so one can track the annotation of a set of genes across knowledge bases. (A) An automated approach was used to categorize genes from each database as ‘Well-annotated’ or ‘y-ome’ based on the definition of the y-ome. Pseudogenes and phantom genes were excluded. The resulting y-ome includes 1600 genes. (B) y-ome categories were compared to the content of the latest E. coli genome-scale ME-model. (C) A total of 173 genes have primary names that start with ‘y’ but are well-annotated, and 462 genes in the y-ome have non-‘y’ primary names.
Figure 3.
Figure 3.
Average gene expression for all genes in a compendium of E. coli RNA-seq data. Cumulative distributions of normalized mean expression levels (mean log-TPM) for ‘y-ome’ (green), ‘Well annotated’ (blue) and ‘Excluded’ (red) genes across the 78 conditions surveyed in a compendium of RNA-Seq data.
Figure 4.
Figure 4.
Gene expression by location on the chromosome. (A) The y-ome genes are enriched in the termination region of the E. coli chromosome, opposite the ORI. However, the y-ome genes in the top 20th percentile of expression (mean log-TPM > 7.57) are enriched both near the ORI and the termination region. (B) Highly expressed genes are known to be enriched around the ORI (16), which we confirmed by plotting density of genes in the chromosome with increasing thresholds of mean gene expression (mean log-TPM) across the compendium of RNA-seq data for 78 conditions.
Figure 5.
Figure 5.
Co-expressed gene modules identified with IterativeWGCNA. The bar plot summarizes the number of genes in each module by category (‘Well-annotated’, ‘y-ome’ and ‘Psuedogene or phantom gene’). The table lists all genes in Module M21—of which only ygiQ is in the y-ome—and the primary names and descriptions from EcoCyc.

References

    1. Hutchison C.A. 3rd, Chuang R.-Y., Noskov V.N., Assad-Garcia N., Deerinck T.J., Ellisman M.H., Gill J., Kannan K., Karas B.J., Ma L. et al. .. Design and synthesis of a minimal bacterial genome. Science. 2016; 351:aad6253. - PubMed
    1. Danchin A., Fang G.. Unknown unknowns: essential genes in quest for function. Microb. Biotechnol. 2016; 9:530–540. - PMC - PubMed
    1. Dellomonaco C., Clomburg J.M., Miller E.N., Gonzalez R.. Engineered reversal of the β-oxidation cycle for the synthesis of fuels and chemicals. Nature. 2011; 476:355–359. - PubMed
    1. Sandberg T.E., Pedersen M., LaCroix R.A., Ebrahim A., Bonde M., Herrgard M.J., Palsson B.O., Sommer M., Feist A.M.. Evolution of Escherichia coli to 42°C and subsequent genetic engineering reveals adaptive mechanisms and novel mutations. Mol. Biol. Evol. 2014; 31:2647–2662. - PMC - PubMed
    1. Hufnagel D.A., DePas W.H., Chapman M.R.. The disulfide bonding system suppresses CsgD-independent cellulose production in Escherichia coli. J. Bacteriol. 2014; 196:3690–3699. - PMC - PubMed

Publication types

MeSH terms

Substances