. 2019 Apr 8;47(6):2822-2839.
doi: 10.1093/nar/gkz005.

SMCHD1 is involved in de novo methylation of the DUX4-encoding D4Z4 macrosatellite

Affiliations

SMCHD1 is involved in de novo methylation of the DUX4-encoding D4Z4 macrosatellite

Camille Dion et al. Nucleic Acids Res. .

Abstract

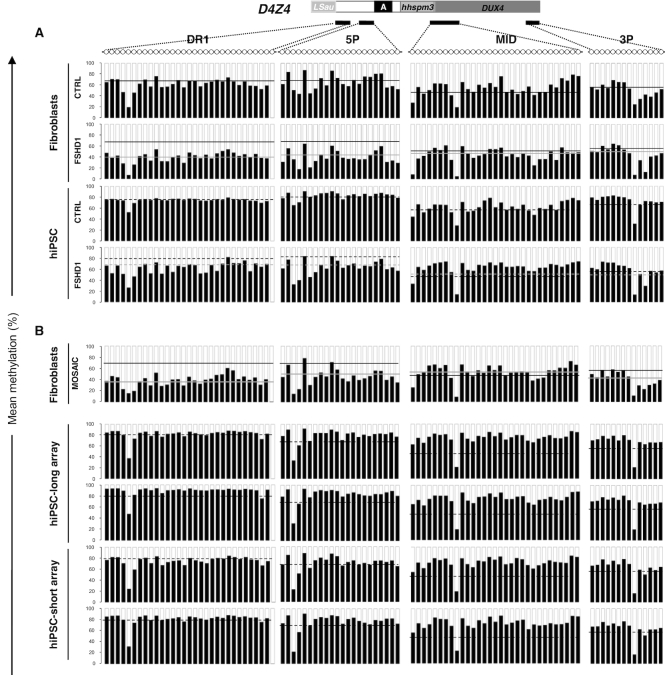
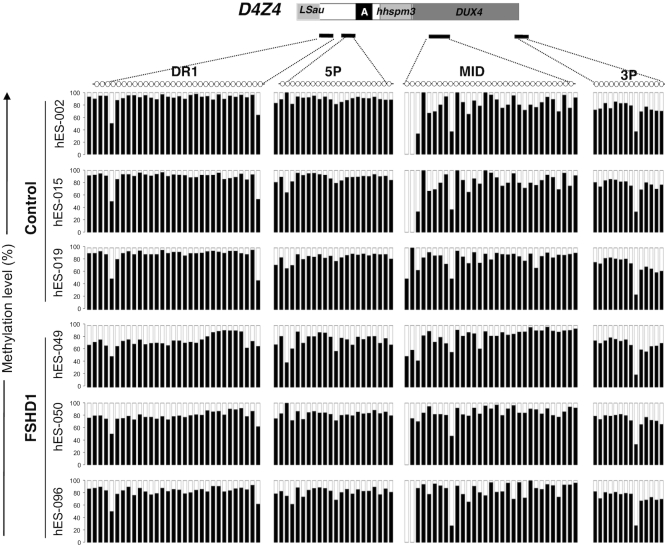
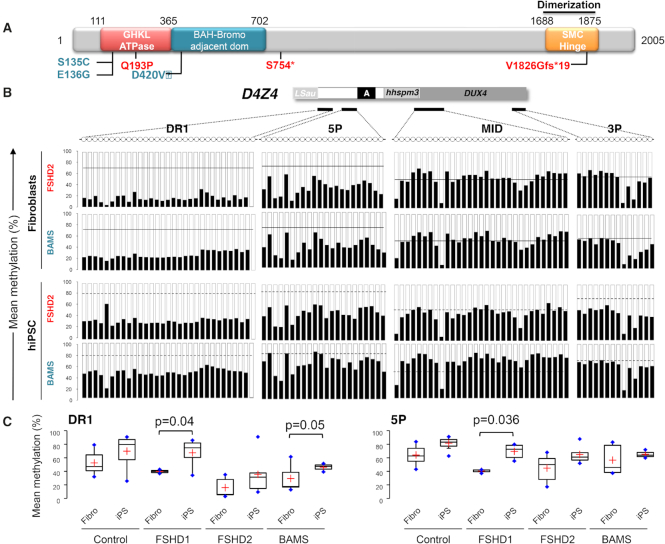
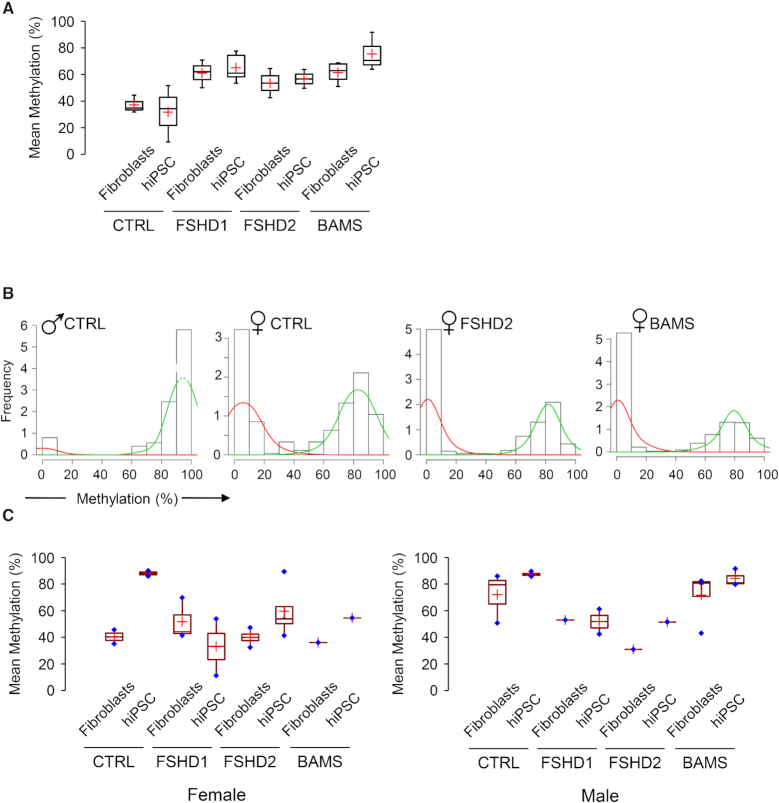
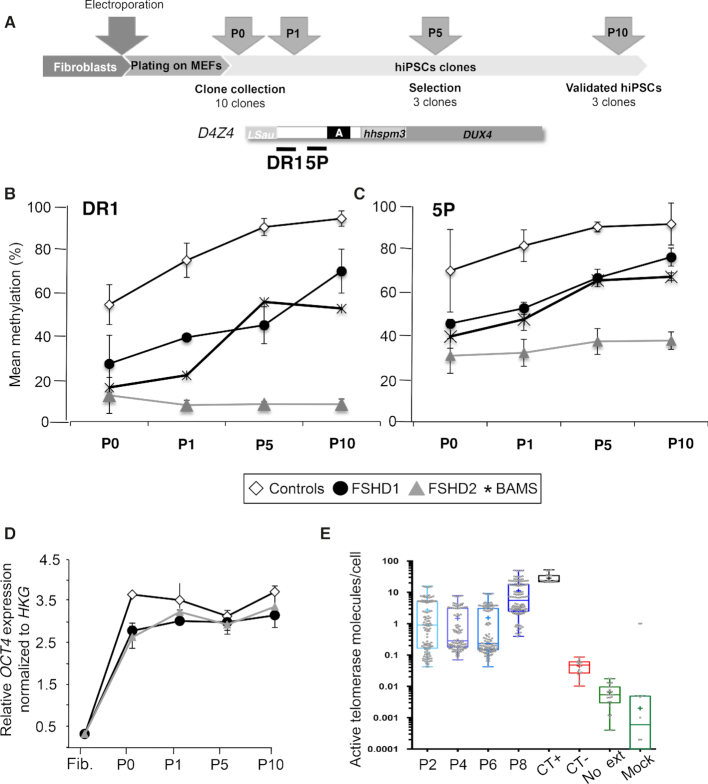
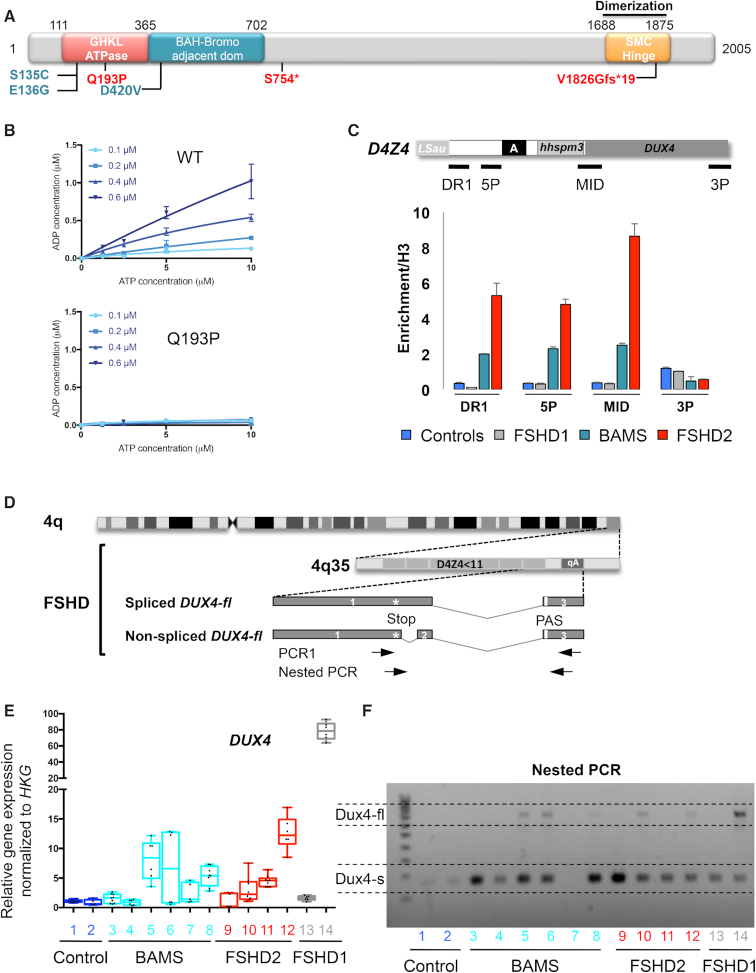
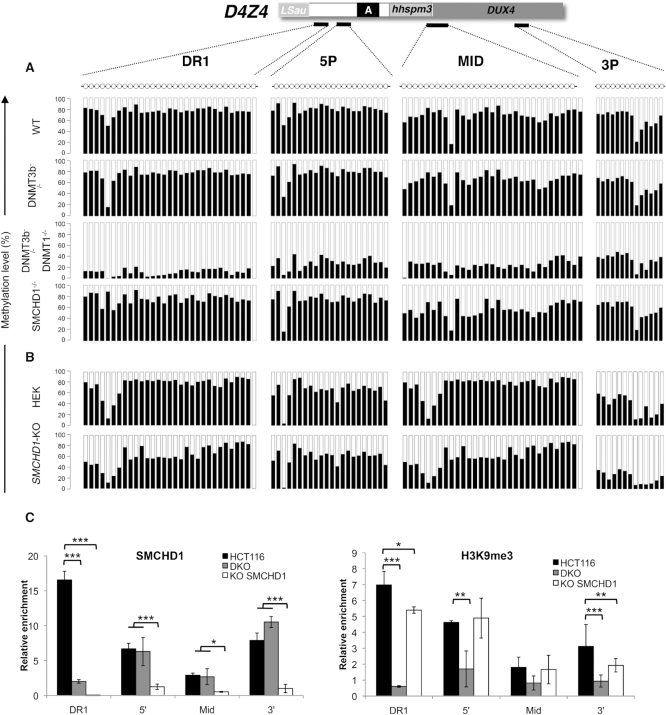
The DNA methylation epigenetic signature is a key determinant during development. Rules governing its establishment and maintenance remain elusive especially at repetitive sequences, which account for the majority of methylated CGs. DNA methylation is altered in a number of diseases including those linked to mutations in factors that modify chromatin. Among them, SMCHD1 (Structural Maintenance of Chromosomes Hinge Domain Containing 1) has been of major interest following identification of germline mutations in Facio-Scapulo-Humeral Dystrophy (FSHD) and in an unrelated developmental disorder, Bosma Arhinia Microphthalmia Syndrome (BAMS). By investigating why germline SMCHD1 mutations lead to these two different diseases, we uncovered a role for this factor in de novo methylation at the pluripotent stage. SMCHD1 is required for the dynamic methylation of the D4Z4 macrosatellite upon reprogramming but seems dispensable for methylation maintenance. We find that FSHD and BAMS patient's cells carrying SMCHD1 mutations are both permissive for DUX4 expression, a transcription factor whose regulation has been proposed as the main trigger for FSHD. These findings open new questions as to what is the true aetiology for FSHD, the epigenetic events associated with the disease thus calling the current model into question and opening new perspectives for understanding repetitive DNA sequences regulation.


Figures

Figure 1.
Figure 1.
Methylation of the D4Z4 macrosatellite increases upon reprogramming in FSHD1 cells. (A) DNA methylation was determined after sodium bisulfite modification for four subdomains across D4Z4 by PCR amplification and high throughput DNA sequencing. DR1 and 5P are located upstream of the DUX4 coding sequence, MID corresponds to the DUX4 promoter and 3P, to the end of DUX4 exon 1 encoding the protein. For each sequence, dots represent individual CpG. For the different types of samples (control or FSHD1 fibroblasts; controls or FSHD1 hiPSCs), we plotted the mean methylation level of each CpG for the four D4Z4 subdomains. Histogram bars represent the average of methylated (black) or unmethylated (white) CpG for each position in DNA from primary fibroblasts from 8 controls (row 1, mean methylation level for DR1: 71.4% ± 8.8, mean methylation level for 5P, 73.1% ± 13.1) and four FSHD1 (row 2, mean methylation level for DR1: 39.9% ± 4.4, mean methylation level for 5P, 40.5% ± 3). For hiPSCs derived from control (row 3, DR1: 79.8% ± 16.6 and 5P: 84.1% ± 7.4) and FSHD1 fibroblasts (row 4, DR1: 67.8% ± 23.4 and 5P: 69.7% ± 11.1), the average mean methylation level of each CG is represented as above. For each histogram, the mean methylation level in control fibroblasts is indicated by a black line, or a grey line in FSHD1 fibroblasts. In hiPSCs, the mean methylation level is indicated by a dashed black line for conrols or a dashed grey line for FSHD1 cells. Methylation level is significantly increased in FSHD1 hiPSCs for DR1 (P value <0.04) and for 5P (P value <0.036) compared to fibroblasts. (B) We analyzed the D4Z4 methylation pattern in fibroblasts from a mosaic patient clinically affected with FSHD and carrying a short 2 D4Z4 units repeat in 25% of cells and a long 11 D4Z4 units repeat in 75% of cells. DNA methylation was also analyzed in two hiPSCs clones carrying the 11 D4Z4 units repeat and two hiPSCs clones carrying the 2 D4Z4 units repeat derived from this patient's fibroblasts. Mean methylation level was plotted as detailed above. Values are given in the Supplementary Table S2. In fibroblasts from this mosaic patient, the mean methylation level is indicated by a gray line. The black lines correspond to the mean methylation levels in control fibroblasts. In hiPSCs, the dashed black line corresponds to the mean methylation level in control hiPSCs. The methylation level in hiPSCs is not significantly different between the different clones or compared to the controls.
Figure 2.
Figure 2.
D4Z4 methylation profiles in control and FSHD1 embryonic stem cells. We compared the methylation profile of the four different D4Z4 subdomains (DR1, 5P, MID and 3P) in three different human embryonic stem cells (hESCs) from healthy donors and three different donors carrying a short D4Z4 array (FSHD1). Each sample is represented individually. Histogram bars represent the percentage of methylated (black) or unmethylated (white) CpG for each position and each individual sample.
Figure 3.
Figure 3.
D4Z4 remethylation is impaired by mutation in SMCHD1. (A) Schematic representation of the SMCHD1 protein and position of mutations in BAMS (cyan) or FSHD2 patients (red). BAMS-1 (E136G) and BAMS-2 (S135C) carry a missense mutation in the ATPase domain reported as a gain of function. BAMS-9 carries a missense mutation in the C-terminal region of the extended GHKL-like ATPase domain (D420V). FSHD2 patient #14586 also carries a mutation in the ATPase domain (Q193P) while FSHD2-11440 and FSHD2-11491 carry a truncating mutation (p.S754* and p.V1826Gfs*19 respectively). (B) DNA methylation was determined after sodium bisulfite modification for 4 regions across D4Z4 (DR1, 5P, MID, 3P) by PCR amplification and high throughput DNA sequencing. For each sequence, dots represent individual CpGs. The mean methylation level of each CpG was plotted for the 4 D4Z4 subdomains. Histogram bars represent the average of methylated (black) or unmethylated (white) CpG for each position in DNA from fibroblasts (rows 1; 2) from FSHD2 patients (n = 3) and patients with BAMS (n = 3) and corresponding hiPSCs clones (rows 3; 4). For each histogram, the mean methylation level in control fibroblasts is indicated by the black line. In hiPSCs, the mean methylation level is indicated by a dashed black line for controls. (C) Boxplot representation of the mean methylation level for the DR1 and 5P differentially methylated sequences in primary fibroblasts and hiPSCs from control donors, FSHD1, FSHD2 and BAMS patients. Significant differences are indicated by brackets with the corresponding pvalues determined using a Kruskal–Wallis non parametric test.
Figure 4.
Figure 4.
FSHD2- or BAMS-linked SMCHD1 mutations do not alter H19 imprinting or X chromosome conformation and methylation. (A) We plotted the mean methylation level for the H19 imprinted locus differentially methylated region (DMR) after bisulfite sequencing. Values are not significantly different between samples with approximately the same amount of methylated or unmethylated molecules in the different samples. This indicates that mutations in SMCHD1 do not modify imprinting of this locus in primary cells or after reprogramming. (B) Representative distribution of the frequency of sequences relative to their level of methylation for the DXZ4 macrosatellite element in the different contexts (control male, control female, female FSHD2, female BAMS). Histogram bars represent the frequency of methylated molecules from low (0–10%) to high (90–100%) methylation. The mean methylation level for each group is determined as the area under the curve. Green curves, high methylation level; red curves, low methylation level. (C) We plotted the mean methylation level for the DXZ4 macrosatellite element in female (left graph) or male (right graph) fibroblasts and hiPSCs.
Figure 5.
Figure 5.
D4Z4 remethylation correlates with expression of pluripotency markers and telomerase reactivation. (A) Timeline of the analysis of D4Z4 methylation dynamics upon reprogramming. (B) DNA methylation was analyzed in primary fibroblasts at low passage prior to reprogramming. Reprogramming was performed by electroporation of vectors encoding the different reprogramming factors. Six days after, cells are collected and plated on MEFs. A fraction of them were kept for methylation analysis (P0). Clones emerge between 2 and 3 weeks on the layer of feeders. For each sample, 10 clones were randomly chosen and isolated. For each clone, a fraction was kept for amplification. DNA and RNA extraction was done on the remaining cells pellet. (C, D) DNA methylation was analyzed after sodium bisulfite modification and deep-sequencing for the DR1 (C) and 5P (D) regions at different time points (after plating on MEFs (P0), first (P1), fifth (P5) or tenth (P10) passage) in ten clones/sample from two controls (white bars), two FSHD1 (black bars), two FSHD2 (dark gray) and two BAMS (light grey) patients. For each time point, the average methylation level ± S.D. is reported. Data sets were compared with the Wilcoxon non-parametric test and brackets identify significantly different groups based on post hoc Dunn comparison and Bonferroni correction (** P< 0.001) between P0 and P10. (D) To monitor reprogramming, expression of the OCT4 pluripotency marker was determined by RT-qPCR at the different time points. (E) Telomerase reactivation was monitored by ddTRAP at different time points using previously described conditions (56). The threshold between positive and negative droplets was determined by including controls such as a no-template lysis buffer control (CT), a control where no primers were present but lysate was added to the ddPCR (Mock) and a control in the absence of enzyme for primer extension (Ext). The U87 cell line was used as positive control (CT+). Once the threshold (i.e. separation of positive droplets and negative droplets) was determined, the output was given in molecules of extension products per microliter of ddPCR reaction. We defined telomerase activity as the number of extended TS molecules counted by ddPCR and expressed in molecules per μl. The measured telomerase activity was then converted to total product generated. The telomerase activity was normalized to a per-cell equivalent basis by dividing total product generated by the number of cell equivalents input into the assay. Telomerase activity is detectable at passage 2, stable between passages two and six and increased between passages 8 and 10.
Figure 6.
Figure 6.
BAMS patients express the pathogenic DUX4-fl transcript and DUX4 targets. (A) Schematic representation of the SMCHD1 protein and position of mutations in BAMS (cyan) or FSHD2 patients (red). BAMS-1 (E136G) and BAMS-2 (S135C) carry missense mutations in the ATPase domain reported as gain of function. BAMS-9 carries a missense mutation in the C-terminal region of the extended GHKL-like ATPase domain (D420V). FSHD2 patient #14586 also carries a mutation in the ATPase domain (Q193P) while FSHD2-11440 and FSHD2-11491 carry a truncating mutation (p.S754* and p.V1826Gfs* respectively). (B) In vitro analysis of ATPase activity using a recombinant wild-type extended SMCHD1 ATPase domain and a recombinant extended SMCHD1 ATPase domain containing the FSHD2 Q193P mutation. Each graph shows ATP concentration (x axis, μM) versus concentration of ADP produced (y axis, μM) for different concentrations of recombinant protein. The protein concentration is indicated in the inset legend adjacent to the y axis. Means ± S.D. are shown for triplicate measurements. (C) Chromatin Immunoprecipitation assay for SMCHD1 in hiPSCs. Histogram bars correspond to quantification of SMCHD1 binding to D4Z4 by digital droplet PCR after SMCHD1 immunoprecipitation. Enrichment was determined by comparison to histone H3 immunoprecipitation with error bars corresponding to S.D. (D) Schematic representation of chromosome 4 and 4q35 locus with position of the DUX4 coding sequence. Each D4Z4 monomer contains the first exon of the DUX4 ORF. The second and third exons correspond to the 3′ untranslated region (3′ UTR). The third exon contains a non-canonical polyadenylation signal (PAS; TAATTT). Alternative splicing involving exon 1 (with or without exon 2) and downstream exons 3 to 7 give rise to different transcripts produced in the germline and stabilized by a polyadenylation site downstream of exon 7. Transcripts consisting of exons 1–3 encode the DUX4-fl long isoform produced in FSHD cells and stabilized by the presence of the PAS (20,40). This transcript is also detectable in healthy individuals (41,57,58). The DUX4-fl transcript is detectable using a nested PCR designed to amplify transcripts containing the 3′ end of exon 1 and exon 3 containing the polyadenylation site. Position of primers is indicated by arrows. (E) We evaluated expression of the DUX4-fl transcript in different hiPSCs clones derived from 2 clones from healthy donors (AG08; AG09; blue), three patients with BAMS (BAMS-1; BAMS-2; BAMS-9, cyan); three patients with FSHD2 (11440; 11491; 14586, red), and two clones from FSHD1 patients (TalF carrying two D4Z4 units; 12759 carrying 7 D4Z4 units, gray). Expression level was normalized to three different housekeeping genes (HKG). (F) DUX4 transcripts were analyzed by RT-PCR using primers designed to amplify the short isoform (DUX4-s), detectable in all cells and the DUX4-fl pathogenic transcript. We detected the DUX4-fl transcript in samples 5, 6 (two clones derived from BAMS 9), 8 (BAMS 1), 10 (FSHD2, 11440), 12 (FSHD2, 14586) and 14 (TalF; FSHD1 patient with two RU).
Figure 7.
Figure 7.
Invalidation of SMCHD1 in somatic cells does not lead to D4Z4 hypomethylation. (A) We determined D4Z4 methylation in the HCT116 cell line (HCT116), and in clones in which DNMT3B (3BKO), both DNMT1 and DNMT3B (dKO) or SMCHD1 (SMCHD1-KO) have been invalidated using Zinc finger nucleases. DNA methylation was analyzed after sodium bisulfite modification and deep-sequencing for four regions across D4Z4. The percentage of methylation was calculated for each individual CpG, black bars correspond to methylated CGs; white bars to unmethylated ones. Methylation percentages are provided in the Supplementary Table S2 as the average values ± S.D from three independent experiments. (B) D4Z4 methylation in the HEK 293 cell line and in HEK cells invalidated for SMCHD1 for four regions across D4Z4. (C) Schematic representation of D4Z4 from position 1 to 3303 relative to the two flanking KpnI sites and position of primers used for ChIP-qPCR. We analyzed SMCHD1 binding and distribution of H3K9 trimethylation across D4Z4 after chromatin immunoprecipitation in HCT116, dKO or SMCHD1-KO cells. Enrichment over input was determined by qPCR. Histograms display the average enrichment after normalization over a single copy intergenic region. Values are average from at least three independent biological replicates and a technical duplicate. Error bar represents standard error. Statistical significance was determined using a paired two-tailed Student's t test (*P< 0.01; **P< 0.001; ***P< 0.0001).

References

    1. Blewitt M.E., Gendrel A.V., Pang Z., Sparrow D.B., Whitelaw N., Craig J.M., Apedaile A., Hilton D.J., Dunwoodie S.L., Brockdorff N. et al. .. SmcHD1, containing a structural-maintenance-of-chromosomes hinge domain, has a critical role in X inactivation. Nat. Genet. 2008; 40:663–669. - PubMed
    1. Chen K., Czabotar P.E., Blewitt M.E., Murphy J.M.. The hinge domain of the epigenetic repressor Smchd1 adopts an unconventional homodimeric configuration. Biochem. J. 2016; 473:733–742. - PubMed
    1. Jansz N., Chen K., Murphy J.M., Blewitt M.E.. The Epigenetic regulator SMCHD1 in development and disease. Trends Genet. 2017; 33:233–243. - PubMed
    1. Gendrel A.V., Apedaile A., Coker H., Termanis A., Zvetkova I., Godwin J., Tang Y.A., Huntley D., Montana G., Taylor S. et al. .. Smchd1-dependent and -independent pathways determine developmental dynamics of CpG island methylation on the inactive X chromosome. Dev. Cell. 2012; 23:265–279. - PMC - PubMed
    1. Gendrel A.V., Tang Y.A., Suzuki M., Godwin J., Nesterova T.B., Greally J.M., Heard E., Brockdorff N.. Epigenetic functions of smchd1 repress gene clusters on the inactive X chromosome and on autosomes. Mol. Cell Biol. 2013; 33:3150–3165. - PMC - PubMed

Publication types

MeSH terms

Substances

Supplementary concepts