. 2019 May;25(5):1779-1792.
doi: 10.1111/gcb.14580. Epub 2019 Feb 27.

Decoupled trophic responses to long-term recovery from acidification and associated browning in lakes

Affiliations

Decoupled trophic responses to long-term recovery from acidification and associated browning in lakes

Taylor H Leach et al. Glob Chang Biol. 2019 May.

Abstract

Increases in the concentration of dissolved organic matter (DOM) have been documented in many inland waters in recent decades, a process known as "browning". Previous studies have often used space-for-time substitution to examine the direct consequences of increased DOM on lake ecosystems. However, browning often occurs concomitant with other ecologically important water chemistry changes that may interact with or overwhelm any potential ecological response to browning itself. Here we examine a long-term (~20 year) dataset of 28 lakes in the Adirondack Park, New York, USA, that have undergone strong browning in response to recovery from acidification. With these data, we explored how primary producer and zooplankton consumer populations changed during this time and what physical and chemical changes best predicted these long-term ecosystem changes. Our results indicate that changes in primary producers are likely driven by reduced water clarity due to browning, independent of changes in nutrients, counter to previously hypothesized primary producer response to browning. In contrast, declines in calcium concomitant with browning play an important role in driving long-term declines in zooplankton biomass. Our results indicate that responses to browning at different trophic levels are decoupled from one another. Concomitant chemical changes have important implications for our understanding of the response of aquatic ecosystems to browning.

Keywords: Adirondack Mountains; acidification; aquatic; calcium; dissolved organic matter; long-term trends.


Figures

Figure 1
Figure 1
Location of 28 study lakes within the Adirondack State Park (blue line) of northern New York State. Inset shows the location of the park within the northeastern United States
Figure 2
Figure 2
Several, but not all, theoretical combinations of trends and correlation with interannual variability. Interannual variability and trend directions are independent of each other. Directional coherence between long‐term trends are grouped by rows (a and b = same; c and d = opposite) and inter‐annual variability correlations by columns (a and c = positive; b and d = negative). Correlations in interannual variability may also be high even if one, or both, of the variables are not trending over time
Figure 3
Figure 3
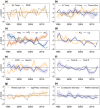
Time series of a) air temperature (0.134 °C year‐1) and Palmer drought severity index (PDSI), b) surface (S. Temp; 0.14 °C year‐1) and bottom water temperature (B. Temp; no significant trend) and thermocline depth (Thermocline ‐0.04 m year‐1), c) metrics of recovery from acidification including pH (0.019 pH year‐1), ANC (acid neutralizing capacity; 0.965 μeq. L‐1 year‐1), and nitrate (NO3 ; ‐0.023 mg L‐1 year‐1) and sulfate (SO4 2‐; ‐0.109 mg L‐1 year‐1) concentrations, d) inorganic monomeric aluminum (AlIN; ‐0.89 μg L‐1 year‐1) and calcium (Ca; ‐0.014 mg L‐1 year‐1 ) concentration, e) DOC (0.052 mg L‐1 year‐1) concentration and Secchi disk depth (‐0.046 m year‐1), f) total nitrogen (TN; ‐0.009 mg L‐1 year‐1) and total phosphorus (TP), g) mixed layer chlorophyll concentration (0.06 μg L‐1 year‐1) and log phytoplankton biomass (Phyto. biomass no significant trend), and h) crustacean (‐0.009 mg wet weight L‐1 year‐1 and rotifer (no significant trend) biomass. Time series are shown here as a z score (standardized as (value – mean)/ standard deviation) for each variable. Lake population and within lake trends for each variable are reported in Table S3. Lines represent lake population trends as median values for all lakes within a year and shaded areas show the first‐third quartiles of each variable for that year. Lines shown in grey indicate non‐significant trends, while all others represent significant trends (p ≤ 0.05) based on a Mann‐Kendall test statistic
Figure 4
Figure 4
Per cent change in each variable over time for the lake population (all lakes) and each individual lake. Significance of trends is not denoted. Lake population and within lake trends, and per cent change for each variable are reported in Table S3. Rotifer and crustacean represent biomass of each group. All other abbreviations as follows: AlIN, inorganic monomeric aluminum; ANC, acid neutralizing capacity; Ca, calcium; Chl, chlorophyll concentration; DOC, dissolved organic carbon; NO3 , nitrate; Phyto, phytoplankton biomass; TP, total phosphorus; TN, total nitrogen; Secchi, Secchi disk depth; SO4 2, sulfate; Thermocline, thermocline depth; Temp., temperature; and Zoop, zooplankton biomass
Figure 5
Figure 5
Correlations of interannual variability (IAV) between select variables. Text in each square represents Spearman rank correlation coefficients and squares without values are non‐significant correlations (p > 0.01). PDSI is Palmer Drought Severity Index, all other abbreviations as in Figure 4
Figure 6
Figure 6
Relationship between DOC and total phosphorus concentrations across all 28 study lakes. Value represents the average concentrations from 1994–2006 or 1994–2012 depending on the lake (Table 1). Line represents a linear model of the relationship with slope 0.57 and intercept 3.1 (R2 = 0.39, p < 0.001)

References

    1. Alley, W. M. (1984). The palmer drought severity index: Limitations and assumptions. Journal of Climate and Applied Meteorology, 23, 1100–1109. 10.1175/1520-0450(1984)023lt;1100:TPDSILgt;2.0.CO;2 - DOI
    1. Arnott, S. E. , Yan, N. , Keller, W. , & Nicholls, K. (2001). The influence of drought‐induced acidification on the recovery of plankton in Swan Lake (Canada). Ecological Applications, 11, 747–763. 10.1890/1051-0761(2001)011[0747:TIODIA]2.0.CO;2 - DOI
    1. Arnott, S. E. , Azan, S. E. , & Ross, A. J. (2017). Calcium decline reduces population growth rates of zooplankton in field mesocosms. Canadian Journal of Zoology, 95, 323–333. 10.1139/cjz-2016-0105 - DOI
    1. Ashforth, D. , & Yan, N. D. (2008). The interactive effects of calcium concentration and temperature on the survival and reproduction of Daphnia pulex at high and low food concentrations. Limnology and Oceanography, 53, 420–432.
    1. Azan, S. S. E. , & Arnott, S. E. (2017). The impact of calcium decline on population growth rates of crustacean zooplankton in Canadian Shield lakes. Limnology and Oceanography.

Publication types

LinkOut - more resources