. 2019 Apr;33(4):5320-5333.
doi: 10.1096/fj.201801499RRR. Epub 2019 Jan 30.

Expression patterns of endothelial permeability pathways in the development of the blood-retinal barrier in mice

Affiliations

Expression patterns of endothelial permeability pathways in the development of the blood-retinal barrier in mice

Anne-Eva van der Wijk et al. FASEB J. 2019 Apr.

Abstract

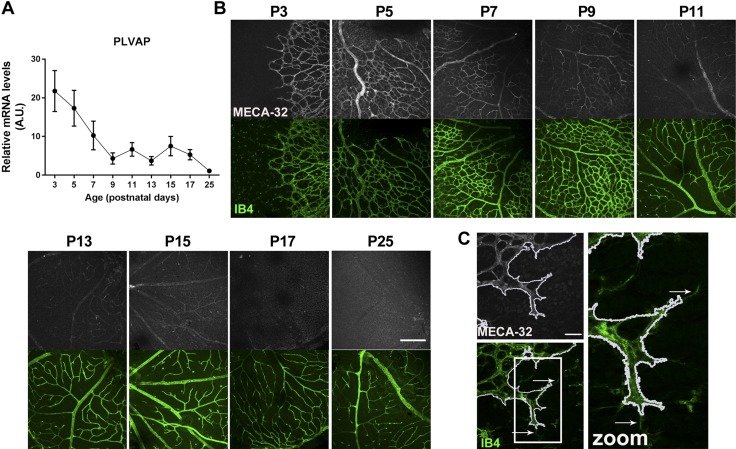
Insight into the molecular and cellular processes in blood-retinal barrier (BRB) development, including the contribution of paracellular and transcellular pathways, is still incomplete but may help to understand the inverse process of BRB loss in pathologic eye conditions. In this comprehensive observational study, we describe in detail the formation of the BRB at the molecular level in physiologic conditions, using mice from postnatal day (P)3 to P25. Our data indicate that immature blood vessels already have tight junctions at P5, before the formation of a functional BRB. Expression of the endothelial cell-specific protein plasmalemma vesicle-associated protein (PLVAP), which is known to be involved in transcellular transport and associated with BRB permeability, decreased during development and was absent when a functional barrier was formed. Moreover, we show that PLVAP deficiency causes a transient delay in retinal vascular development and changes in mRNA expression levels of endothelial permeability pathway proteins.-Van der Wijk, A.-E., Wisniewska-Kruk, J., Vogels, I. M. C., van Veen, H. A., Ip, W. F., van der Wel, N. N., van Noorden, C. J. F., Schlingemann, R. O., Klaassen, I. Expression patterns of endothelial permeability pathways in the development of the blood-retinal barrier in mice.

Keywords: VEGF signaling; tight junctions; transcellular permeability.


Conflict of interest statement

In memory of the authors’ dear friend and colleague, Joanna Wisniewska-Kruk (1986-2016), who will always be remembered with a smile. The authors thank Dr. R. A. Hoebe of the Cellular Imaging Core Facility (University of Amsterdam, Amsterdam, The Netherlands) for his advice with respect to quantification of vascular density and help with making the supplemental video and Dr. A. Jonker (Department of Medical Biology, AMC, Amsterdam, The Netherlands) for designing the ImageJ macro to determine the length of the vascular sprouting front. The mouse strain used for this research project, B6;129S5-Plvaptm1Lex/Mmucd, identification number 032525-UCD, was obtained from the Mutant Mouse Regional Resource Center (MMRRC), a U.S. National Institutes of Health–funded strain repository, and was donated to the MMRRC by Genentech. This study was made possible by the financial support of the Diabetes Fonds (Dutch Diabetes Fund, Grant 2014.00.1784) and by the following foundations: Landelijke Stichting voor Blinden en Slechtzienden, Novartis Fonds, and St. MD Fonds, which contributed through UitZicht (Grant UitZicht 2014-33); the Nederlandse Vereniging ter Verbetering van het Lot der Blinden, Rotterdamse Stichting Blindenbelangen (Grant B20140050); and Stichting Blindenhulp. This study was published with the help of Edmond en Marianne Blaauw Fonds voor Oogheelkunde. The funding organizations had no role in the design or conduct of this research. They provided unrestricted grants. The authors declare no conflicts of interest.

Figures

Figure 1
Figure 1
Retinal PLVAP expression decreases during BRB development. A) Plvap mRNA levels were highest at P3 in the retinal vasculature and decreased from P3 to P25; n = 7–11 for all time points. Data are depicted as means ± sd. B) Immunolocalization of PLVAP protein was visualized using MECA-32 antibody (gray) in retinal wholemounts. Isolectin B4 (IB4, green) was used to stain the retinal vessels. PLVAP expression decreased over time. Scale bar, 200 µm. C) PLVAP was not expressed in the filopodia of tip cells. White line outlines MECA-32 expression (outlined with magic wand tool in ImageJ), and white arrows indicate filopodia. Images are captured of a retina at P3. Scale bar, 40 µm.
Figure 2
Figure 2
Expression of tight junctions increases during BRB development. A) mRNA levels of VE-cad, β-catenin, occludin, ZO-1, and claudin-5 in the retinal vasculature from P3 to P25. n = 7–11 for all time points. A.U., Arbitrary units. Data are depicted as means ± sd. B) Protein expression of claudin-5 (gray) in retinal wholemounts was present at all ages. Scale bar, 200 µm. C) At P5, claudin-5 (gray) was localized at the cell membrane, and its membrane expression increased at later time points. Retinal veins are shown. Scale bars, 10 µm (P5) and 50 µm (P25).
Figure 3
Figure 3
Reduced PLVAP expression delays retinal vascularization at P5. A) Plvap mRNA was below detection levels in retinal vasculature of Plvap+/− mice (HET), whereas expression levels were significantly higher in WT mice at P5 and P13. B) PLVAP protein expression was visualized in retinal wholemounts of WT and HET mice using MECA-32 (gray) at P5, 13, and 25. There is protein expression of PLVAP in HET retina at P5, although it is reduced compared with WT retina. Scale bar, 100 µm. C) Sprouting endothelial cells in the retina of HET mice have less filopodia compared with WT mice. Red dots indicate filopodia in the vascular sprouting front. D) Quantification of the number of filopodia per 100 µm vascular sprouting front was performed using ImageJ, as indicated in the Materials and Methods section; n = 5 for WT and n = 7 for HET. E) Retinal vascularization was imaged in retinal wholemounts of WT and HET mice using isolectin B4 (IB4, green) at P5, which was delayed in HET mice. F) Quantification of retinal vascularization at P5; n = 6 for WT and HET. Data are depicted as means ± sd; *P < 0.05, ***P < 0.01.
Figure 4
Figure 4
Reduced PLVAP expression does not alter vascular density. Vascular density of the retina was visualized with isolectin B4 in WT and Plvap+/− mice (HET) at P9 (A), P13 (B), and P25 (C) (left panels) and quantified in the central retina (right panels), using Matlab software; n = 3–5 per time point for HET and n = 4–8 per time point for WT. Scale bar, 200 µm. Data are depicted as means ± sd.
Figure 5
Figure 5
Reduced PLVAP expression affects retinal tight junctions. AD) mRNA levels of VE-cad (A), occludin (B), ZO-1 (C), and claudin-5 (D) in the retinal vasculature in WT and Plvap+/− (HET) mice at P5, P13, and P25; n = 7–8 for both groups at each time point. Data are depicted as means ± sd. *P < 0.05, **P < 0.01, ***P < 0.001. E, F) Protein expression of claudin-5 (gray) in retinal wholemounts of WT and HET mice at P5 (E) and P25 (F). A.U., Arbitrary units. Scale bars, 50 µm.
Figure 6
Figure 6
Reduced PLVAP expression affects BRB transport mechanisms. A) mRNA levels of caveolin-1 (cav-1) in the retinal vasculature of Plvap+/− (HET) and WT mice. B) Caveolin-1 protein expression (gray) was similar in retinal wholemounts of HET and WT mice at P5 and P25. A, artery; v, vein. Scale bars, 100 µm. C–I) mRNA levels of dynamin-1 (C), dynamin-2 (D), pacsin-2 (E), Flot1 (F), Flot2 (G), Mfsd2a (H), and Glut-1 (I) in the retinal vasculature of WT and HET mice of P5, 13, and 25; n = 7–8 for both groups at each time point. A.U., Arbitrary units. Data are depicted as means ± sd. *P < 0.05, **P < 0.01, ***P < 0.001.
Figure 7
Figure 7
PLVAP expression does not affect the number of caveolae in the retina. A, B) Caveolae were observed at the abluminal and luminal side of endothelial cells in WT (A) and Plvap+/− (HET) (B) mice at P30, as shown at the ultrastructural level with TEM. Scale bars, 500 nm. C) Quantification of the number of caveolae/µm in retinal capillaries at the luminal and abluminal side in WT and HET mice. EC, endothelial cell; L, lumen; LB, lamina basalis; N, nucleus; P, perivascular cell; TJ, tight junction; large arrow, abluminal caveolae; small arrow, luminal caveolae. Data are depicted as means ± sd.
Figure 8
Figure 8
Reduced PLVAP levels protect against VEGF- and histamine-induced vascular leakage. A modified Miles assay was performed in the dorsal skin of Plvap+/− (HET, n = 5) and WT (n = 5) mice treated with VEGF (200 ng), histamine (500 ng), and PBS as a control. A) MECA-32 was used to stain PLVAP in the flank vessels of WT and HET mice, showing that HET mice have reduced PLVAP expression (brown color) compared with WT mice. B) In WT mice, histamine and VEGF caused increased extravasation of EB, which was not the case in HET mice. Data are depicted as means ± sd. **P < 0.01. C) Representative images of skin injected with PBS, VEGF, or histamine in WT and HET mice.

References

    1. Antonetti D. A., Klein R., Gardner T. W. (2012) Diabetic retinopathy. N. Engl. J. Med. 366, 1227–1239 - PubMed
    1. Van der Wijk A. E., Vogels I. M. C., van Veen H. A., van Noorden C. J. F., Schlingemann R. O., Klaassen I. (2018) Spatial and temporal recruitment of the neurovascular unit during development of the mouse blood-retinal barrier. Tissue Cell 52, 42–50 - PubMed
    1. Gariano R. F. (2003) Cellular mechanisms in retinal vascular development. Prog. Retin. Eye Res. 22, 295–306 - PubMed
    1. Klaassen I., Van Noorden C. J., Schlingemann R. O. (2013) Molecular basis of the inner blood-retinal barrier and its breakdown in diabetic macular edema and other pathological conditions. Prog. Retin. Eye Res. 34, 19–48 - PubMed
    1. Klaassen I., Hughes J. M., Vogels I. M., Schalkwijk C. G., Van Noorden C. J., Schlingemann R. O. (2009) Altered expression of genes related to blood-retina barrier disruption in streptozotocin-induced diabetes. Exp. Eye Res. 89, 4–15 - PubMed

Publication types

LinkOut - more resources