. 2019 Apr 1;121(4):1207-1221.
doi: 10.1152/jn.00497.2018. Epub 2019 Jan 30.

Processing of object motion and self-motion in the lateral subdivision of the medial superior temporal area in macaques

Affiliations

Processing of object motion and self-motion in the lateral subdivision of the medial superior temporal area in macaques

Ryo Sasaki et al. J Neurophysiol. .

Abstract

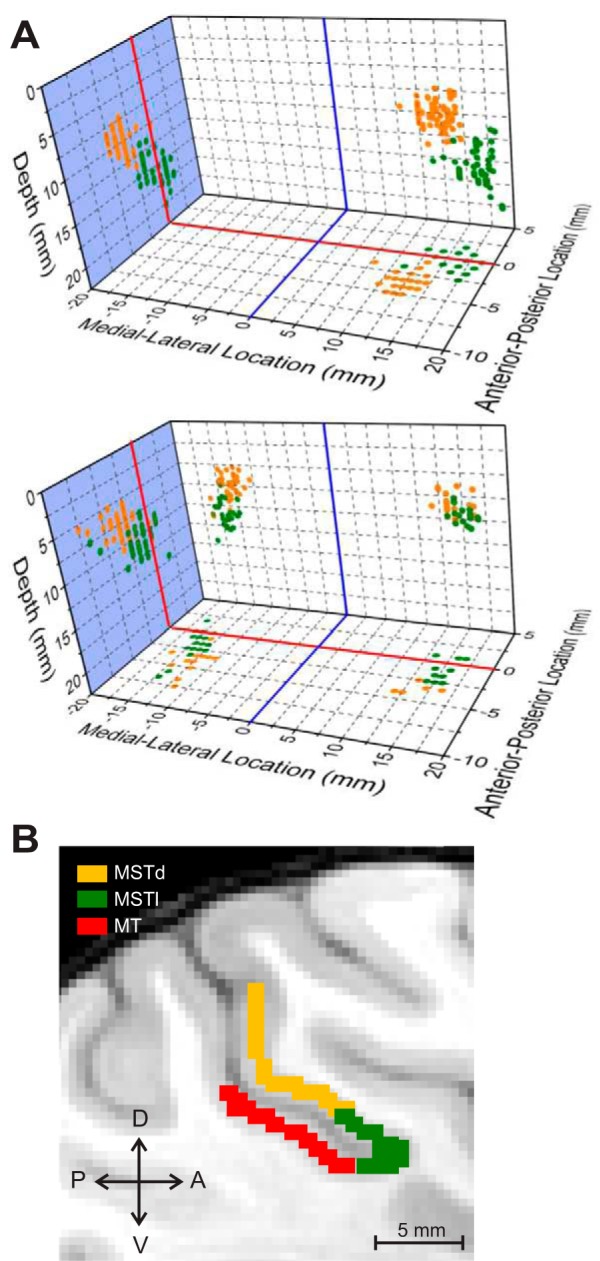
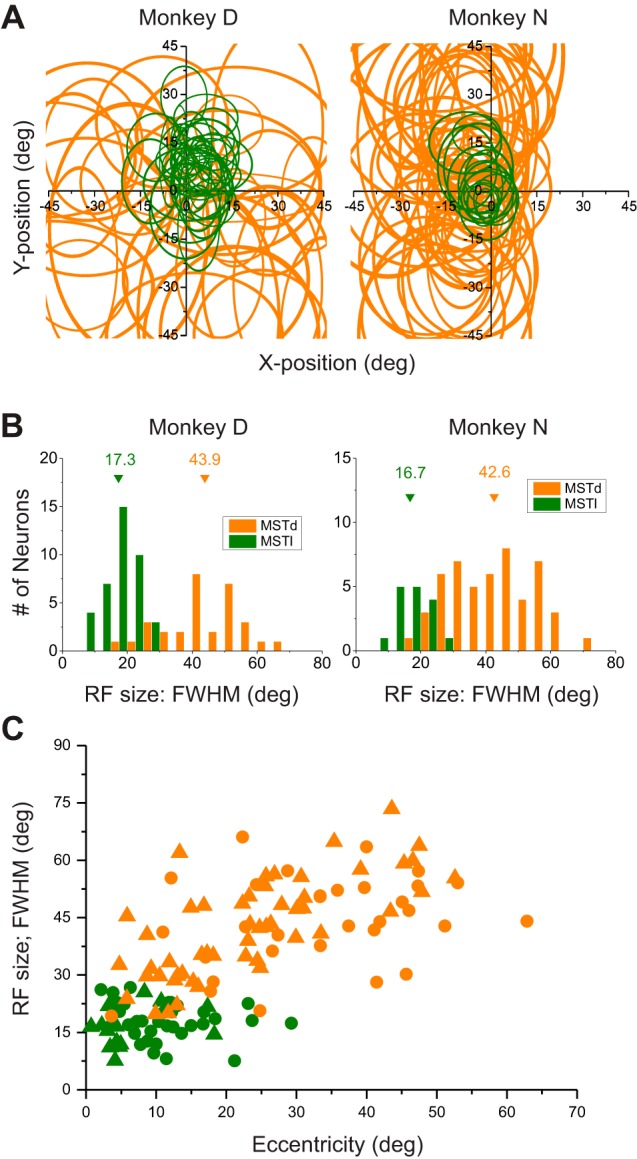
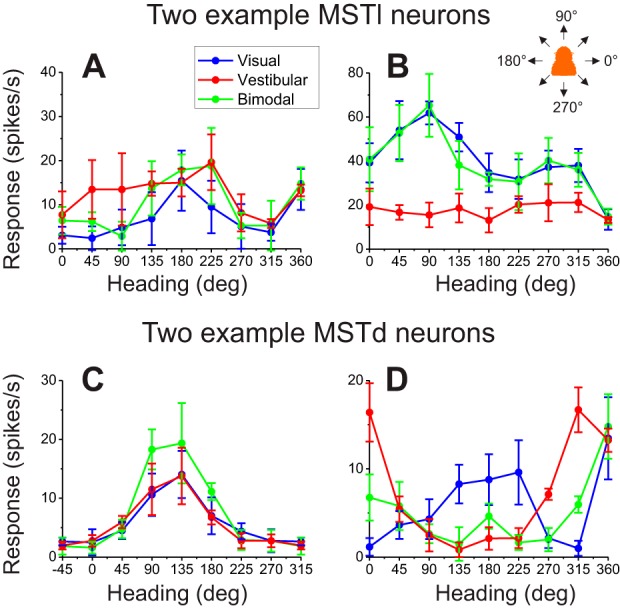
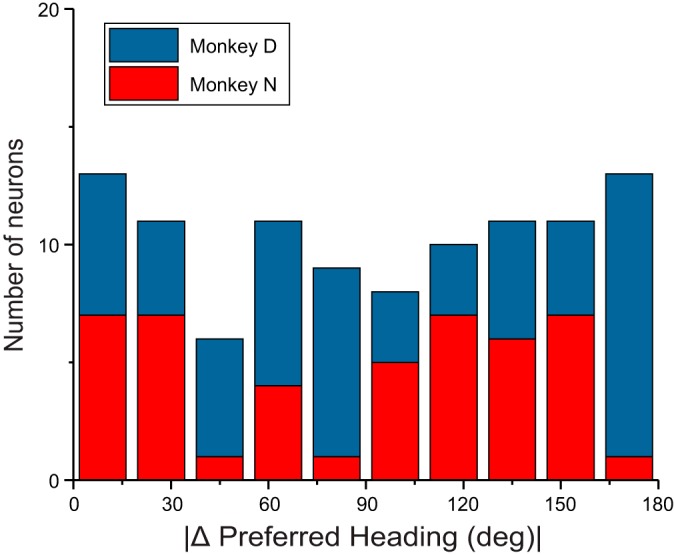
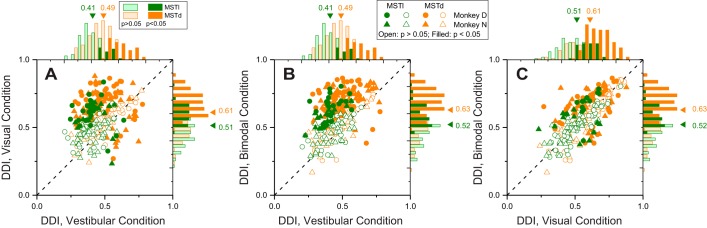
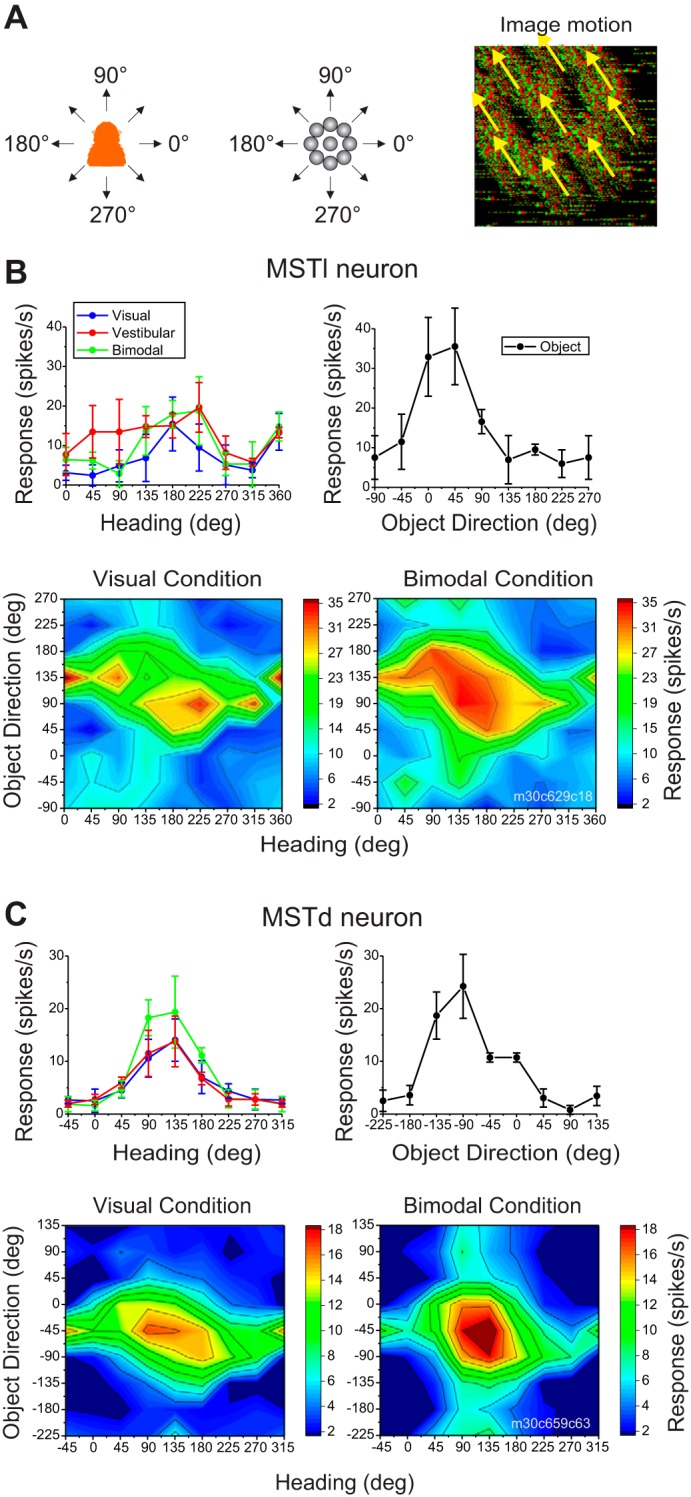
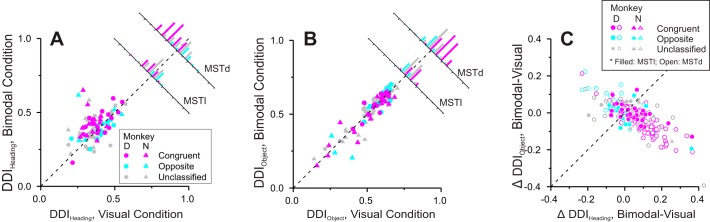
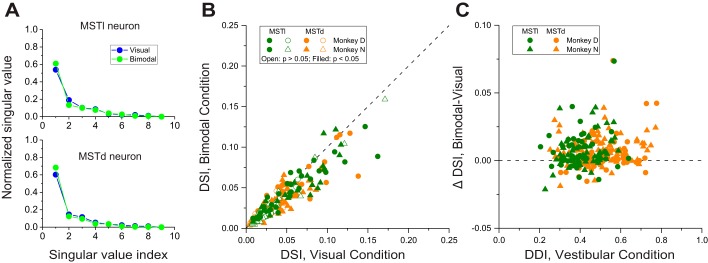
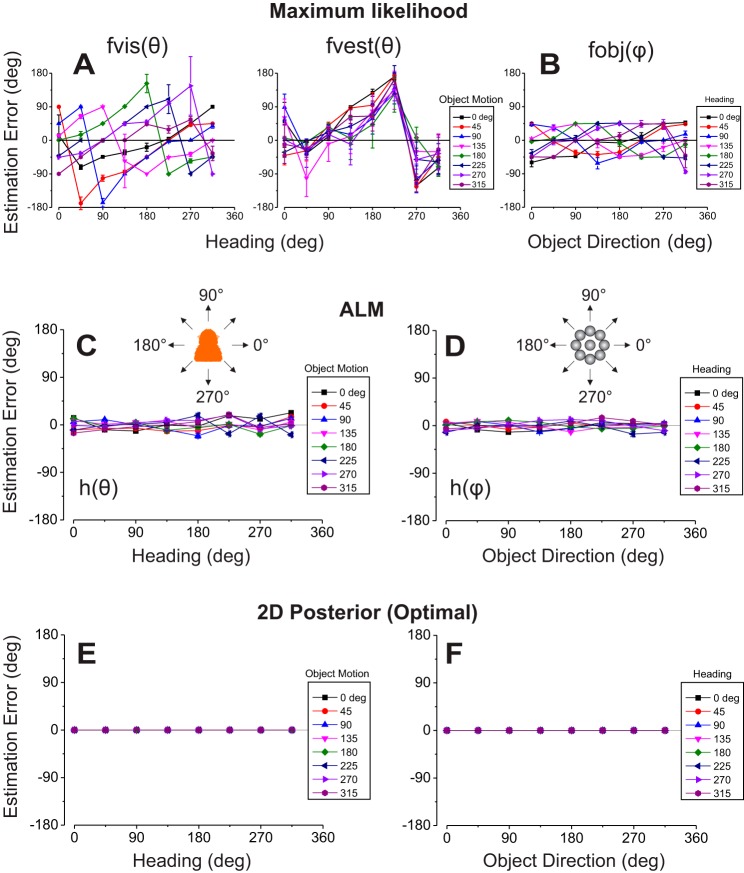
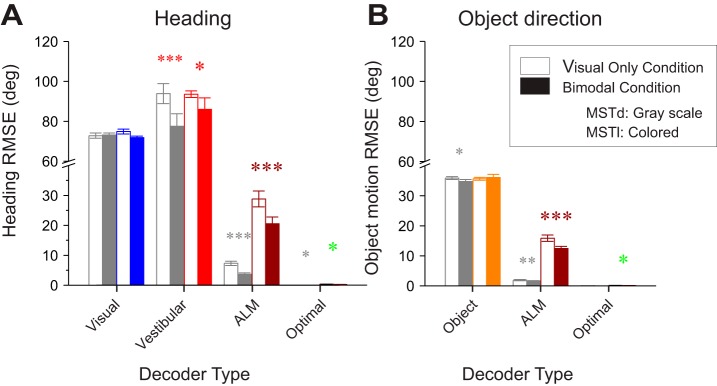
Multiple areas of macaque cortex are involved in visual motion processing, but their relative functional roles remain unclear. The medial superior temporal (MST) area is typically divided into lateral (MSTl) and dorsal (MSTd) subdivisions that are thought to be involved in processing object motion and self-motion, respectively. Whereas MSTd has been studied extensively with regard to processing visual and nonvisual self-motion cues, little is known about self-motion signals in MSTl, especially nonvisual signals. Moreover, little is known about how self-motion and object motion signals interact in MSTl and how this differs from interactions in MSTd. We compared the visual and vestibular heading tuning of neurons in MSTl and MSTd using identical stimuli. Our findings reveal that both visual and vestibular heading signals are weaker in MSTl than in MSTd, suggesting that MSTl is less well suited to participate in self-motion perception than MSTd. We also tested neurons in both areas with a variety of combinations of object motion and self-motion. Our findings reveal that vestibular signals improve the separability of coding of heading and object direction in both areas, albeit more strongly in MSTd due to the greater strength of vestibular signals. Based on a marginalization technique, population decoding reveals that heading and object direction can be more effectively dissociated from MSTd responses than MSTl responses. Our findings help to clarify the respective contributions that MSTl and MSTd make to processing of object motion and self-motion, although our conclusions may be somewhat specific to the multipart moving objects that we employed. NEW & NOTEWORTHY Retinal image motion reflects contributions from both the observer's self-motion and the movement of objects in the environment. The neural mechanisms by which the brain dissociates self-motion and object motion remain unclear. This study provides the first systematic examination of how the lateral subdivision of area MST (MSTl) contributes to dissociating object motion and self-motion. We also examine, for the first time, how MSTl neurons represent translational self-motion based on both vestibular and visual cues.

Keywords: object motion; population code; self-motion; visual cortex.


Conflict of interest statement

No conflicts of interest, financial or otherwise, are declared by the authors.

Figures

Fig. 1.
Fig. 1.
Summary of recording locations in medial superior temporal dorsal (MSTd) and medial superior temporal lateral (MSTl) areas. A: The 3-dimensional stereotaxic locations are plotted for our samples of 164 MSTd and 103 MSTl neurons. Red line represents the AP = 0 reference (interaural axis); blue line indicates the midline. Recording locations and depths for MSTd and MSTl are shown in orange and green, respectively. B: a para-sagittal plane MRI image from monkey N. Color bands indicate the approximate locations of MSTd (orange), MSTl (green), and the middle temporal (MT; red) area based on the parcellation scheme of Felleman and Van Essen (1991), as implemented by Caret software (Van Essen et al. 2001).
Fig. 2.
Fig. 2.
Comparison of receptive field (RF) properties between medial superior temporal dorsal (MSTd) and medial superior temporal lateral (MSTl) areas. A: graphic summary of receptive fields for neurons recorded in areas MSTd (orange ellipses; n = 82) and MSTl (green ellipses; n = 55) from 2 monkeys. Ellipses represent a cross-section through the best-fitting 2-dimensional (2D) Gaussian at half-maximal response amplitude. Coordinate (0,0) represents the center of the monitor and the location of the fixation target. B: histograms of RF size for MSTd (orange) and MSTl (green) neurons for each monkey. RF size was computed as the full width of the 2D Gaussian fit at half-maximal response (FWHM) and was the average of the FWHM for the horizontal and vertical dimensions. C: relationship between RF size and eccentricity for MSTd (orange) and MSTl (green). Circles and triangles denote data for monkeys D and N, respectively.
Fig. 3.
Fig. 3.
Sample heading tuning curves. Data are shown for 2 sample neurons from medial superior temporal lateral (MSTl) area (A and B) and 2 neurons from medial superior temporal dorsal (MSTd) area (C and D). In AD, heading tuning curves are shown for the visual (blue), vestibular (red), and bimodal (green) conditions. Error bars denote SE. A: a cell with congruent visual and vestibular heading tuning from MSTl. B: an MSTl neuron that lacks significant vestibular heading tuning. C: a congruent cell from MSTd. D: an opposite cell from MSTd.
Fig. 4.
Fig. 4.
Summary of relative heading preferences of visual and vestibular tuning for medial superior temporal lateral (MSTl) neurons. Histogram shows the distribution of the absolute difference in preferred heading [|Δ preferred heading (°)|] between the visual and vestibular self-motion conditions. Data are shown for all 103 neurons, and heading preferences were estimated by computing the vector sum of responses to 8 directions of motion in the fronto-parallel plane. Colors denote data for the 2 animals.
Fig. 5.
Fig. 5.
Population summary of multimodal heading selectivity for medial superior temporal lateral (MSTl; green) and medial superior temporal dorsal (MSTd; orange) areas. Data are shown for 103 MSTl neurons and 164 MSTd neurons. A: direction discrimination index (DDI) values for the visual condition are plotted against those for the vestibular condition. B: DDI values for the bimodal condition are plotted against those for the vestibular condition. C: DDI values for the bimodal condition are plotted against those for the visual condition. In each scatter plot, filled and open symbols represent neurons with and without significant differences, respectively, for the 2 conditions that are plotted (bootstrap; n = 1,000, P < 0.05). Circles and triangles denote data for monkeys D and N, respectively. Histograms along the top and right sides of each scatter plot show the marginal distributions of DDI. Filled and open bars represent neurons with and without significant DDI values, respectively (permutation test; n = 1,000, P < 0.05).
Fig. 6.
Fig. 6.
Interactions between self-motion and object motion for sample medial superior temporal dorsal (MSTd) and medial superior temporal lateral (MSTl) neurons. A: both the monkey (left) and the multipart object (middle) moved in one of 8 possible directions in the fronto-parallel plane. Image motion (right) is illustrated for the case of rightward self-motion (0°) and upward (90°) object motion in the world. B: heading-object interactions for a sample MSTl neuron. Top: heading tuning curves in the absence of object motion (visual: blue; vestibular: red; bimodal: green) are shown on the left, and the object motion tuning curve in the absence of self-motion (black) is shown on the right. Bottom: joint tuning profiles (color maps) for heading and object direction are shown for the visual (left) and bimodal (right) conditions. Response strength is color coded. C: heading-object interactions for a sample MSTd neuron; format is as in B.
Fig. 7.
Fig. 7.
Summary of the effect of vestibular signals on heading and object tuning. DDIheading and DDIobject denote the pooled direction discrimination index (DDI) metrics computed from joint heading/object tuning profiles. A: DDIheading for the bimodal condition is plotted against DDIheading for the visual condition; data in the scatter plot are from medial superior temporal lateral (MSTl) area. Colors denote congruent cells (magenta; n = 33), opposite cells (cyan; n = 21), and unclassified neurons (gray; n = 49). Circles and triangles indicate data for monkeys D and N, respectively. The inner diagonal histogram shows the distribution of the difference in DDIheading between the bimodal and visual conditions for MSTl. The outer diagonal histogram shows the corresponding data from medial superior temporal dorsal (MSTd) area (from Sasaki et al. 2017). B: DDIobject values for the visual and bimodal conditions are plotted in the same format as in A. C: the difference in DDIobject between bimodal and visual conditions (ordinate) is plotted against the difference in DDIheading between these 2 conditions (abscissa). Filled and open symbols denote data from MSTl (n = 103) and MSTd (n = 164), respectively.
Fig. 8.
Fig. 8.
Separability analysis of joint heading/object tuning profiles for medial superior temporal dorsal (MSTd) and medial superior temporal lateral (MSTl) neurons. A: the first 9 singular values from singular value decomposition (SVD) analysis of the joint tuning profiles for the MSTl and MSTd neurons shown in Fig. 6, B and C. The singular values are normalized such that they sum to unity. B: direction separability index (DSI) for the bimodal condition is plotted against DSI for the visual condition. For both MSTl (green; n = 103) and MSTd (orange; n = 164) cells, the addition of vestibular signals enhances the separability (reducing DSI for the bimodal condition) of joint tuning for heading and object motion. Circles and triangles indicate data for monkeys D and N, respectively. Open and filled symbols represent neurons without and with DSI values that are significantly different from zero in both the bimodal and visual conditions, respectively (bootstrap test; n = 1,000). C: the difference in DSI between the visual and bimodal conditions is plotted against the DDI value for vestibular heading tuning.
Fig. 9.
Fig. 9.
Heading and object direction estimation errors for different decoding schemes. Decoding was performed on balanced populations of 21 congruent and 21 opposite medial superior temporal lateral neurons. Results are shown averaged across 10 different populations of neurons comprising the 21 opposite cells and different random subsets of 21 congruent cells (chosen from the total of 33 congruent cells). A, left: heading estimation errors are plotted as a function of true heading when heading is decoded by computing likelihood functions based on the visual heading tuning of each neuron. Each color represents a different object motion direction. Right: heading errors are plotted for the case in which decoding is based on the vestibular tuning curve of each neuron. B: object motion errors are plotted for the case in which decoding is based on the object tuning curve of each neuron. Format is as in A. C: heading estimation errors, derived from approximate linear marginalization (ALM), are plotted as a function of true heading for each object motion direction (color coded). D: object direction estimation errors derived from ALM are plotted against true object direction for each heading. Format is as in C. E: heading estimation errors derived from computing the joint posterior (Eq. 6) and directly marginalizing over object direction. F: object direction estimation errors derived from the joint posterior. For each of the 10 different randomized populations of neurons, errors in each graph were averaged across 500 simulated trials for each distinct stimulus. Error bars represent SDs of the averaged errors across the 10 simulated populations.
Fig. 10.
Fig. 10.
Summary of heading and object direction estimation errors from decoding populations of medial superior temporal dorsal (MSTd) and medial superior temporal lateral (MSTl) neurons. Color-filled bars represent results from decoding MSTl neurons, and gray bars represent corresponding results from decoding MSTd neurons (from Sasaki et al. 2017). A: root mean square heading error (RMSE) averaged across all different headings and object motion directions is shown for the following methods of decoding: likelihood computation according to visual heading tuning (blue), likelihood computation according to vestibular tuning (red), approximate linear marginalization (ALM; brown), and direct marginalization of the joint posterior (green, but not visible because errors are essentially zero). Filled and open bars represent results for the bimodal and visual conditions, respectively. Error bars represent 95% confidence intervals across the 10 different populations with different random subsets of congruent cells. B: RMSE for object direction estimation based on likelihood computation using object tuning curves (orange), ALM (brown), and direct marginalization of joint posterior (green). Format is as in A. *P < 0.05; **P < 0.01; ***P < 0.001.

Similar articles

Cited by

References

    1. Andersen RA. Neural mechanisms of visual motion perception in primates. Neuron 18: 865–872, 1997. doi:10.1016/S0896-6273(00)80326-8. - DOI - PubMed
    1. Beck JM, Latham PE, Pouget A. Marginalization in neural circuits with divisive normalization. J Neurosci 31: 15310–15319, 2011. doi:10.1523/JNEUROSCI.1706-11.2011. - DOI - PMC - PubMed
    1. Bishop CM. Pattern Recognition and Machine Learning. New York: Springer, 2006.
    1. Born RT, Bradley DC. Structure and function of visual area MT. Annu Rev Neurosci 28: 157–189, 2005. doi:10.1146/annurev.neuro.26.041002.131052. - DOI - PubMed
    1. Bremmer F. Multisensory space: from eye-movements to self-motion. J Physiol 589: 815–823, 2011. doi:10.1113/jphysiol.2010.195537. - DOI - PMC - PubMed

Publication types

LinkOut - more resources