. 2019 Apr 1;121(4):1150-1161.
doi: 10.1152/jn.00686.2018. Epub 2019 Jan 30.

Theta/delta coupling across cortical laminae contributes to semantic cognition

Affiliations

Theta/delta coupling across cortical laminae contributes to semantic cognition

Natalie E Adams et al. J Neurophysiol. .

Abstract

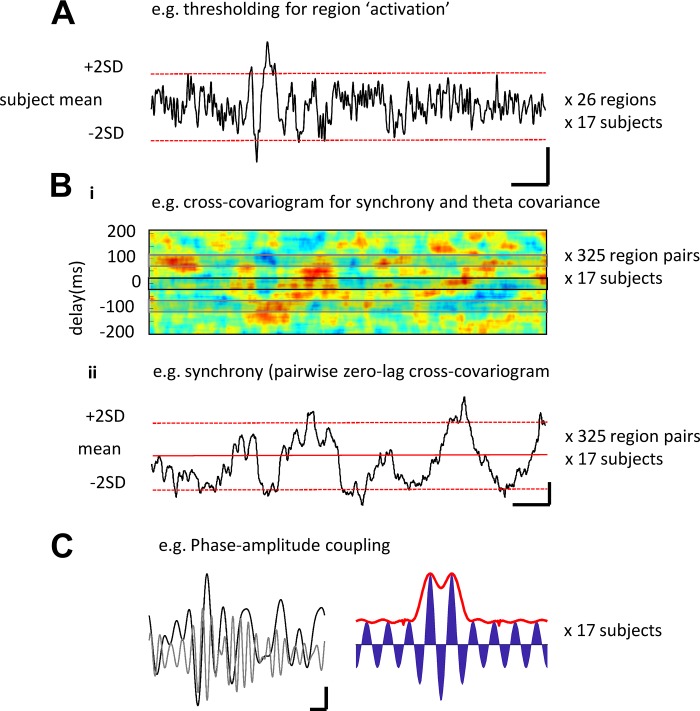
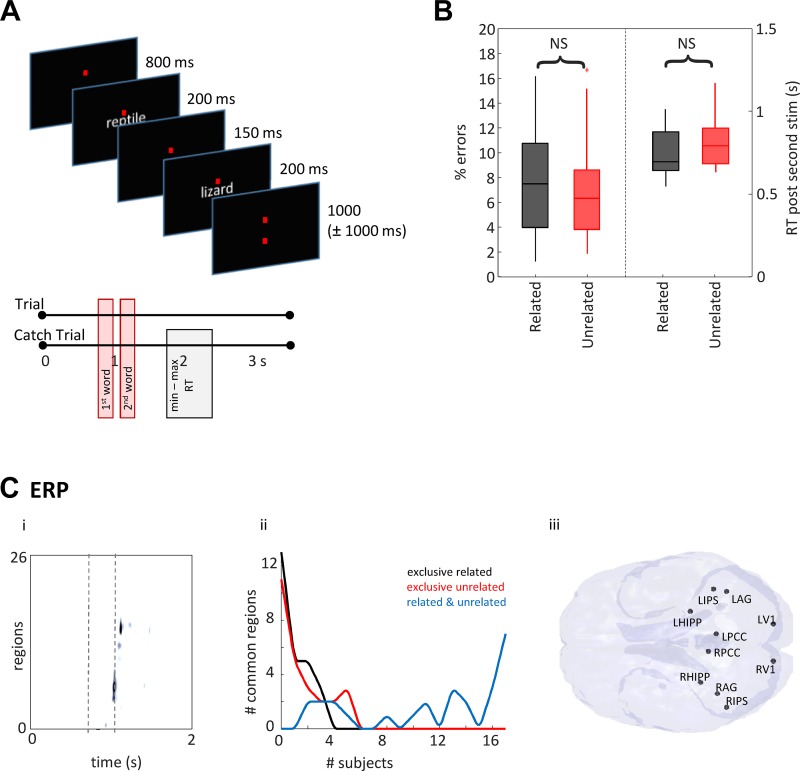
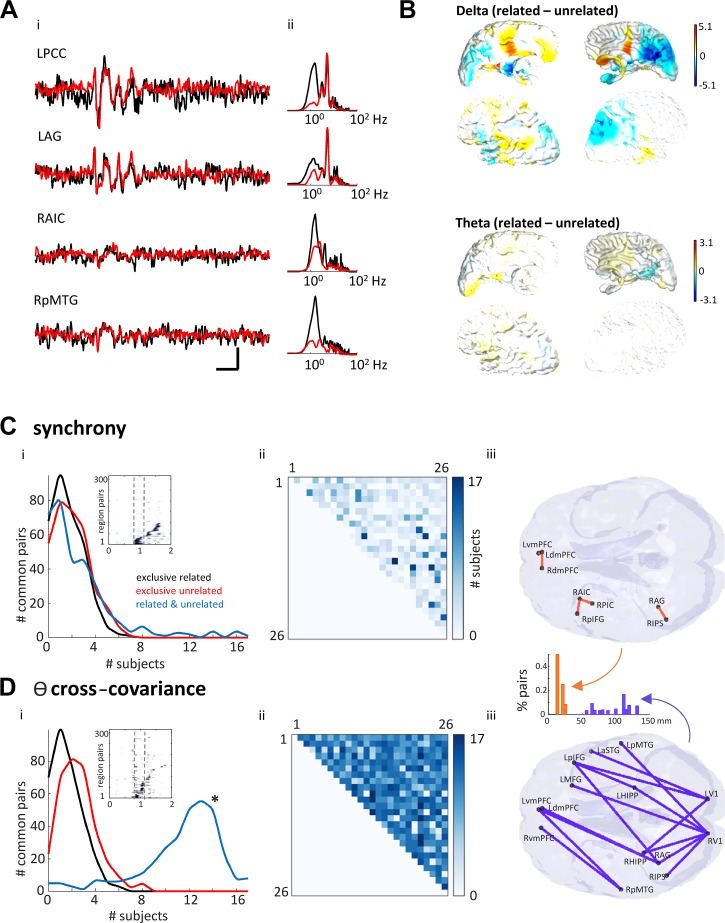
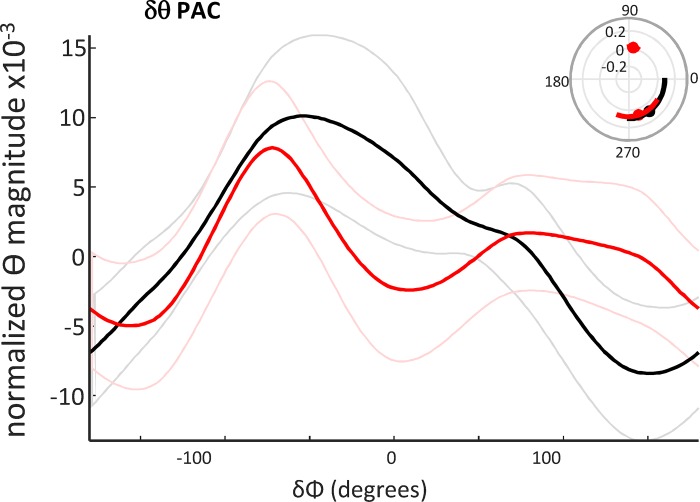
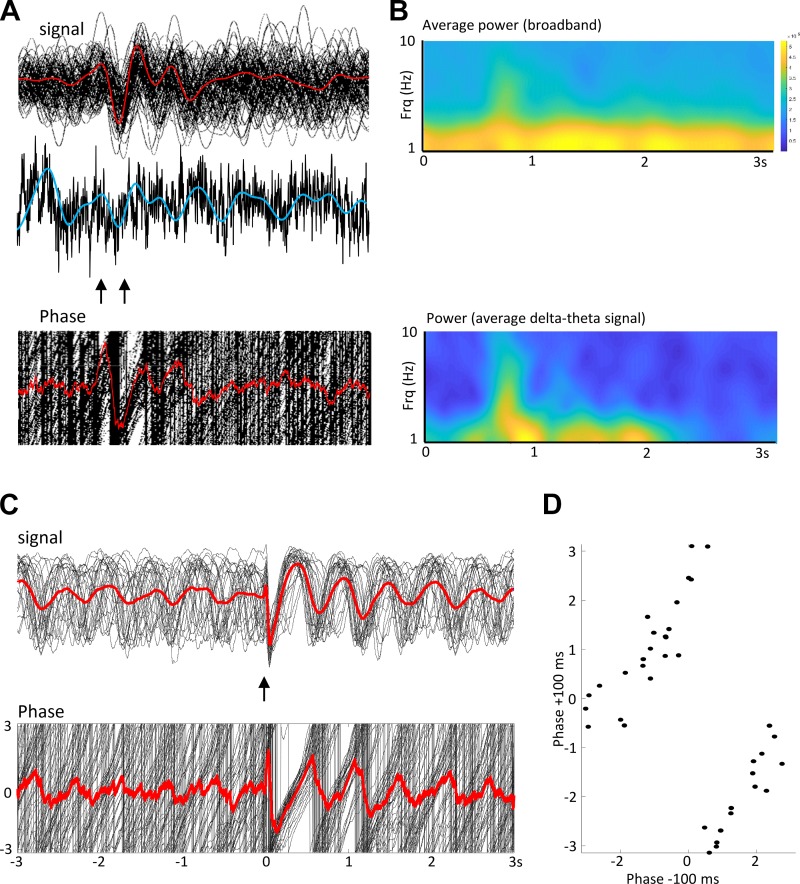
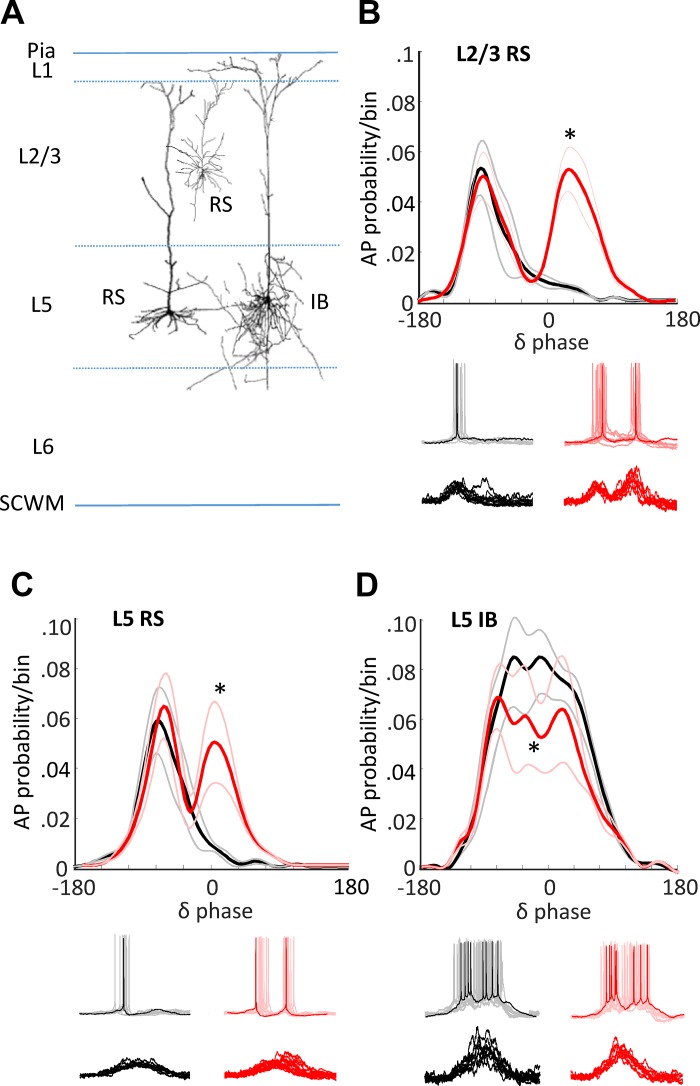
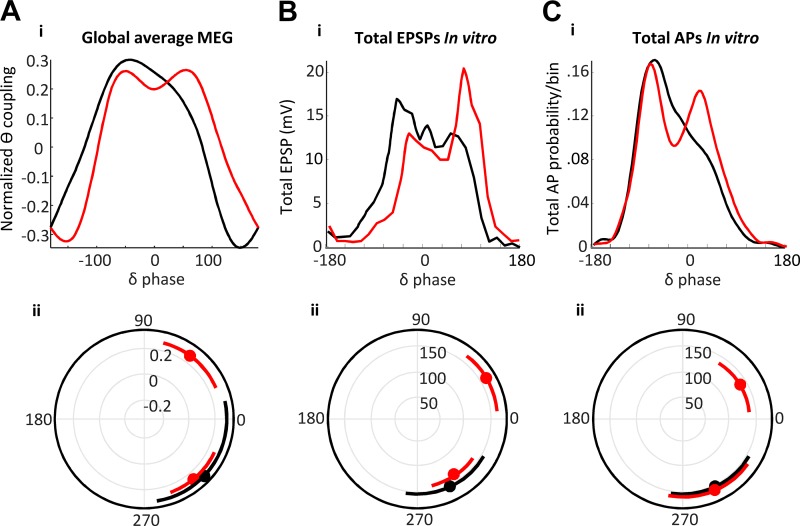
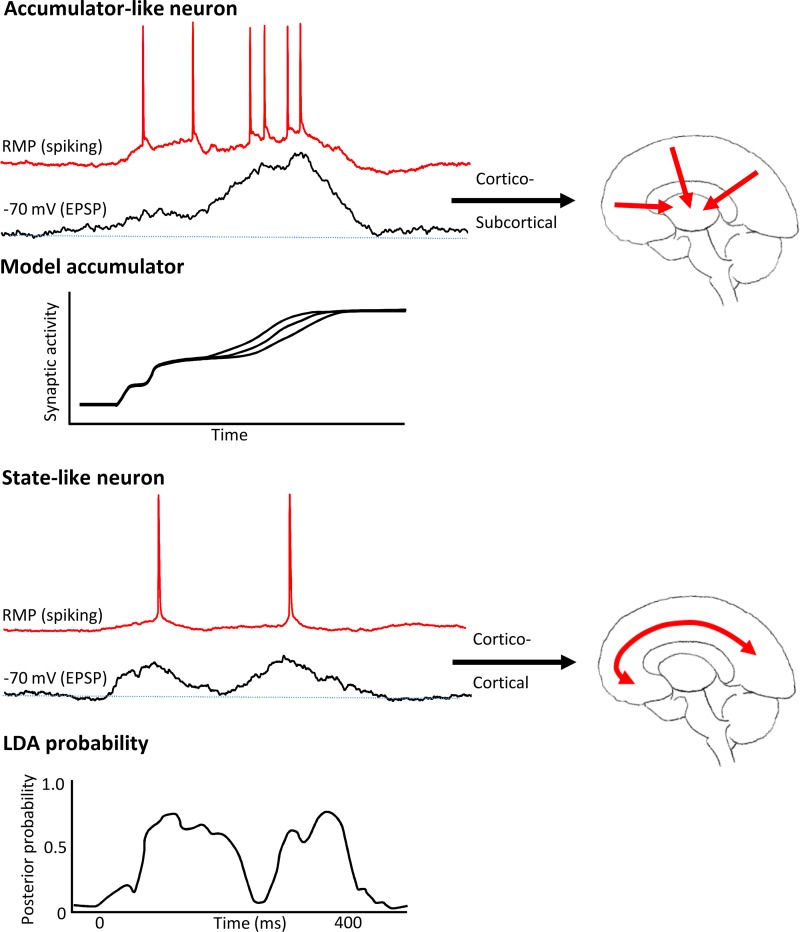
Rhythmic activity in populations of neurons is associated with cognitive and motor function. Our understanding of the neuronal mechanisms underlying these core brain functions has benefitted from demonstrations of cellular, synaptic, and network phenomena, leading to the generation of discrete rhythms at the local network level. However, discrete frequencies of rhythmic activity rarely occur alone. Despite this, little is known about why multiple rhythms are generated together or what mechanisms underlie their interaction to promote brain function. One overarching theory is that different temporal scales of rhythmic activity correspond to communication between brain regions separated by different spatial scales. To test this, we quantified the cross-frequency interactions between two dominant rhythms-theta and delta activity-manifested during magnetoencephalography recordings of subjects performing a word-pair semantic decision task. Semantic processing has been suggested to involve the formation of functional links between anatomically disparate neuronal populations over a range of spatial scales, and a distributed network was manifest in the profile of theta-delta coupling seen. Furthermore, differences in the pattern of theta-delta coupling significantly correlated with semantic outcome. Using an established experimental model of concurrent delta and theta rhythms in neocortex, we show that these outcome-dependent dynamics could be reproduced in a manner determined by the strength of cholinergic neuromodulation. Theta-delta coupling correlated with discrete neuronal activity motifs segregated by the cortical layer, neuronal intrinsic properties, and long-range axonal targets. Thus, the model suggested that local, interlaminar neocortical theta-delta coupling may serve to coordinate both cortico-cortical and cortico-subcortical computations during distributed network activity. NEW & NOTEWORTHY Here, we show, for the first time, that a network of spatially distributed brain regions can be revealed by cross-frequency coupling between delta and theta frequencies in subjects using magnetoencephalography recording during a semantic decision task. A biological model of this cross-frequency coupling suggested an interlaminar, cell-specific division of labor within the neocortex may serve to route the flow of cortico-cortical and cortico-subcortical information to promote such spatially distributed, functional networks.

Keywords: cross-frequency coupling; delta rhythm; semantic processing; theta rhythm.


Conflict of interest statement

No conflicts of interest, financial or otherwise, are declared by the authors.

Figures

Fig. 1.
Fig. 1.
Example of methods used to quantify activity alone and by phase of delta and theta oscillation. A: example trace showing a single region’s mean (over trials) response pattern. Activation of the region was quantified as deviations of the magnetoencephalography (MEG) signal greater than 2SDs above the mean. Scale bar: 2 nA·m, 200 ms. B, i: example cross-covariogram (meaned over trials) for a single pair of regions in one subject over the time course shown for A). Time-variant cross-covariance was taken either at 0-ms delay or one half a theta period delay. B, ii: example of a time-variant cross-correlation at 0 ms from B, I, illustrating the thresholding used to define coactivation. Scale bar: 0.2 normalized covariance units, 200 ms. C, left: example delta (black line) and theta (gray line) bandpassed activity (1–4 Hz and 4.5–7.5 Hz, respectively). Data show the averages for all left cortical regions for one subject. Scale bar: 0.5 nA·m, 200 ms. Right: simulation of the effect of theta magnitude modulation (blue) by a single “delta” Gaussian. The resulting phase-amplitude coupling metric is shown in red.
Fig. 2.
Fig. 2.
Raw response magnitude demonstrates common regions related to subjective task performance but does not predict outcome. A: pictorial examples from the task. B: percentage errors and reaction times after second stimulus for all subjects for the two conditions—related (black) and unrelated (red). C, i: an example of region activity changes with time. Data from one subject, averaged for “related” trials is displayed as colormap where regions form each row (arranged by time to maximal response). Trial time is along the x-axis and magnetoencephalography (MEG) region activations (>2 SD) are on the color axis. Times for stimulus onset are shown as dashed lines. Note region numbers (y-axis) were reorganized by time of initial activation and do not represent the numbers given in methods. C, ii: plot shows the number of active regions (>2 SDs from the mean signal from 0.8 to 2.0 s) across subject. Note no regions were common to more than 7/17 subjects when considering outcome (“related”—black line, “unrelated”—red line, “related” and “unrelated”—blue line). C, iii: map shows the location of each of the 10 regions found common to >15 subjects (94%) overlaid on a horizontal brain representation viewed from below.
Fig. 3.
Fig. 3.
Synchrony and theta covariance differentially demonstrate common region pairs related to subjective task performance but do not predict outcome. A: average waveform (left) and spectrograms (right) for four example regions [left posterior cingulate cortex (LPCC), left angular gyrus (LAG), right anterior insular cortex (RAIC), and right posterior middle temporal gyrus (RpMTG)] averaged over all trials for one example in one subject for the related (black) and unrelated (red) conditions. Scale bar: 200 ms, 2 nA·m. B: mean (by subject) difference between “related” and “unrelated” delta and theta power shown as colormap of percent difference calculated for each point of grid of beamformed nodes with 5-mm spacing throughout the brain. Note that none of these regional differences was significant when corrected for multiple comparisons [family-wise error (FWE): P < 0.05 in specialized proresolving mediators (SPM)]. C, i: pairwise, normalized cross-covariance between regions demonstrated trajectories of synchrony above threshold (>2 SDs) from stimulus presentation (inset). Note region numbers (y-axis) were reorganized by time of initial activation and do not represent the numbers given in methods. Main graph shows number of region pairs with correlations >2 SDs above mean for each behavioral outcome. No synchronous region pairs were common to >8 subjects when separated into outcome (“related”—black line, “unrelated”—red line). 0-ms synchrony showed only five region pairs interacted in >15 subjects when considering task (blue line). C, ii: cross-covariance matrix of all region pairs, color-mapped onto commonality across the subject pool. C, iii: location of each of the five region pairs common to >15 (94%) of subjects. D, i: theta covariance between regions demonstrated trajectories from stimulus presentation (inset). Main graph shows number of region pairs with theta-lagged correlations >2 SDs above mean for each behavioral outcome. Theta covariance showed 14 region pairs interacted in >15 subjects when considering task (blue line). D, ii: cross-covariance matrix of all region pairs, color-mapped onto commonality across subjects. Dark colors compared with light colors indicate commonality in greater numbers of subjects. D, iii: location of each of the 14 region pairs common to >15 (94%) or subjects. Inset shows the distribution of interregional distances for interacting regions in each case. Note the significant (P < 0.05) shift from short- to long-distance functional connections when considering theta covariance (orange) versus synchrony (purple).
Fig. 4.
Fig. 4.
The profile of delta/theta phase amplitude coupling predicted semantic interpretation. Phase-amplitude coupling of region-averaged data, filtered for theta magnitude (4.5–7.5 Hz), with reference to the mean delta rhythm phase. The cross-frequency coupling profiles were significantly different (P < 0.05, n = 17, Kologmorov-Smirnov) when comparing activity before a “related” (black) versus an “unrelated” (red) interpretation. Inset: significant phase-amplitude coupling (PAC) epochs polar plotted by delta phase.
Fig. 5.
Fig. 5.
Stimulus-induced delta rhythms are generated by phase reset. A: example of nonaveraged single traces from a single subject (n = 92 trials). Top: beamformed signal from left angular gyrus (LAG). Individual trial responses are shown in black, and average trial responses are shown in red. Stimuli were presented at the times indicated by the arrows. Middle: single example of raw data (black) and the corresponding filtered data (blue) to illustrate the continual presence of delta activity pretrial and posttrial. Bottom: phase for each of the 92 signals (black) and the average phase (red). B: spectrograms were constructed from A in two different ways: Upper spectrogram shows the power in the broadband signal derived from the average of each single trial, while the lower spectrogram shows the power from the averaged signal. Note the stimulus-induced delta power increase is only apparent from the average signal, the actual delta activity is persistent. C: in vitro model of persistent delta rhythms reproduced the stimulus-induced phase reset of persistent delta rhythms. Top: signal from parietal cortex aligned to electrical stimulus is shown, with stimulation of thalamus occurring in thalamocortical slices. Individual signals are shown in black, whereas the stimulus-aligned average is shown in red. Lower figure shows the corresponding phase of the recorded oscillation. D: phase reset plot for thalamic input to parietal cortex in the model. Note the highly linear, “near-absolute” nature of the phase reset.
Fig. 6.
Fig. 6.
Biological model of concurrent theta/delta activity reproduces magnetoencephalography (MEG) outcome-specific dynamics via altered cholinergic excitation. A: schematic of cells targeted in the in vitro parietal cortex slice. Regularly spiking (RS) neurons were recorded in layers 2 and 3 and layer 5. Intrinsically bursting (IB) neurons were recorded in layer 5. Spontaneous delta activity was recorded in the presence of cholinergic agonist (carbachol) at two different concentrations (2 μM, black lines, 6 μM, red lines). B: means ± SE probability of action potential generation in layers 2 and 3 RS neurons binned according to phase of layer 5 field potential delta rhythm. *Significantly larger action potential probabilities (P < 0.05; n = 10 replicates per n = 5 slices/neurons) were seen for the higher level of cholinergic excitation from 30° to 90°. Example traces show activity at resting membrane potential (spikes, upper examples) and at −70 mV [excitatory postsynaptic potentials (EPSPs), lower examples]. C: similar profile of action potential output changes was seen when comparing outputs from layer 5 RS neurons. D: action potential bursts dominated layer 5 IB neuron activity. Elevated cholinergic excitation significantly reduced these burst outputs (*P < 0.05; n = 10 replicates per n = 5 slices/neurons).
Fig. 7.
Fig. 7.
Neuronal EPSP (input) and action potential generation (output) profiles match theta/delta cross-frequency coupling profile differences for “related” versus “unrelated” semantic interpretations. Decision-dependent differences in magnetoencephalography (MEG) theta-delta cross-frequency coupling (A) were not significantly different from the mean excitatory postsynaptic potential (EPSP) profiles (B) and action potential (C) profiles pooled from all three neuron subtypes (P > 0.05, Kologmorov-Smirnov, MEG “related” versus model lower cholinergic excitation (black), and MEG “unrelated” versus model higher cholinergic excitation (red). Lower graphs show polar plots for values in the upper-quartile range of the distribution. Note the presence of an additional peak later in the delta period when comparing the two outcomes and model conditions.
Fig. 8.
Fig. 8.
Biological model predicts theta rhythm involvement in cortico-cortical communication and delta rhythm involvement in cortical-subcortical communication. Top: layer 5 intrinsically bursting (IB) neuronal behavior in the experimental model of coupled theta and delta activity displayed overt ramplike excitatory postsynaptic potentials (EPSPs), indicative of increasing synaptic drive during the active part of one delta rhythm duty cycle. This behavior resembled that of accumulator neurons used to model decision making. These neurons are all subcortically projecting in the neocortex (Groh et al. 2010; Kim et al. 2015). Accumulator model figure was adapted from Hunt et al. 2012. Bottom: layer 5 and layers 2 and 3 regularly spiking (RS) neuronal behavior in the experimental model showed state-like changes in action potential output probabilities driven by multiple EPSP inputs in a manner dependent on subsequent decision. Similar changes in the probability of neuronal activity were reported for frontal cortical neurons using linear discriminant analysis (LDA) of unit activity. LDA probability figure adapted from Rich and Wallis (2016) with permission from Springer Nature [Nat Neurosci, Decoding subjective decisions from orbitofrontal cortex, Rich EL and Wallis JD, 2016]. Regularly spiking neurons are exclusively cortico-cortical projecting neurons.

References

    1. Abeles M. Neural codes for higher brain function. In: Information Processing by the Brain, edited by Markowitsch HJ. Stuttgart, Germany: Hans Huber, 1988, p. 225–238.
    1. Acquas E, Wilson C, Fibiger HC. Conditioned and unconditioned stimuli increase frontal cortical and hippocampal acetylcholine release: effects of novelty, habituation, and fear. J Neurosci 16: 3089–3096, 1996. doi:10.1523/JNEUROSCI.16-09-03089.1996. - DOI - PMC - PubMed
    1. Akam T, Kullmann DM. Oscillations and filtering networks support flexible routing of information. Neuron 67: 308–320, 2010. doi:10.1016/j.neuron.2010.06.019. - DOI - PMC - PubMed
    1. Arnal LH, Giraud AL. Cortical oscillations and sensory predictions. Trends Cogn Sci 16: 390–398, 2012. doi:10.1016/j.tics.2012.05.003. - DOI - PubMed
    1. Aru J, Aru J, Priesemann V, Wibral M, Lana L, Pipa G, Singer W, Vicente R. Untangling cross-frequency coupling in neuroscience. Curr Opin Neurobiol 31: 51–61, 2015. doi:10.1016/j.conb.2014.08.002. - DOI - PubMed

Publication types