. 2019 Jan 30;14(1):e0210339.
doi: 10.1371/journal.pone.0210339. eCollection 2019.

Sporosarcina pasteurii can form nanoscale calcium carbonate crystals on cell surface

Affiliations

Sporosarcina pasteurii can form nanoscale calcium carbonate crystals on cell surface

Tanushree Ghosh et al. PLoS One. .

Abstract

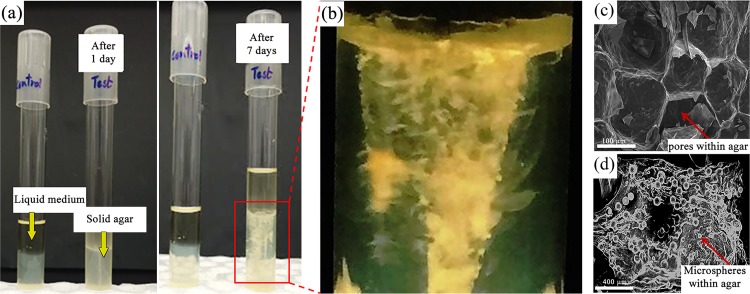
The bacterium Sporosarcina pasteurii (SP) is known for its ability to cause the phenomenon of microbially induced calcium carbonate precipitation (MICP). We explored bacterial participation in the initial stages of the MICP process at the cellular length scale under two different growth environments (a) liquid culture (b) MICP in a soft agar (0.5%) column. In the liquid culture, ex-situ imaging of the cellular environment indicated that S. pasteurii was facilitating nucleation of nanoscale crystals of calcium carbonate on bacterial cell surface and its growth via ureolysis. During the same period, the meso-scale environment (bulk medium) was found to have overgrown calcium carbonate crystals. The effect of media components (urea, CaCl2), presence of live and dead in the growth medium were explored. The agar column method allows for in-situ visualization of the phenomena, and using this platform, we found conclusive evidence of the bacterial cell surface facilitating formation of nanoscale crystals in the microenvironment. Here also the bulk environment or the meso-scale environment was found to possess overgrown calcium carbonate crystals. Extensive elemental analysis using Energy dispersive X-ray spectroscopy (EDS) and X-ray powder diffraction (XRD), confirmed that the crystals to be calcium carbonate, and two different polymorphs (calcite and vaterite) were identified. Active participation of S. pasteurii cell surface as the site of calcium carbonate precipitation has been shown using EDS elemental mapping with Scanning transmission electron microscopy (STEM) and scanning electron microscopy (SEM).


Conflict of interest statement

The authors have declared that no competing interests exist.

Figures

Fig 1
Fig 1. Parametric evaluation of the MICP phenomenon by S. pasteurii in liquid media.
Phenol red was used as pH indicator dye in culture tubes showing the final pH after 24h of culture. The text indicates the initial culture condition (see also Table 1).
Fig 2
Fig 2. SEM images showing the effects of culture conditions on precipitate morphology.
(a) Effect of initial pH of NBUC medium (NBUC-9SPlive) showing bacteria bound to crystalline microspheres. (b) Zoomed in section of (a). (c) Typical calcite precipitation in NBUC-9SPdead medium with dead S. pasteurii cells. The zoomed in image (d) showing orthorhombic crystal structure of precipitates (e) precipitation induced by Urease (EC 3.5.1.5) supplemented condition (NBUC-7 Urease) where bacteria were absent. (f) zoomed in section of (e).
Fig 3
Fig 3. SEM and EDS analysis of S. pasteurii.
(a-b) SEM images of S. pasteurii control cells from NBC-7SPlive showing bacterial cells with no evidence of crystalline deposits on the cell wall. (c) EDS spectra collected on (b). (d-e) SEM images of S. pasteurii cells from NBUC-7SPlive clearly showing presence of crystalline deposits on the cell-wall. (f) EDS spectra collected on (e) and clearly showing presence of Ca.
Fig 4
Fig 4. STEM-BF and DF images and EDS elemental mapping on single S. pasteurii cells.
(a) STEM-BF image of S. pasteurii cells from NBC-7SPlive. (b) zoomed in STEM-DF image at boxed site (c) A cumulative map created by overlaying EDS elemental mapping of (b). c(i-iii) show individual elemental distribution map for C, O and Ca along the S. pasteurii cell surface. (d) STEM-BF image of S. pasteurii cell from NBUC-7SPlive. (e) zoomed in STEM-DF image at boxed site (f) cumulative overlaid map f(i-iii) show individual elemental distribution map for C, O and Ca along the S. pasteurii cell surface.
Fig 5
Fig 5. STEM and extracted line profile of CaCO3 deposited on S. pasteurii cell surface.
The dark field TEM images representing the control S. pasteurii cell from NBC medium (a) and from NBUC medium (c). Scale bar is 500 nm. The area demarcated by the blue rectanges is the area where corresponding element intensities were integrated and presented along the middle blue line for a distance of 2 μm. The (b and d) EDS line scan showing the extracted intensity profile for K series of C, O and Ca. Solid lines (b) showing C, O and Ca intensities obtained from NBC-7SPlive cell surface where dashed line (d) intensiy profile for NBUC-7SPlive cell surface.
Fig 6
Fig 6
MICP in agar column (a) Two samples containing the semi-solid 0.5% agar medium in two identical 20 mL test tubes. The one to the left is the control sample which is devoid of any bacterial cells. To the right is the S. pasteurii inoculated sample where the resulting mineral precipitation has left a conspicuous trail. Images were taken after 1 day and 7 days of the inoculation. (b) Blown out magnified image of the mineral deposition. (c-d) SEM image of agar showing pores in control set (c) and numerous mineral microspheres after 7 days (d) of incubation.
Fig 7
Fig 7. Optical and electron microscopy images of semi-solid agar grown CaCO3 microspheres and its XRD pattern.
(a) TEM images of CaCO3 microspheres deposited far from SP cells (macro-environment) (b) An optical microscopy image and an ultrathin (80 nm) section of agar column with CaCO3 microspheres, stained with crystal violet. (c) TEM image of a portion of the ultrathin (80 nm) section. (inset) The SAED pattern of the crystalline structure. (d) XRD plot indicates the formation of calcite and vaterite polymorphs. (inset) clearly demonstrates presence of vaterite.
Fig 8
Fig 8. TEM images of ultrathin sections of the agar medium depicting the presence of S. pasteurii cells with cell surface depositions of nanometer sized CaCO3.

References

    1. Stocks-Fischer S, Galinat JK, Bang SS. Microbiological precipitation of CaCO 3. Soil Biology and Biochemistry. 1999;31(11):1563–1571.
    1. Warren LA, Maurice PA, Parmar N, Ferris FG. Microbially mediated calcium carbonate precipitation: implications for interpreting calcite precipitation and for solid-phase capture of inorganic contaminants. Geomicrobiology Journal. 2001;18(1):93–115.
    1. De Muynck W, De Belie N, Verstraete W. Microbial carbonate precipitation in construction materials: a review. Ecological Engineering. 2010;36(2):118–136.
    1. Sarikaya M. Biomimetics: materials fabrication through biology. Proceedings of the National Academy of Sciences. 1999;96(25):14183–14185. - PMC - PubMed
    1. Thompson J, Ferris F. Cyanobacterial precipitation of gypsum, calcite, and magnesite from natural alkaline lake water. Geology. 1990;18(10):995–998.

Publication types

MeSH terms

LinkOut - more resources