. 2019 Jan 30;14(1):e0209665.
doi: 10.1371/journal.pone.0209665. eCollection 2019.

The type III intermediate filament vimentin regulates organelle distribution and modulates autophagy

Affiliations

The type III intermediate filament vimentin regulates organelle distribution and modulates autophagy

Olga Biskou et al. PLoS One. .

Abstract

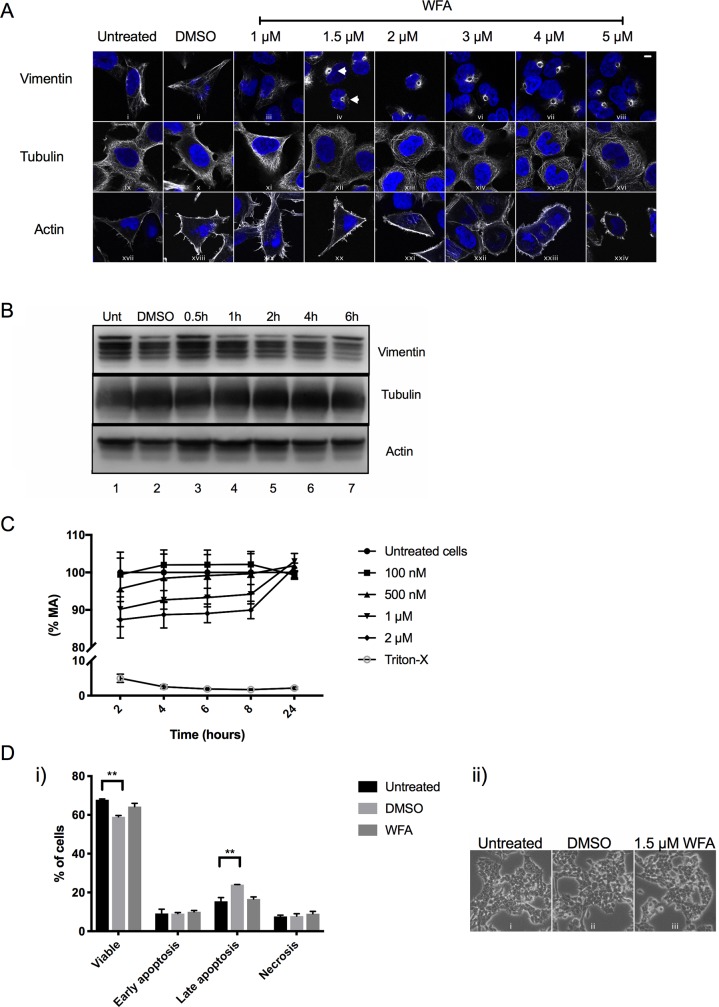
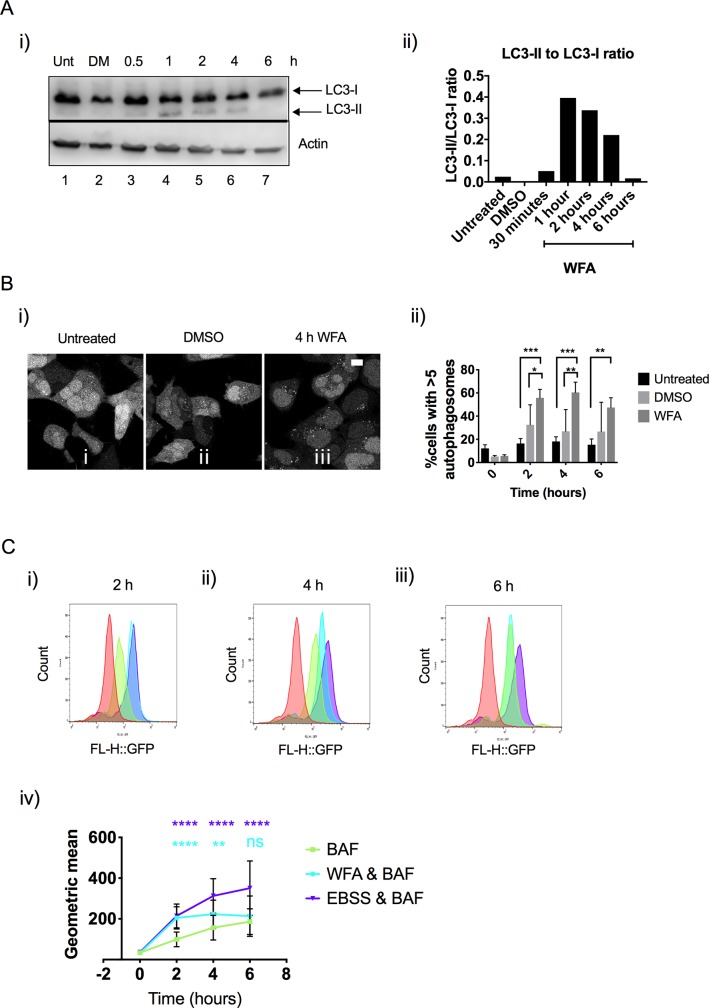
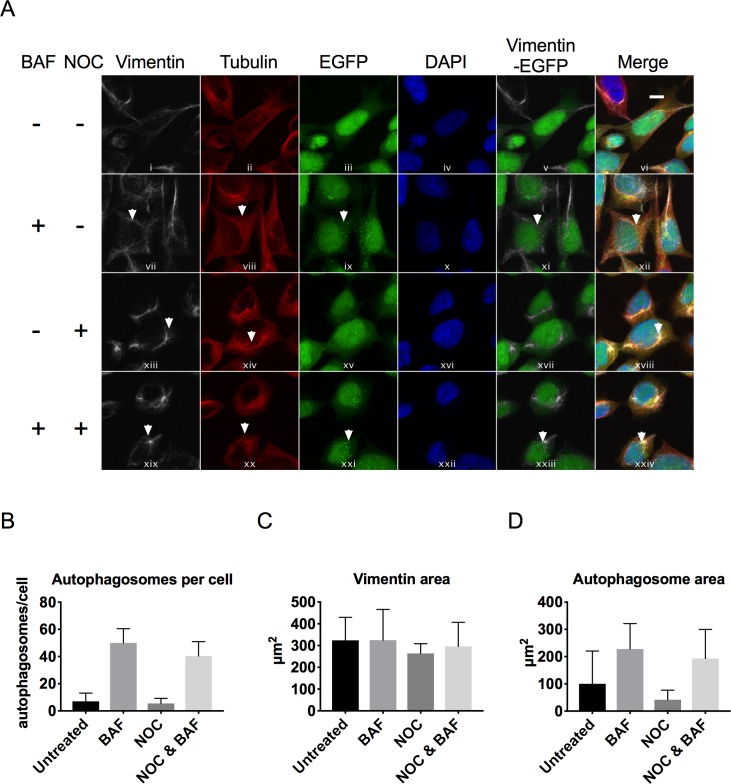
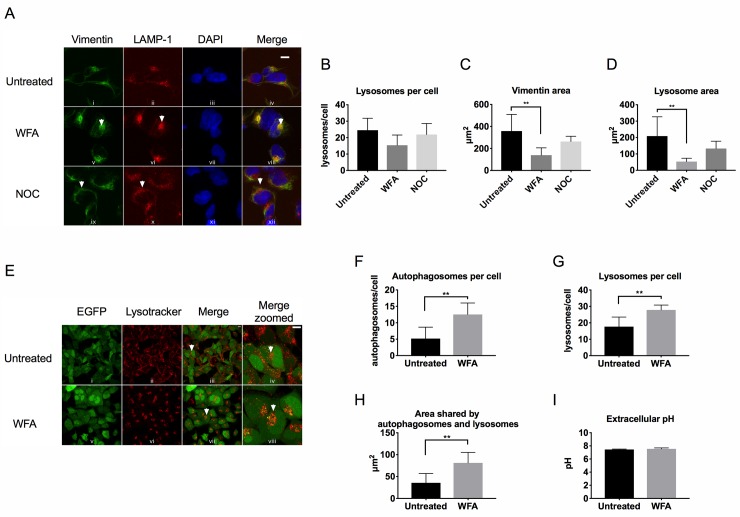
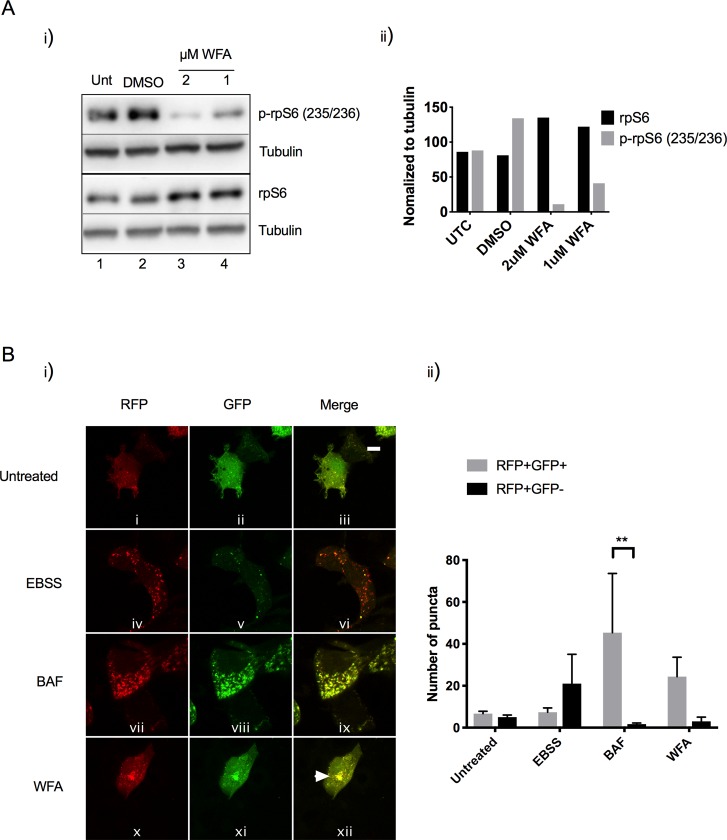
The cytoskeletal protein vimentin plays a key role in positioning of organelles within the cytosol and has been linked to the regulation of numerous cellular processes including autophagy, however, how vimentin regulates autophagy remains relatively unexplored. Here we report that inhibition of vimentin using the steroidal lactone Withaferin A (WFA) causes vimentin to aggregate, and this is associated with the relocalisation of organelles including autophagosomes and lysosomes from the cytosol to a juxtanuclear location. Vimentin inhibition causes autophagosomes to accumulate, and we demonstrate this results from modulation of mechanistic target of rapamycin (mTORC1) activity, and disruption of autophagosome-lysosome fusion. We suggest that vimentin plays a physiological role in autophagosome and lysosome positioning, thus identifying vimentin as a key factor in the regulation of mTORC1 and autophagy.


Conflict of interest statement

The authors have declared that no competing interests exist.

Figures

Fig 1
Fig 1. WFA causes vimentin to aggregate to a juxtanuclear location.
A) Immunofluorescence analysis of endogenous vimentin, tubulin and actin (white) in HEK293 cells treated for 4 h with 1–5 μM of WFA and compared to DMSO vehicle control. Cell nuclei were stained with DAPI (blue). Representative images are shown. Scale bar is equal to 10 μm. B) Immunoblot analysis of endogenous vimentin, tubulin and actin protein levels in HEK293 cells treated for up to 6 h with 1.5 μM of WFA, DMSO vehicle control and compared to untreated cells (Unt). Because vimentin (55 kDa), tubulin (50 kDa) and actin (42 kDa) resolve at similar sizes, equal amounts of cell lysate derived from the same experiment were run simultaneously on separate gels and immunoblots were processed in parallel. Densitometry values for vimentin, tubulin and actin are presented in (S2 Fig). C) The metabolic activities of HEK293 cells were assessed using concentrations of WFA between 100 nM—2 μΜ for up to 24 h and compared to untreated cells. Triton-X was used as a positive control of toxicity. D) i) HEK293 cells were untreated or treated with DMSO vehicle control or 1.5 μΜ WFA for 6h and stained with Annexin V/PI and analysed by flow cytometry. Two-way ANOVA ** p<0.01 (n = 2 independent experiments). ii) Cell morphology was analysed by microscopy prior to flow cytometry. Brightfield images were captured at 20-x magnification. Representative images are shown.
Fig 2
Fig 2. Vimentin inhibition causes the accumulation of LC3.
A) i) Immunoblot analysis of endogenous LC3 in HEK293 GFP-LC3 cells treated for up to 6 h with 1.5 μM of WFA, DMSO vehicle control and compared to untreated cells (Unt). After cell lysates were resolved and transferred to membrane, the membrane was cut horizontally and incubated with antibodies specific to LC3 and actin. ii) The ratio between LC3-II and LC3-I was quantified by densitometry. B) i) Representative images from live-cell imaging of HEK293 GFP-LC3 cells treated for 4 h with 1.5 μΜ WFA, DMSO vehicle control and compared to untreated cells. ii) Quantification of cells exhibiting >5 autophagosomes at 0, 2, 4 and 6 h after treatment with 1.5 μM of WFA, DMSO vehicle control and compared to untreated cells. Two-way ANOVA ** p<0.01, ***p<0.001 (n = 3 independent experiments, 20 cells were analysed in each experiment) C) Flow cytometry analysis of HEK293 GFP-LC3 cells treated with 160nM BAF, EBSS & 160nM BAF or 1.5 μM WFA & 160nM BAF for 2 h (i), 4 h (ii) and 6 h (iii). Cells were analysed for GFP-LC3 fluorescence intensity. Representative chromatograms and quantification of the geometric means (iv) are shown. Statistical analysis compares WFA & BAF treated cells to BAF only treatment (blue stars) and EBSS & BAF treated cells to BAF only treatment (purple stars). Two-way ANOVA ns = p>0.05, ** p≤0.01, ****p≤0.0001 (n = 3 independent experiments).
Fig 3
Fig 3. Vimentin inhibition causes the juxtanuclear clustering of autophagosomes.
A) Immunofluorescence analysis of endogenous vimentin (white), tubulin (red) and GFP-LC3 in HEK293-GFP-LC3 cells treated with 160nM BAF only, 1.5 μM WFA or 1.5 μM WFA & 160nM BAF for 6 h and compared to untreated cells. Cell nuclei were stained with DAPI (blue). Merged panels show the position of GFP-LC3 relative to vimentin, tubulin and nuclei. Scale bars are equal to 10 μm. Representative images are shown. B) Yellow lines define the areas covered by vimentin (panels i-iv) or autophagosomes (panels v-viii). Scale bars are equal 10 μm. Representative images are shown. C) Number of autophagosomes per cell quantified from immunofluorescent images (n = 6 cells). Student’s t-test * p = 0.0144, *** p = 0.0008. D) Vimentin area quantified from immunofluorescent images (n = 6 cells). One-way ANOVA * p ≤0.05. E) Autophagosome area quantified from immunofluorescent images (n = 6 cells). Student’s t-test * p = 0.011.
Fig 4
Fig 4. Effect of microtubule inhibition on the distribution of vimentin and autophagosomes.
A) Immunofluorescence analysis of endogenous vimentin (white), tubulin (red) and GFP-LC3 in HEK293-GFP-LC3 cells treated with 160nM BAF, 500 nM NOC or 500 nM NOC & 160nM BAF for 6 h and compared to untreated cells. Cell nuclei were stained with DAPI (blue). Merged panels show the position of GFP-LC3 relative to vimentin, tubulin and nuclei. Scale bars are equal to 10 μm. Representative images are shown. B) Number of autophagosomes per cell quantified from immunofluorescent images (n = 6 cells). C) Vimentin area quantified from immunofluorescent images (n = 6 cells). D) Autophagosome area quantified from immunofluorescent images (n = 6 cells).
Fig 5
Fig 5. Vimentin inhibition causes the juxtanuclear clustering of lysosomes.
A) Immunofluorescence analysis of endogenous vimentin (green) and endogenous LAMP-1 (red) in HEK293 cells treated for 6 h with 1.5 μM of WFA or 500 nM NOC and compared to untreated cells. Cell nuclei were stained with DAPI (blue). In the merged panels, areas where vimentin and LAMP1 colocalise appear as yellow. Scale bars are equal to 10 μm. Representative images are shown. B) Number of lysosomes per cell quantified from immunofluorescent images (n = 6 cells). C) Vimentin area quantified from immunofluorescent images (n = 6 cells). One-way ANOVA **p = 0.0032. D) Lysosome area quantified from immunofluorescent images (n = 6 cells). One-way ANOVA ** p = 0.0044. E) Live cell imaging analysis of GFP-LC3 and lysosomes (stained with Lysotracker Red) in HEK293-GFP-LC3 cells treated with 1.5 μM WFA for up to 6 h and compared to untreated cells. In the merged panels, areas where GFP-LC3 and lysosomes colocalise appear as yellow. Representative images of 6 h treatment is shown. Scale bars are equal to 10 μm. F) Number of autophagosomes per cell quantified from live cell imaging (n = 6 cells). Student’s t-test **p = 0.0046. G) Number of lysosomes per cell quantified from live cell imaging (n = 6 cells). Student’s t-test **p = 0.0036. H) Area shared by autophagosomes and lysosomes quantified from live cell imaging (n = 6 cells). Student’s t-test **p = 0.0059. I) Extracellular pH measurements from HEK293-GFP-LC3 cells treated with 1.5 μM WFA for 6 h and compared to untreated control.
Fig 6
Fig 6. Vimentin inhibition modulates mTORC1 activity and fusion of autophagosomes and lysosomes.
A) i) HEK293 cells were untreated or treated with DMSO, 1μM WFA or 2μM WFA for 6 h. Protein lysates were immunoblotted for endogenous rpS6, phosphorylated rpS6 (p-rpS6 (S235/236)) and tubulin. ii) The ratio of rpS6/p-rpS6 (normalized to tubulin) was quantified by densitometry. B) i) Immunofluorescence analysis of HEK293 cells transiently transfected with the GFP-RFP-LC3 plasmid and treated with EBSS, 160nM BAF or 1.5 μM of WFA for 6 h. Change of both green and red fluorescence was assessed by confocal microscopy. The numbers of acidified autophagosomes (RFP+GFP-) versus neutral autophagosomes (RFP+GFP+) per cell in each condition were counted. (n = 3 cells). Scale bars are equal to 10 μm. ii) Quantification of acidified autophagosomes (RFP+GFP-) versus neutral autophagosomes (RFP+GFP+).

References

    1. Monastyrska I, Rieter E, Klionsky DJ, Reggiori F. Multiple roles of the cytoskeleton in autophagy. Biological reviews of the Cambridge Philosophical Society. 2009;84(3):431–48. Epub 2009/08/08. 10.1111/j.1469-185X.2009.00082.x - DOI - PMC - PubMed
    1. Kast DJ, Dominguez R. The Cytoskeleton-Autophagy Connection. Current biology: CB. 2017;27(8):R318–R26. Epub 2017/04/26. 10.1016/j.cub.2017.02.061 - DOI - PMC - PubMed
    1. Kroemer G, Marino G, Levine B. Autophagy and the integrated stress response. Molecular cell. 2010;40(2):280–93. Epub 2010/10/23. 10.1016/j.molcel.2010.09.023 - DOI - PMC - PubMed
    1. Choi AM, Ryter SW, Levine B. Autophagy in human health and disease. The New England journal of medicine. 2013;368(7):651–62. Epub 2013/02/15. 10.1056/NEJMra1205406 . - DOI - PubMed
    1. Galluzzi L, Bravo-San Pedro JM, Levine B, Green DR, Kroemer G. Pharmacological modulation of autophagy: therapeutic potential and persisting obstacles. Nature reviews Drug discovery. 2017;16(7):487–511. Epub 2017/05/23. 10.1038/nrd.2017.22 . - DOI - PMC - PubMed