. 2019 Jan 29;24(3):475.
doi: 10.3390/molecules24030475.

4- O-Methylhonokiol Influences Normal Cardiovascular Development in Medaka Embryo

Affiliations

4- O-Methylhonokiol Influences Normal Cardiovascular Development in Medaka Embryo

Santu K Singha et al. Molecules. .

Abstract

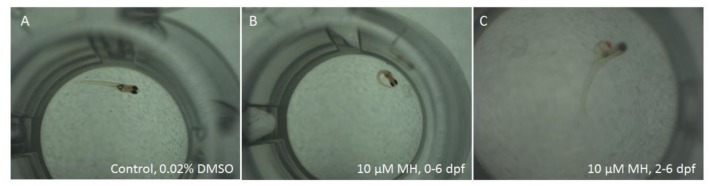
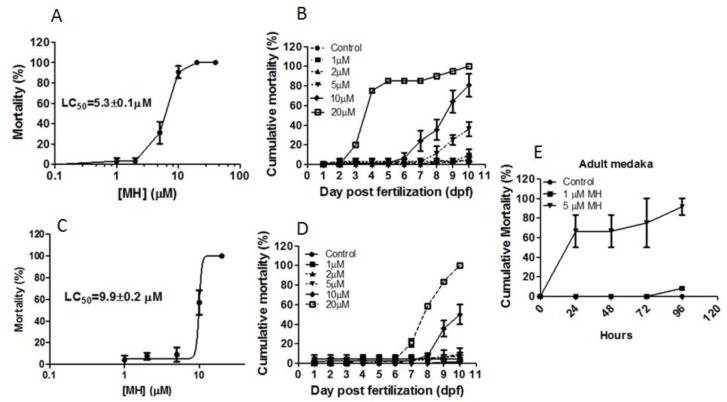
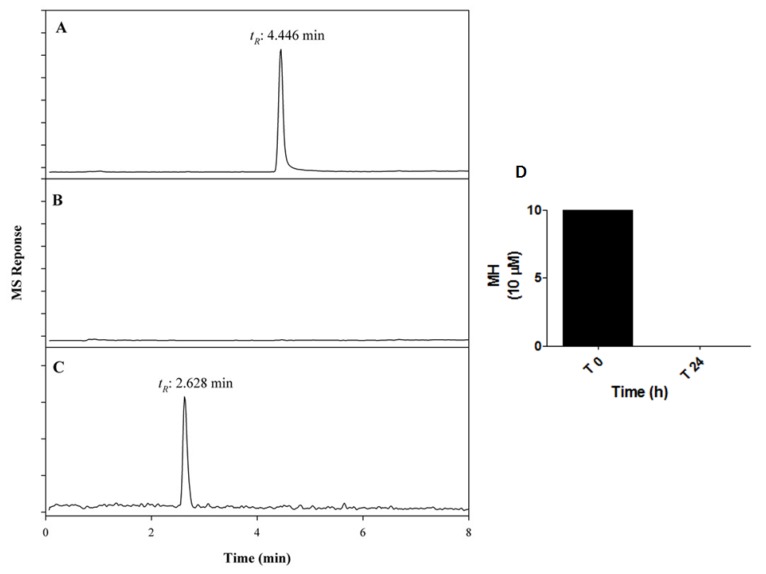
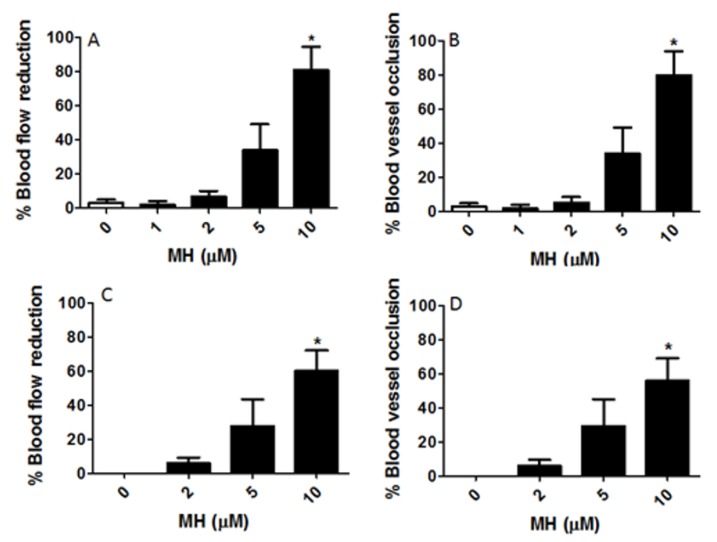
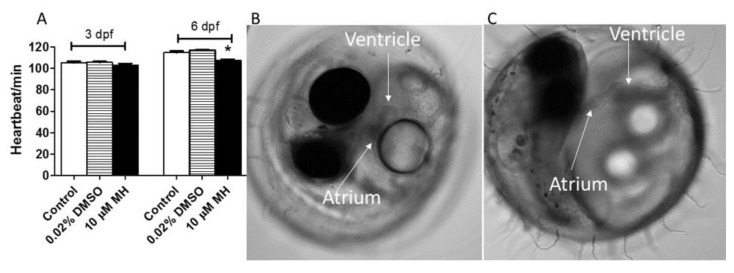
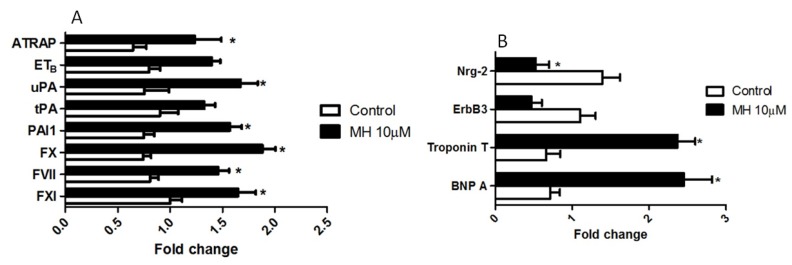
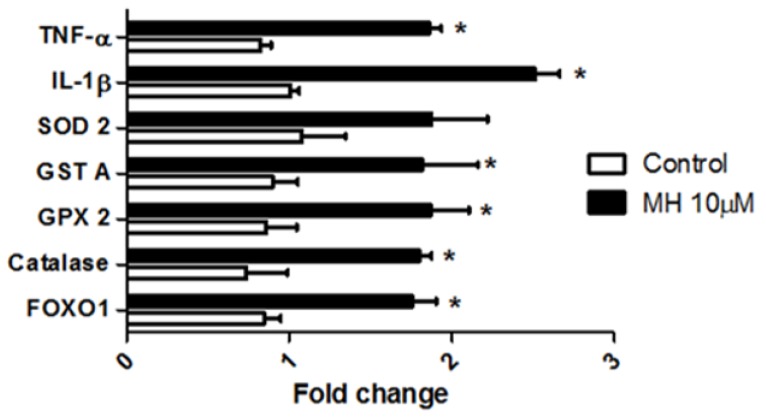
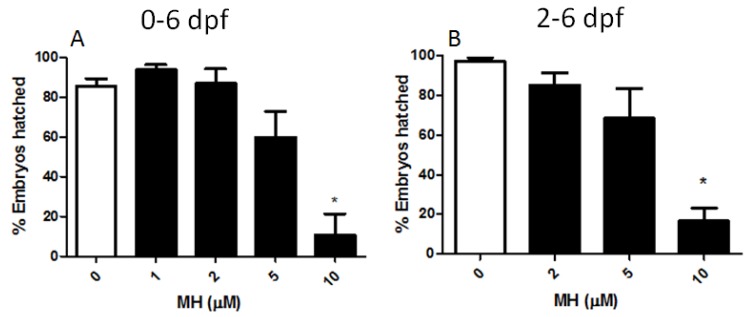
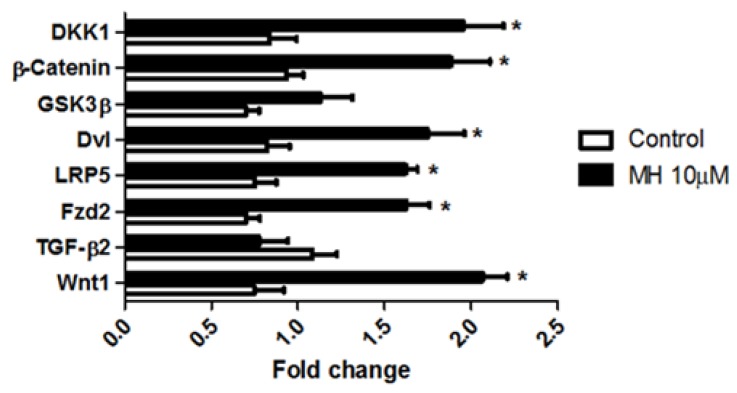
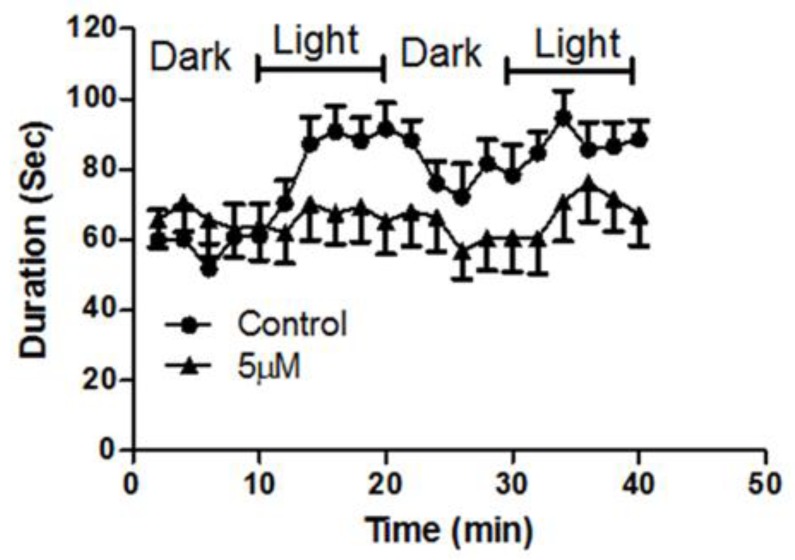
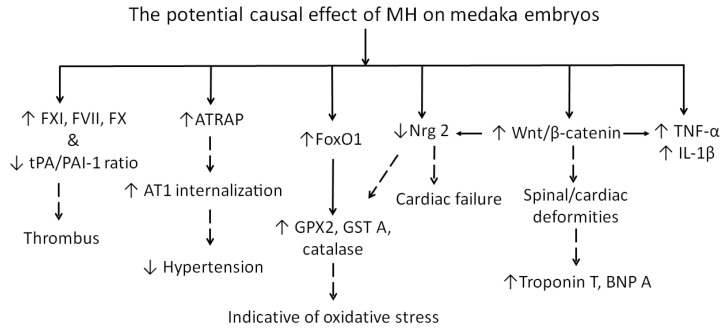
Although 4-O-Methylhonokiol (MH) effects on neuronal and immune cells have been established, it is still unclear whether MH can cause a change in the structure and function of the cardiovascular system. The overarching goal of this study was to evaluate the effects of MH, isolated from Magnolia grandiflora, on the development of the heart and vasculature in a Japanese medaka model in vivo to predict human health risks. We analyzed the toxicity of MH in different life-stages of medaka embryos. MH uptake into medaka embryos was quantified. The LC50 of two different exposure windows (stages 9⁻36 (0⁻6 days post fertilization (dpf)) and 25⁻36 (2⁻6 dpf)) were 5.3 ± 0.1 μM and 9.9 ± 0.2 μM. Survival, deformities, days to hatch, and larval locomotor response were quantified. Wnt 1 was overexpressed in MH-treated embryos indicating deregulation of the Wnt signaling pathway, which was associated with spinal and cardiac ventricle deformities. Overexpression of major proinflammatory mediators and biomarkers of the heart were detected. Our results indicated that the differential sensitivity of MH in the embryos was developmental stage-specific. Furthermore, this study demonstrated that certain molecules can serve as promising markers at the transcriptional and phenotypical levels, responding to absorption of MH in the developing embryo.

Keywords: cardiomyogenesis; factor VII; factor X; herbal medicine; inflammation; thrombosis; vasculogenesis.


Conflict of interest statement

The authors declare no competing interests. The contents of this article are the sole responsibility of the authors and do not necessarily represent the official University of Mississippi or the grant agency officials.

Figures

Figure A1
Figure A1
Examples of images representing the medaka phenotype following MH treatment. Medaka embryos were treated with 10 μM MH or an untreated control batch (0.02% DMSO) for 0–6 dpf or 2–6 dpf following the same protocol as described in the method. (A) Control. No phenotypic abnormality was detected with the control for the two groups. This first image displays an example of a typical control obtained immediately for both treatment plans. (B) This is an example of a typical medaka treated with 10 μM MH for 0–6 dpf. Curved tail phenotypes were observed in many. (C) Edema phenotypes were observed in medaka treated with 10 μM MH for 2–6 dpf. Bent tail phenotypes were observed in few.
Figure 1
Figure 1
Cumulative mortality of medaka embryos. Embryos were exposed to 1, 2, 5, 10, and 20 μM 4-O-Methylhonokiol (MH) for 0–6 days post fertilization (dpf) (A,B) or 2–6 dpf (C,D). (A) Embryos were treated with MH for six days from hour 5, and the LC50 was calculated based on mortality observed at 10 dpf. (B) Cumulative mortality of all embryos until 10 dpf treated with various concentrations of MH for 0–6 dpf. (C) Embryos were treated with MH for four days from 2 dpf and the LC50 was calculated based on mortality observed at 10 dpf. (D) Cumulative mortality until 10 dpf of all embryos treated with various concentrations of MH for 2–6 dpf. The LC50 was calculated by log transformed data using nonlinear regression (curve-fit) (GraphPad Prism). Each value represents mean ± SEM (n = 12, replicated five times). (E) The relationship between MH concentration and mean adult medaka mortality. Eighteen male medakas were randomly divided into three groups (n = 6). They were exposed to 1 or 5 μM MH, and monitored for 96 h. Controls were exposed to 0.02% DMSO.
Figure 2
Figure 2
Quantification of MH uptake by medaka embryos by liquid chromatography-mass spectrometry (MS). This figure is a typical MS profile for the analysis of 10 μM MH uptake following 24 h-incubation with embryos, and maintained at 26 ± 1 °C. The amount of MH disappearance from the conditioned media was measured at time 0 h and time 24 h. Selected ion monitoring (SIM) at m/z 281 shows signals for MH at time 0 h (A) and time 24 h (B). (C) The unknown molecule in MS scan mode. (D) The amount of disappearance of MH following 24 h incubation with embryo.
Figure 3
Figure 3
Reduction of blood flow and vascular occlusion by MH. Embryos were exposed to 1, 2, 5, and 10 μM MH from 5 h post fertilization (hpf) to 6 dpf (0–6 dpf, (A,B)) or from 2 dpf to 6 dpf (2–6 dpf, (C,D)). This figure showed that the reduction in blood flow was proportionally correlated with blood vessel occlusion. (A) Blood flow was observed on days 2, 3, 4, 5, and 6 to verify the duration of the reduction of blood flow. This panel exemplifies the percent reduction in blood flow until 10 dpf in response to various concentrations of MH for 0-6 dpf. (B) This panel shows percent occlusion following MH treatment. During the treatment, blood flow was significantly reduced compared to the control immediately after occlusion. (C) Thirty-two embryos (2 dpf) were randomly divided into four groups (n = 8). Embryos were treated with the indicated concentrations of MH and 0.02% DMSO (control) in embryo medium and were maintained at 26 ± 1 °C for 4 days. This figure shows reduced blood flow in MH-treated embryos (2–6 dpf). (D) This figure demonstrates a blockage that prevents normal flow of blood for the MH-treated embryos exposed to various concentrations of MH from 2 dpf to 6 dpf. Each bar represents data pooled from 4–5 independent experiments. Statistical analysis was performed by one-way analysis of variance (ANOVA) followed by Tukey’s post-hoc multiple comparison test. p < 0.05 was considered as significant. The asterisk (*) indicates values significantly different from the control.
Figure 4
Figure 4
MH is responsible for the defect in cardiac function in vivo. Embryos were exposed to 10 μM MH or 0.02% DMSO (which was used as solvent in the treated condition) as the control from 5 hpf to 6 dpf. Heartbeat, blood flow, and heart structure were evaluated. (A) Heart beat was recorded and expressed as beats per min. Bar graphs of results obtained by counting heart beats. Results are given as the mean percentage of heart beat ± SEM (n > 8 embryos for each condition). Statistical analysis was performed by one-way ANOVA followed by Tukey’s post-hoc multiple comparison test (p < 0.05). (B) Representative image of heart function in the control. (C) Representative bright field images of MH-induced heart ventricle malfunction in embryos treated with 10 μM MH for six days from hour 5. See videos for better visualization of the differences in heart malfunction between the control (video 1) and MH-treated embryo (video 2). Images were acquired on a Nikon TI2-E inverted microscope with a white light LED illuminator and a sCMOS Cooled Monochrome Camera. Videos were captured using a Nikon Elements automated acquisition device.
Figure 5
Figure 5
Embryos treated with MH lead to altered cardiac biomarker gene expression and altered expression of genes involved in thrombosis, fibrinolysis, and vascular tone. Real-time RT-qPCR was performed on total RNA isolated from each group of embryos using described primers in Table 1 leading to the amplification of the target gene. (A) RT-qPCR analysis of factor XI (FXI), factor VII (FVII), factor X (FX), plasminogen activator inhibitor 1 (PAI-1), tissue plasminogen activator (tPA), urokinase plasminogen activator (uPA), endothelin B (ETB), and angiotensin type 1 receptor associated protein (ATRAP) isolated from control and MH-treated embryos. (B) RT-qPCR analysis of natriuretic peptide A, Troponin T, ErbB3, and Nrg2. Data were normalized to the eukaryotic elongation factor 1-alpha (eEf1α) polymerase chain reaction signal. Each value represents mean ± SEM (n = 100, replicated four times). * indicates a value is significant versus the respective control group (p < 0.05).
Figure 6
Figure 6
Embryos treated with MH lead to altered expression of genes involved in cell regulation, oxidative stress, and inflammation. Real-time RT-qPCR was performed on total RNA isolated from each group of embryos using described primers in Table 1 leading to the amplification of the target gene. RT-qPCR analysis of FoxO1, catalase, glutathione peroxidase (GPX2), glutathione-s-transferase (GSTA), superoxide dismutase 2 (SOD-2), Interleukin 1 beta (IL-1β), and tissue necrosis factor-alpha (TNF-α) isolated from control and MH-treated embryos. Data were normalized to the eEf1α polymerase chain reaction signal. Each value represents mean ± SEM (n = 100, replicated four times). Statistical analysis was performed by two-way ANOVA followed by post-hoc Bonferroni test. * indicates values which are significant versus the respective control group (p < 0.05).
Figure 7
Figure 7
The effectiveness of MH at different concentrations at altering hatching of medaka embryos. Under pure culture conditions, embryo hatching efficacy was altered by increasing concentrations of MH. (A) Embryos were treated with increasing concentrations of MH for six days from hour 5 (0–6 dpf). MH concentrations of 5 μM and higher were required to cause a delay in hatching. Hatchability of embryos from six days MH (10 μM)-treatment was significantly decreased in comparison to untreated controls until 10 dpf. The external differences in appearance of the newly hatched control frys on day ten and the 10 μM MH-treated embryos were significantly obvious. (B) Embryos were treated with increasing concentrations of MH for four days from stage 25 (2–6 dpf). MH concentrations of 10 μM and higher were required to significantly cause a delay in hatching. Results are given as the mean percentage of hatching efficiency ± SEM (n > 8 embryos for each condition). Statistical analysis was performed by one-way ANOVA followed by Tukey’s post-hoc multiple comparison test. p < 0.05 was considered as significant. The asterisk (*) indicates values significantly different from the control.
Figure 8
Figure 8
MH controls the Wnt signal transduction pathway, a main regulator of development. Real-time RT-qPCR was performed on total RNA isolated from each group of embryos using described primers in Table 1, leading to the amplification of the target gene. RT-qPCR analysis of Wnt 1, transforming growth factor beta 2 (TGF-β2), frizzled 2 (Fzd2), low-density lipoprotein receptor-related protein 5 (LRP5), dishevelled (Dvl), glycogen synthase kinase 3 beta (GSK-3β), β-catenin, and dickkopf 1 (DKK1) isolated from the control and MH-treated embryos. Each value represents mean ± SEM (n = 100, replicated four times). Statistical analysis was performed by two-way ANOVA followed by post-hoc Bonferroni test. * indicates values which are significant versus the respective control group (p < 0.05).
Figure 9
Figure 9
MH altered larvae’ locomotor responses to light and dark stimuli. Medaka larvae (2 days post hatching (dph)) were monitored for 40 min (0–10 min dark, 10–20 min light, 20–30 min dark, 30–40 min light) using a ViewPoint Zebrabox. Duration of movements was measured at 2 min intervals at a velocity of ≥2 mm/s. Larvae were treated with 5 μM, a sub-lethal concentration; MH and their activity were measured in 10 min windows at the indicated time points. No significant (two-tailed t-test, p < 0.05) increase in activity in MH-treated larvae (solid closed triangles, n = 14) was noted for the time window during the light-cycle compared to baseline levels and that of the control group (solid closed circles, n = 16). Each datum represents mean ± SEM of 16 observations.
Figure 10
Figure 10
Stages with regard to hours post fertilization of the medaka heart. This scheme outlines the embryological development of the heart during the first 144 h and subsequent formation of concentric chamber growth. The medaka heart begins beating and pumping around 44 (stage 24) to 50 (stage 25) hours post fertilization. Medaka embryos were treated with MH either from 0–6 days post fertilization or 2–6 dpf at 26 ± 1 °C.
Figure 11
Figure 11
Flowchart depicting MH treatment induces cellular and morphological changes in medaka embryos that lead to inflammation, thrombosis, spinal, and cardiac deformities. Solid arrows indicate the direction of the effects of MH on indicators of increased inflammation/cardiovascular risk and the anatomic locations as well as a link with the prior object/event. The flow of physiological changes that require further investigations are shown in dashed arrows. Legend: ATRAP, angiotensin receptor-associated protein; AT1, angiotensin type I receptor; β-catenin, beta catenin; BNPA, brain natriuretic peptide type A; FVII, Factor VII; FX, Factor X; FXI, Factor XI; FoxO1, Forkhead box O1; GPX2, glutathione peroxidase 2; GST A, glutathione S-transferase A; IL-1β, interleukin-1 beta; Nrg 2, neuregulin 2; tPA, urokinase plasminogen activator; PAI-1, plasminogen activator inhibitor 1; Wnt, wingless/integrated oncogenes.

Similar articles

Cited by

References

    1. Li N., Song Y., Zhang W., Wang W., Chen J., Wong A.W., Roberts A. Evaluation of the in vitro and in vivo genotoxicity of magnolia bark extract. Regul. Toxicol. Pharmacol. 2007;49:154–159. doi: 10.1016/j.yrtph.2007.06.005. - DOI - PubMed
    1. Shen J.L., Man K.M., Huang P.H., Chen W.C., Chen D.C., Cheng Y.W., Liu P.L., Chou M.C., Chen Y.H. Honokiol and magnolol as multifunctional antioxidative molecules for dermatologic disorders. Molecules. 2010;15:6452–6465. doi: 10.3390/molecules15096452. - DOI - PMC - PubMed
    1. Chicca A., Gachet M.S., Petrucci V., Schuehly W., Charles R.P., Gertsch J. 4′-O-methylhonokiol increases levels of 2-arachidonoyl glycerol in mouse brain via selective inhibition of its COX-2-mediated oxygenation. J. Neuroinflamm. 2015;12:89. doi: 10.1186/s12974-015-0307-7. - DOI - PMC - PubMed
    1. Dominguez F., Chavez M., Garduno-Ramirez M.L., Chavez-Avila V.M., Mata M., Cruz-Sosa F. Honokiol and magnolol production by in vitro micropropagated plants of Magnolia dealbata, an endangered endemic Mexican species. Nat. Prod. Commun. 2010;5:235–240. - PubMed
    1. Schuhly W., Khan S.I., Fischer N.H. Neolignans from North American Magnolia species with cyclooxygenase 2 inhibitory activity. Inflammopharmacology. 2009;17:106–110. doi: 10.1007/s10787-009-7013-y. - DOI - PubMed

LinkOut - more resources