. 2019 Mar;39(3):413-431.
doi: 10.1161/ATVBAHA.118.312191.

Potential Role of H-Ferritin in Mitigating Valvular Mineralization

Affiliations

Potential Role of H-Ferritin in Mitigating Valvular Mineralization

Katalin Éva Sikura et al. Arterioscler Thromb Vasc Biol. 2019 Mar.

Abstract

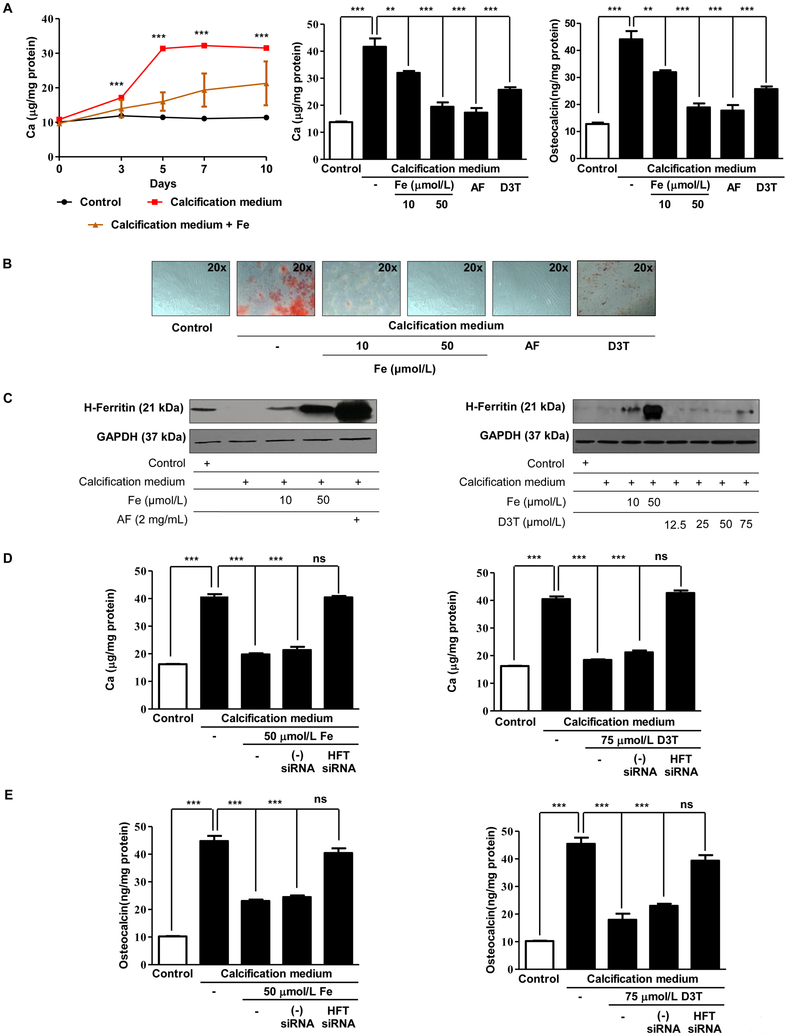
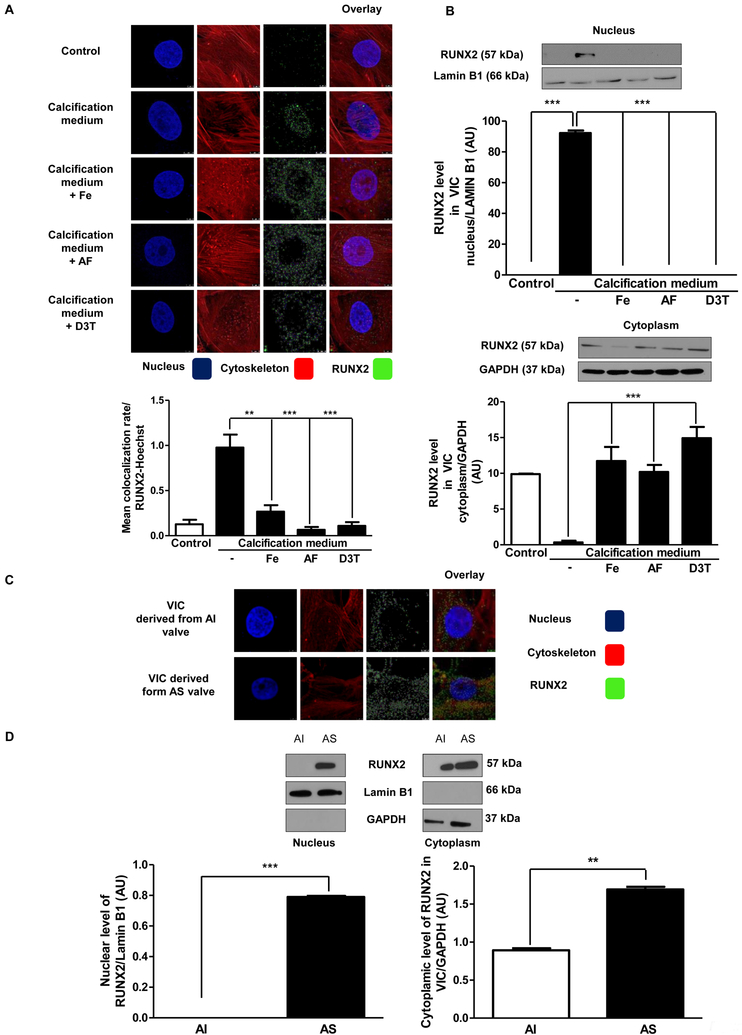
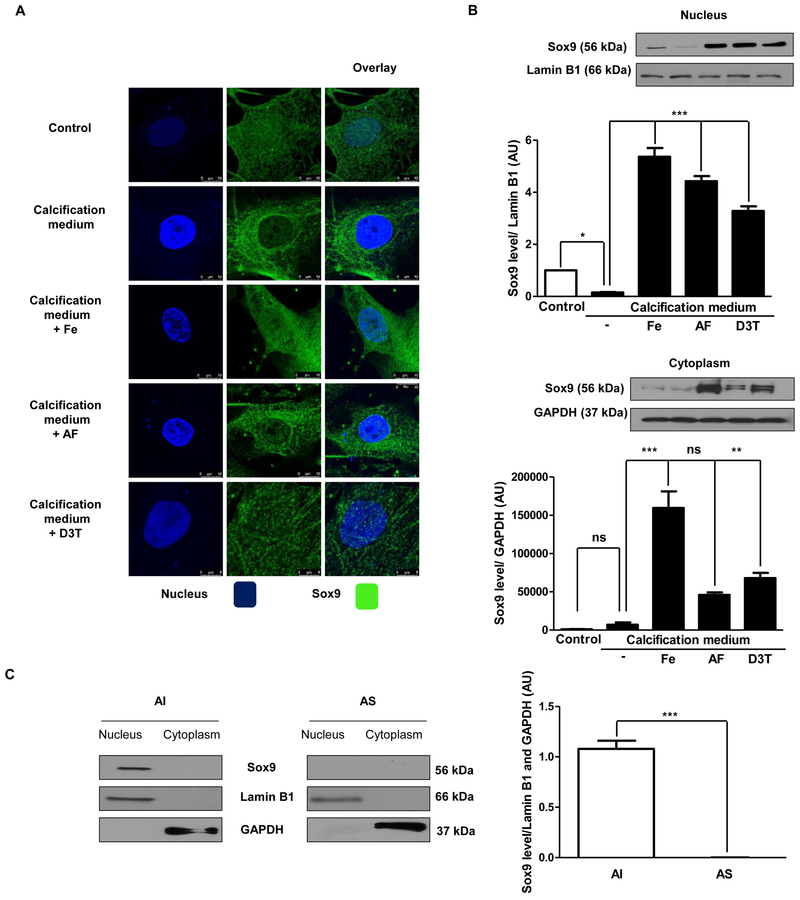
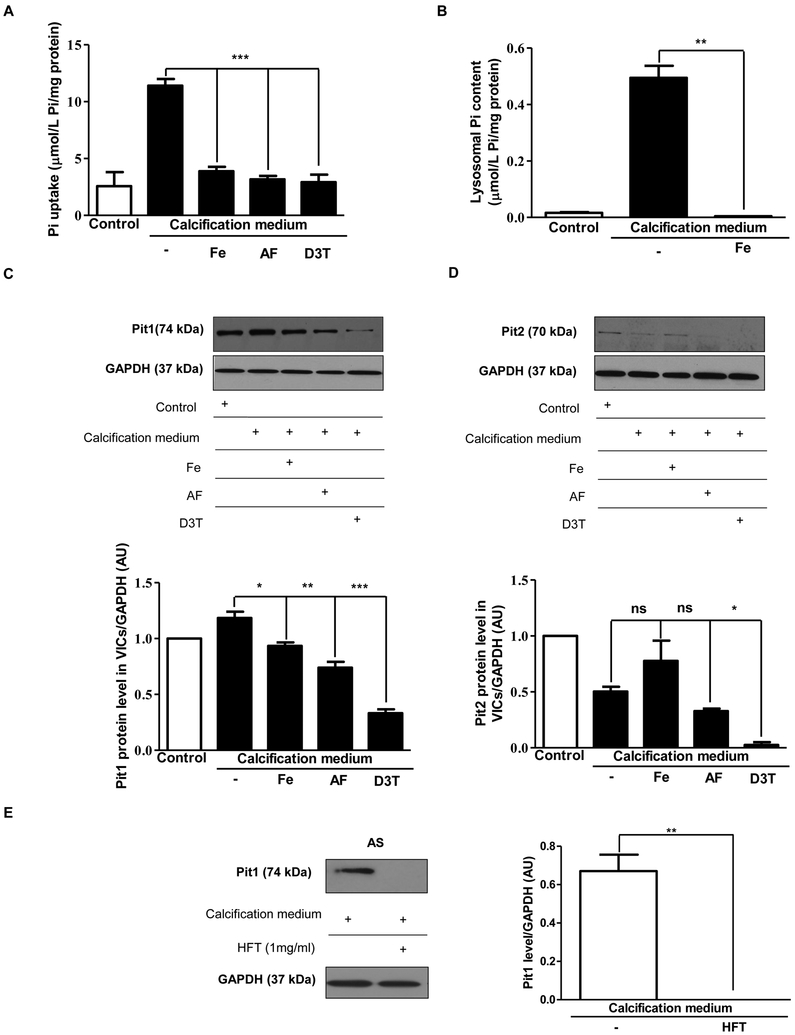
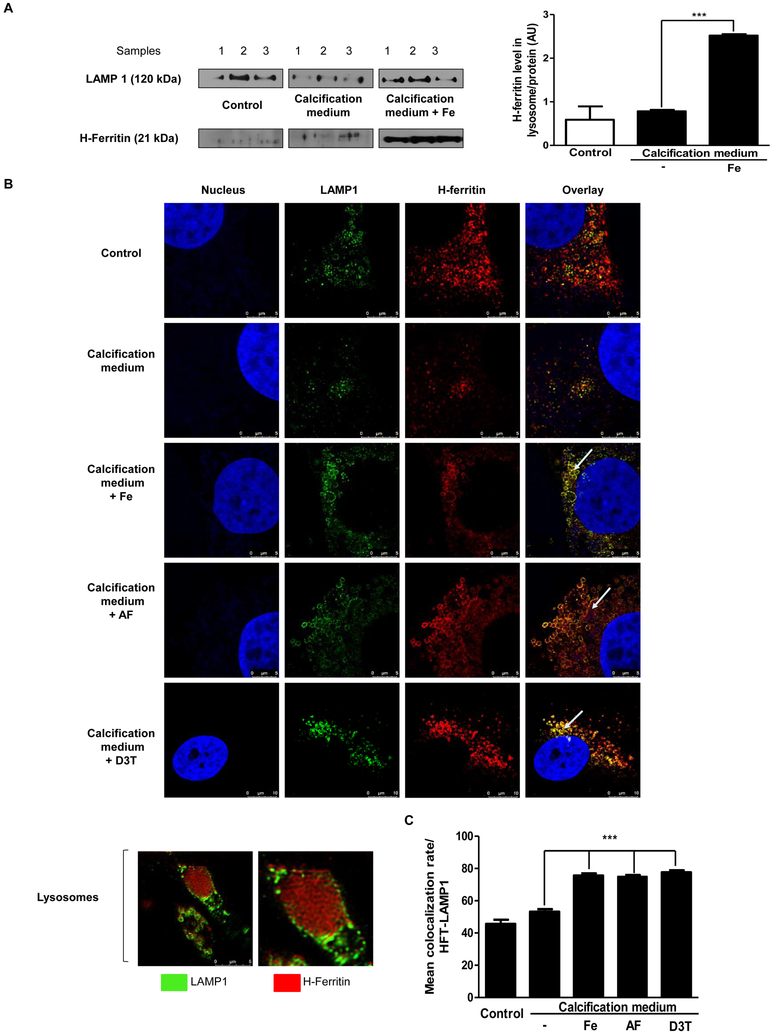
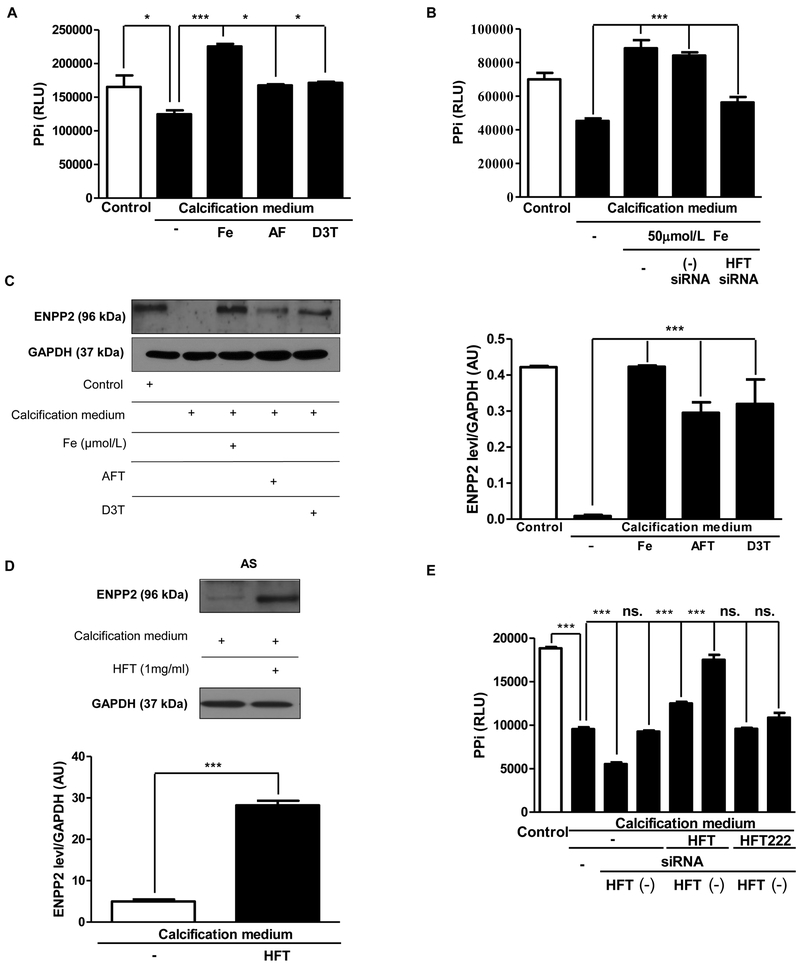
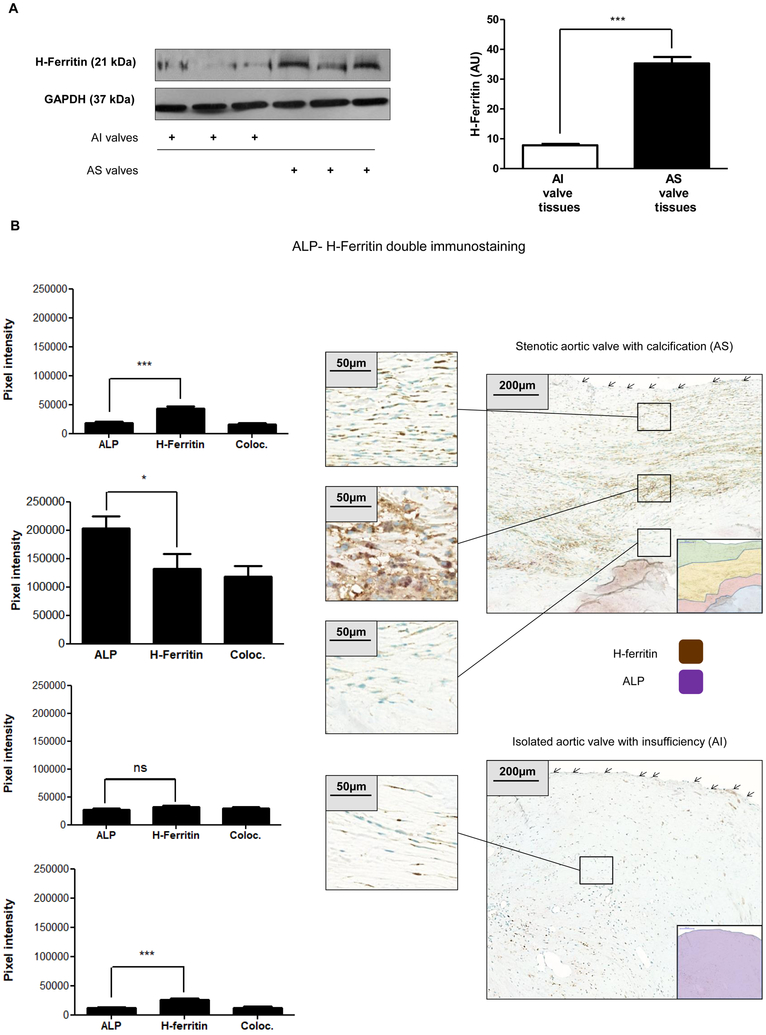
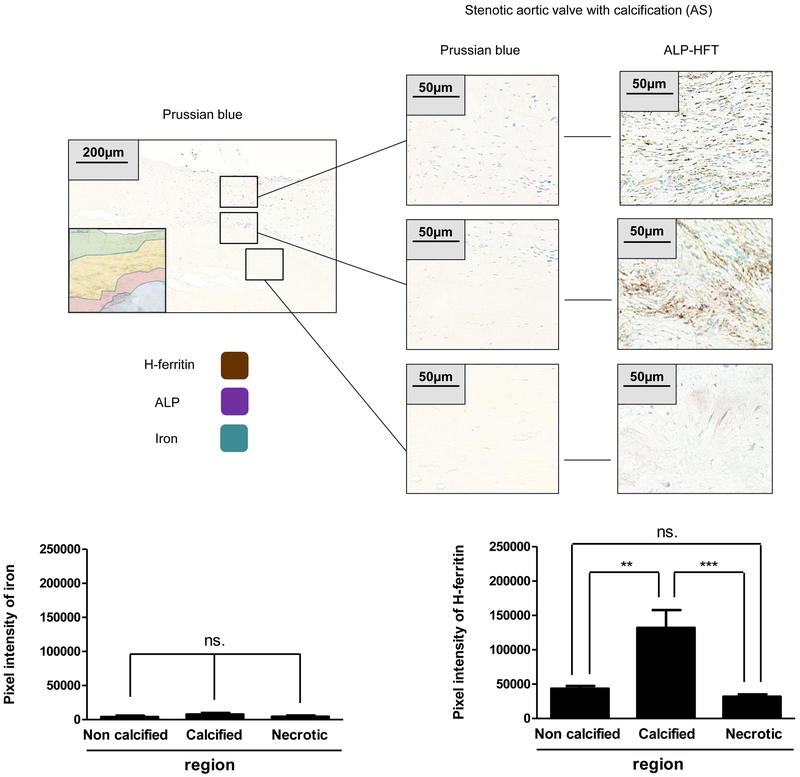
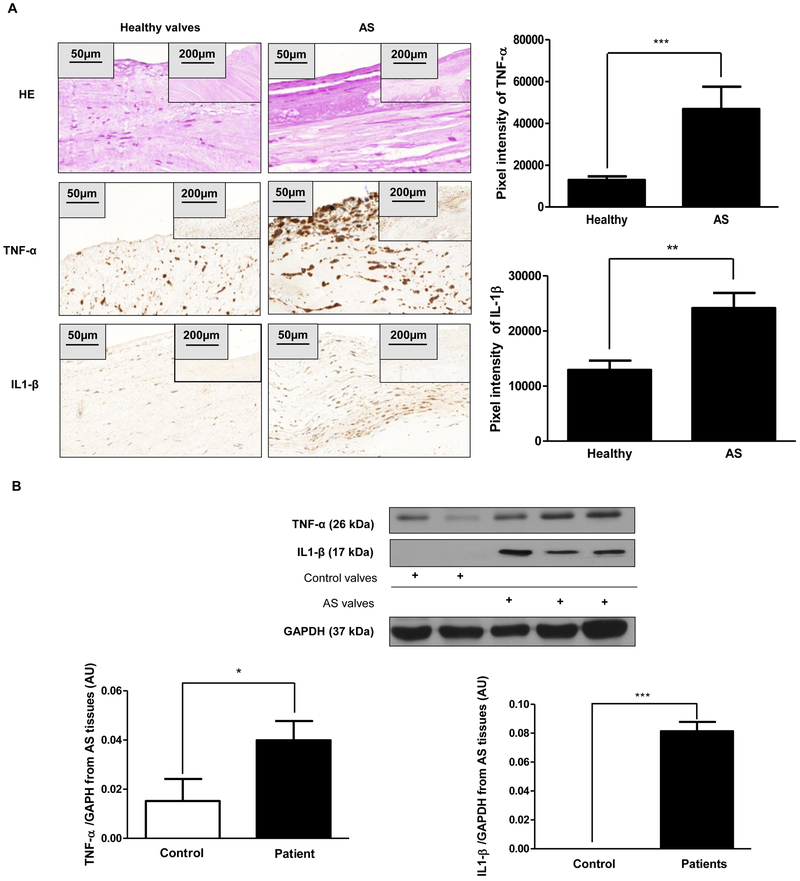
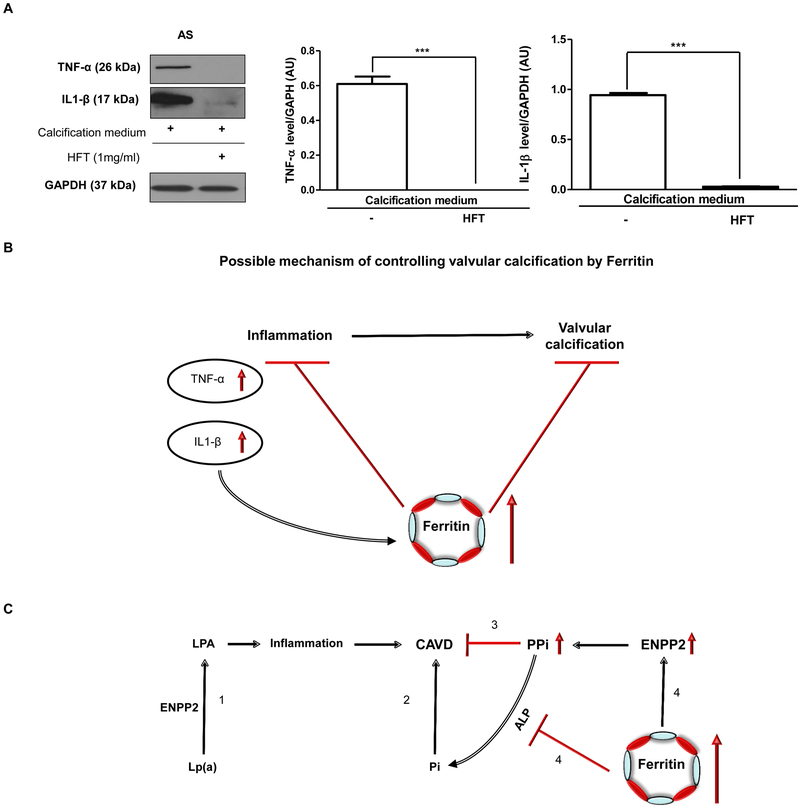
Objective- Calcific aortic valve disease is a prominent finding in elderly and in patients with chronic kidney disease. We investigated the potential role of iron metabolism in the pathogenesis of calcific aortic valve disease. Approach and Results- Cultured valvular interstitial cells of stenotic aortic valve with calcification from patients undergoing valve replacement exhibited significant susceptibility to mineralization/osteoblastic transdifferentiation in response to phosphate. This process was abrogated by iron via induction of H-ferritin as reflected by lowering ALP and osteocalcin secretion and preventing extracellular calcium deposition. Cellular phosphate uptake and accumulation of lysosomal phosphate were decreased. Accordingly, expression of phosphate transporters Pit1 and Pit2 were repressed. Translocation of ferritin into lysosomes occurred with high phosphate-binding capacity. Importantly, ferritin reduced nuclear accumulation of RUNX2 (Runt-related transcription factor 2), and as a reciprocal effect, it enhanced nuclear localization of transcription factor Sox9 (SRY [sex-determining region Y]-box 9). Pyrophosphate generation was also increased via upregulation of ENPP2 (ectonucleotide pyrophosphatase/phosphodiesterase-2). 3H-1, 2-dithiole-3-thione mimicked these beneficial effects in valvular interstitial cell via induction of H-ferritin. Ferroxidase activity of H-ferritin was essential for this function, as ceruloplasmin exhibited similar inhibitory functions. Histological analysis of stenotic aortic valve revealed high expression of H-ferritin without iron accumulation and its relative dominance over ALP in noncalcified regions. Increased expression of H-ferritin accompanied by elevation of TNF-α (tumor necrosis factor-α) and IL-1β (interleukin-1β) levels, inducers of H-ferritin, corroborates the essential role of ferritin/ferroxidase via attenuating inflammation in calcific aortic valve disease. Conclusions- Our results indicate that H-ferritin is a stratagem in mitigating valvular mineralization/osteoblastic differentiation. Utilization of 3H-1, 2-dithiole-3-thione to induce ferritin expression may prove a novel therapeutic potential in valvular mineralization.

Keywords: arteriosclerosis; chronic kidney disease; phosphate; stenosis; vascular calcification.


Conflict of interest statement

Disclosures

All the authors declared no competing interests.

Figures

Figure 1.
Figure 1.. Calcification of valvular interstitial cells is inhibited by iron, D3T, and apo-ferritin
A) VIC was cultured in growth medium or calcification medium in the presence or absence of 10, 50 μmol/L iron (Ammonium iron (III) citrate) and 2 mg/mL apo-ferritin. Calcium contents of the cells were measured after 0, 3, 5, 7 and ten days and normalized to protein content of the cells (left panel). Calcium content and representative images of Alizarin Red staining (Figure 1B) are shown. Figure 1 (middle panel) Calcium and Figure 1 (right panel) osteocalcin content of the cells were measured after five days incubation. Osteocalcin and calcium level were normalized to protein concentration of cells. C) Representative Western blot shows expression of H-ferritin and GAPDH of cells treated as described above. 60% confluence of VIC was transfected with siRNA specific to H-ferritin or negative control siRNA 24 hours before the experiment. Cells were cultured in growth medium or calcification medium in the presence or absence of iron or D3T for five days. D) Calcium deposition, E) Osteocalcin level was measured. Graphs analyzed by One Way ANOVA, Bonferroni’s Multiple Comparison Test and show mean ±SEM of three independent experiments. Not significant (ns), ** P< 0.001, *** P< 0.0001.
Figure 2.
Figure 2.. Nuclear translocation of RUNX2 is prevented by iron, apo-ferritin and D3T
A) VIC was cultured with 50 μmol/L iron (Ammonium iron(III) citrate), 2 mg/mL apo-ferritin, 75 μmol/L D3T added into the calcification medium and localization of transcription factor RUNX2 was examined (green). Colocalization of RUNX2 and Hoechst was measured. B) Representative Western blot of RUNX2 from isolated nucleus and cytoplasm of VIC. Samples were normalized for GAPDH and Lamin B1. C) RUNX2 immunostainings of VIC derived from AI or AS valves are shown. Brightness was adjusted by 40%. D) RUNX2 protein level isolated from AI and AS tissues. Results were normalized to Lamin B1 and GAPDH. Images were obtained employing immunofluorescence-confocal STED nanoscopy. Representative staining is shown from at least three independent experiments. Results were analyzed by One Way ANOVA, Bonferroni’s Multiple Comparison Test (Figure 2A–C) and Paired t-test (Figure 2D) and are shown as mean values ± SEM of at least three independent experiments. **P < 0.001; ***P < 0.0001.
Figure 3.
Figure 3.. Calcifying milieu inhibits Sox9 nuclear localization
VIC was cultured in growth medium or calcification medium in the presence or absence of 10, 50 μmol/L iron (Ammonium iron (III) citrate) and 2 mg/mL apo-ferritin. A) Localization of Sox9 was shown (stained green) by immunostaining. Images were obtained employing immunofluorescence-confocal STED nanoscopy. B) Sox9 protein expression from isolated nucleus and cytoplasm fraction also shown. Results were normalized to Lamin B1 and GAPDH. C) Co-localization of Sox9 in VIC. Representative staining is shown from at least three independent experiments. Data were analyzed by One Way ANOVA, Bonferroni’s Multiple Comparison Test (Figure 3A–B)) and Paired t-test (Figure 3C) and shows the average of three separate experiments performed in duplicate. ** P<0,001; ***P < 0.0001.
Figure 4.
Figure 4.. Phosphate uptake by valvular interstitial cells is reduced by iron, apo-ferritin, and D3T
A) Cells were cultured in a normal or calcific environment exposed to iron, or apo-ferritin, or D3T and phosphate content was determined using QuantiChrom quantitative colorimetric assay. B) VIC was cultured in growth medium or calcification medium in the presence or absence of iron (Ammonium iron (III) citrate). After isolation of lysosomes, phosphate level was measured. VIC was cultured with 50 μmol/L iron (Ammonium iron (III) citrate), 2 mg/mL apo-ferritin, 75 μmol/L D3T and C) Pit1 and D) Pit2 Western blotting was performed in the same experiments. E) VIC derived AS valves were cultured in calcific condition alone or supplemented with H-ferritin. Pit1 Western blots were carried out and normalized to the protein content of the samples. Results were analyzed by One Way ANOVA, Bonferroni’s Multiple Comparison Test and are shown as mean values ± SEM of at least three independent experiments. *P < 0.05; **P < 0.001; ***P < 0.0001.
Figure 5.
Figure 5.. Lysosomal localization of H-ferritin in cells exposed to iron, apo-ferritin or D3T
A) VIC was cultured in growth medium or calcification medium in the presence or absence of iron (Ammonium iron (III) citrate). Western blot analysis for H-ferritin and LAMP1 derived from the isolated lysosome. B) VIC was cultured in growth medium or calcification medium in the presence or absence of iron (Ammonium iron (III) citrate), apo-ferritin or D3T. Double immunofluorescence staining of VIC for LAMP1 and H-ferritin are shown. Images were obtained employing immunofluorescence-confocal microscope and STED nanoscopy. Representative staining is shown from at least three independent experiments. Results were analyzed by One Way ANOVA, Bonferroni’s Multiple Comparison Test and are shown as mean values ± SEM of at least three independent experiments. ***P < 0.0001.
Figure 6.
Figure 6.. Pyrophosphate generation and ENPP expression are enhanced in VIC by iron, apo-ferritin and D3T.
A) VIC was cultured in growth or calcification medium supplemented with 50 μmol/L iron (Ammonium iron (III) citrate), 2 mg/mL apo-ferritin or 75 μmol/L D3T for five days and pyrophosphate level was measured. B) VIC was transfected with siRNA specific to H-ferritin or negative control siRNA prior to iron exposure and pyrophosphate level was measured. C) ENPP2 expression in VIC was assessed by Western blot analysis. D) ENPP2 Western blot were shown. AS tissues derived VIC cells were cultured in calcific condition alone or treated with H-ferritin. Samples were normalized to the protein content of the cells. E) PPi level changes after H-Ferritin silencing were shown. VIC cells were transfected with siRNA against H-Ferritin. Samples were treated in the next day with 1 mg/mL of H-Ferritin and 1 mg/mL H-Ferritin 222 (mutant ferritin without ferroxidase activity) for 3 days. Data were analyzed by One Way ANOVA, Bonferroni’s Multiple Comparison Test and are shown as mean values ± SEM of three separate experiments performed in duplicate. Not significant (ns), *P < 0.05; ***P < 0.0001.
Figure 7.
Figure 7.. H-ferritin expression in AI and AS heart valves
A) H-ferritin expression in AI and AS heart valve tissue was assessed by Western blot analysis. B) The AI and AS valve sections were stained for ALP and H-ferritin. ALP, H-ferritin and colocalization rate of ALP and H-ferritin are shown as pixel intensity from AS and AI samples (left panels). Arrows show endothelial layer. Scale bars show 200 μm at 12.5x magnification and 50μm at 50x magnification. Results were analyzed by Unpaired t-test and are shown as mean values ± SEM of at least three independent experiments.
Figure 8.
Figure 8.. Increased H-ferritin levels in AS valve without accumulation of iron
A) Prussian blue (left panel) and H-ferritin-ALP (right panel) staining were performed on AS valves (N=3). Scale bars (200 μm at 12.5x magnification and 50μm at 50x magnification) and pixel intensity of iron and H-ferritin staining were shown. Representative stains were shown from at least three independent experiments. Results were analyzed by unpaired t-test and are shown as mean values ± SEM of at least three independent experiments.
Figure 9.
Figure 9.. Increased expression of inflammatory markers in AS valves
A) Hematoxylin and eosin (upper panels); TNF-α; and IL1-β IHC staining were performed on healthy heart valves derived from the Department of Forensic Institute, University of Debrecen (left column; N=3) and on AS valves with calcification (right column, N=9). Scale bars (200 μm at 12.5x magnification and 50μm at 50x magnification) and pixel intensity of IHC staining were shown. Representative staining was shown from at least three independent experiments. B) Western blots (TNF-α and IL1-β) from AS tissues were shown. Protein expressions were normalized to GAPDH. Results were analyzed by One Way ANOVA, Bonferroni’s Multiple Comparison Test (Figure 8B) and were shown as mean values ± SEM of at least three independent experiments. **P < 0.001; ***P < 0.0001.
Figure 10.
Figure 10.. H-ferritin inhibits the expression of TNF-α and IL1-β in VIC derived from AS
VIC was cultured in calcification medium or supplemented with 1mg/mL H-ferritin. A) Western blot was performed and the following antibodies were used: anti-human TNF-α; anti-human IL1-β. B) TNF-α and IL1-β protein level in AS valve tissue. (N=3). B) Role of H-ferritin in the inflammatory process and valvular calcification. C) (1) Lp(a) is a risk factor of calcific aortic valve disease (CAVD) via inducing inflammation. (2) Pi is risk factor of calcific aortic valve disease. (3) PPi antagonizes valvular mineralization. (4) H-ferritin inhibits valvular mineralization via elevating PPi and decreasing Pi by the induction of ENPP2 and the inhibition of ALP activity. Data were analyzed by One Way ANOVA, Bonferroni’s Multiple Comparison Test and samples were derived from four separate experiments performed in triplicates and shown as mean ± SEM ***P < 0.0001.

References

    1. Rajamannan NM, Evans FJ, Aikawa E, Grande-Allen KJ, Demer LL, Heistad DD, Simmons CA, Masters KS, Mathieu P, O’Brien KD, Schoen FJ, Towler DA, Yoganathan AP, Otto CM. Calcific aortic valve disease: not simply a degenerative process: A review and agenda for research from the National Heart and Lung and Blood Institute Aortic Stenosis Working Group. Executive summary: Calcific aortic valve disease-2011 update. Circulation 2011; 124: 1783–1791. - PMC - PubMed
    1. Mohler ER 3rd, Gannon F, Reynolds C, Zimmerman R, Keane MG, Kaplan FS. Bone formation and inflammation in cardiac valves. Circulation 2001; 103: 1522–1528. - PubMed
    1. Mazzone A, Epistolato MC, De Caterina R, Storti S, Vittorini S, Sbrana S, Gianetti J, Bevilacqua S, Glauber M, Biagini A, Tanganelli P. Neoangiogenesis, T-lymphocyte infiltration, and heat shock protein-60 are biological hallmarks of an immunomediated inflammatory process in end-stage calcified aortic valve stenosis. Journal of the American College of Cardiology 2004; 43: 1670–1676. - PubMed
    1. Freeman RV, Otto CM. Spectrum of calcific aortic valve disease: pathogenesis, disease progression, and treatment strategies. Circulation 2005; 111: 3316–3326. - PubMed
    1. Dweck MR, Boon NA, Newby DE. Calcific Aortic Stenosis: A Disease of the Valve and the Myocardium. Journal of the American College of Cardiology 2012; 60: 1854–1863. - PubMed

Publication types

MeSH terms