

Spatiotemporal evolution of global population ageing from 1960 to 2017
- PMID: 30700286
- PMCID: PMC6354390
- DOI: 10.1186/s12889-019-6465-2
Spatiotemporal evolution of global population ageing from 1960 to 2017
Abstract
Background: Population ageing is an increasingly severe global issue. And this has been posing challenges for public health policies and medical resource allocation There are various features of population ageing in different regions worldwide.
Methods: All data were obtained from the health data of World Bank Open Data. Quantile linear regression was used to subtly measure the common variation tendency and strength of the global ageing rate and ageing population. The Bayesian space-time hierarchy model (BSTHM) was employed to assess the detailed spatial temporal evolution of ageing rate and ageing population in global 195 countries and regions.
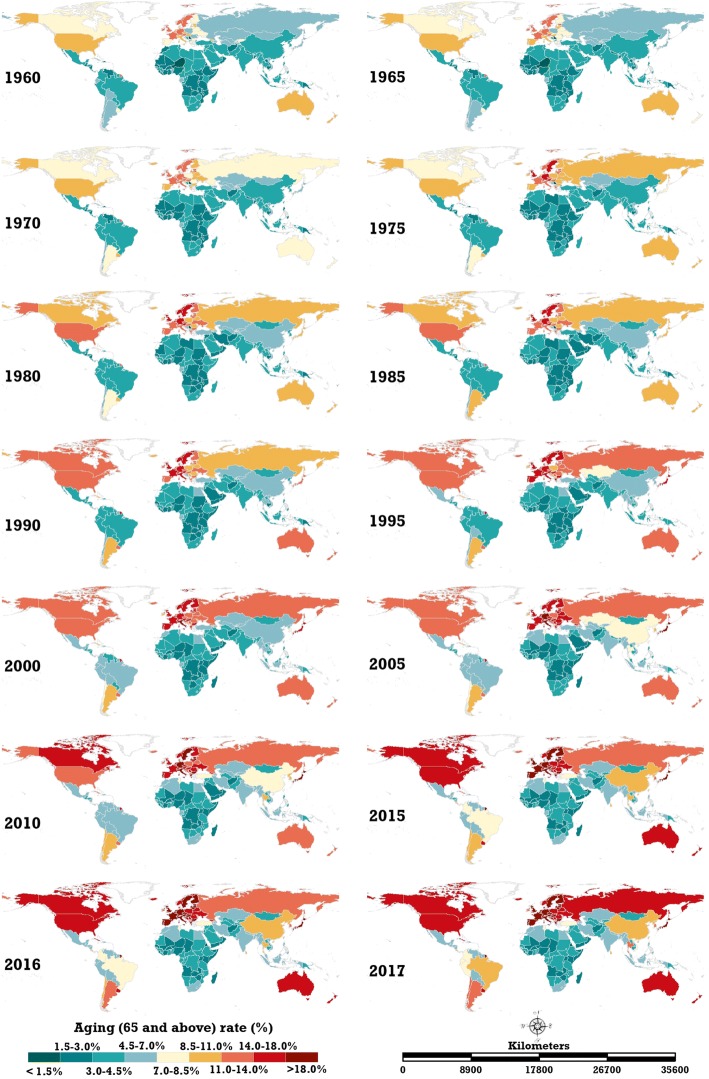
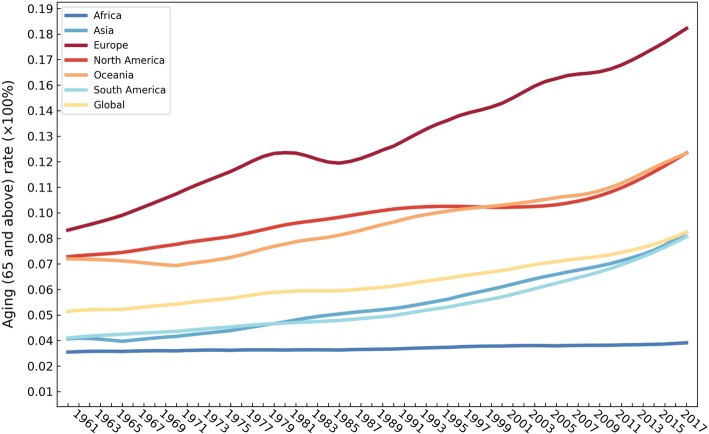
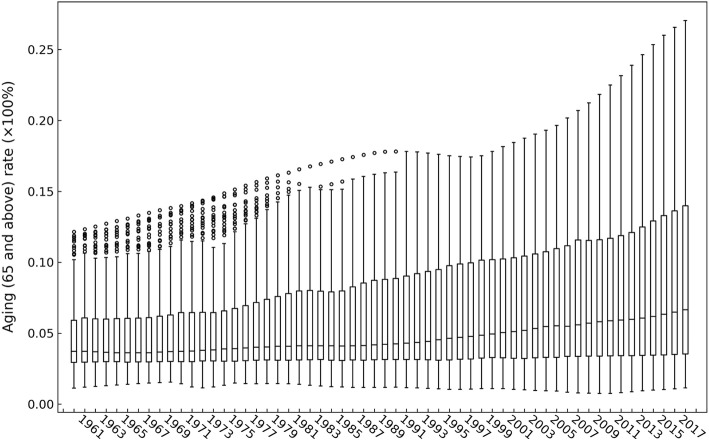
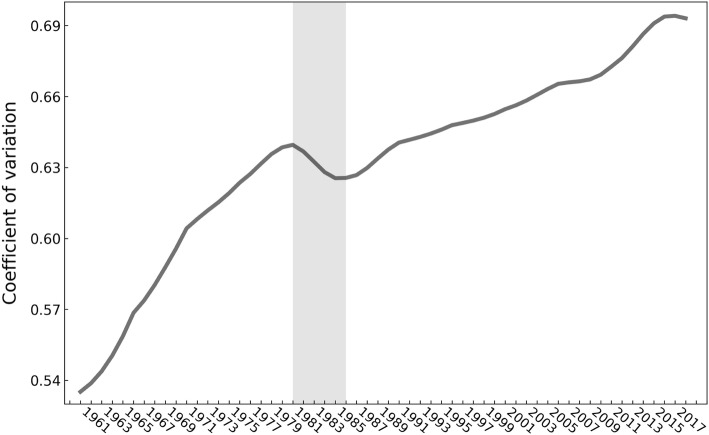
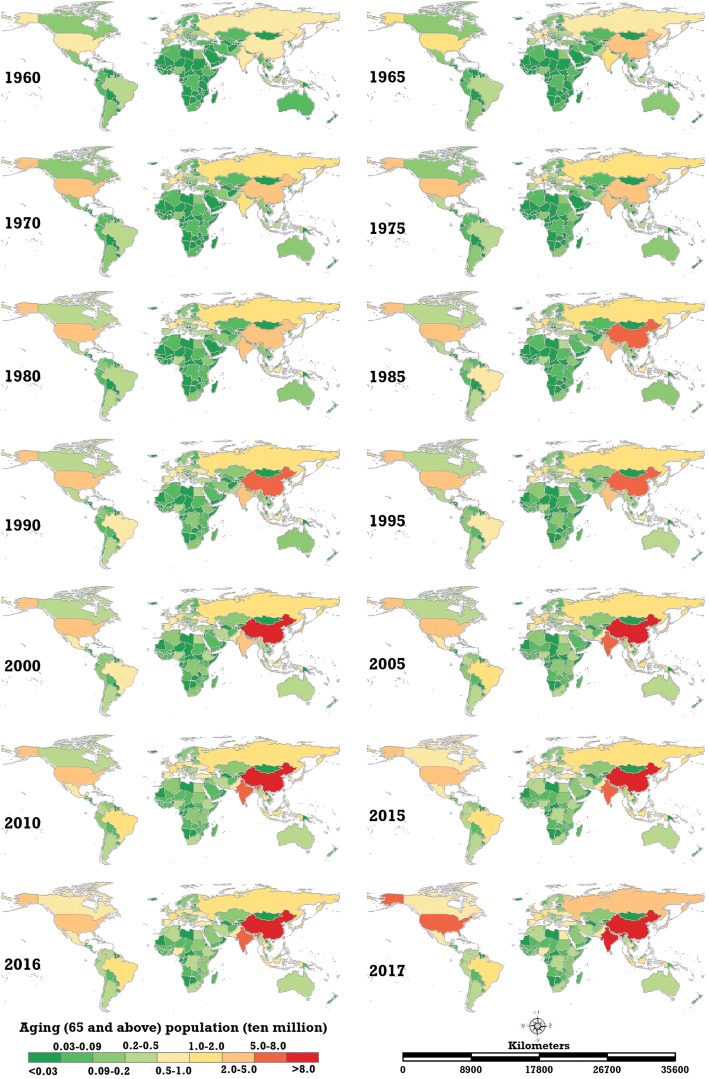
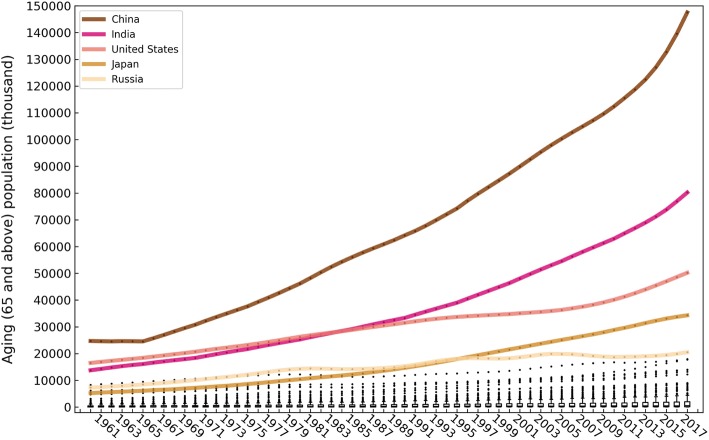
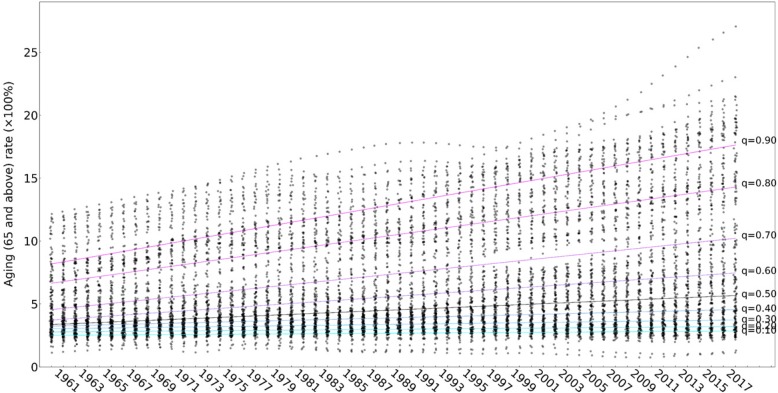
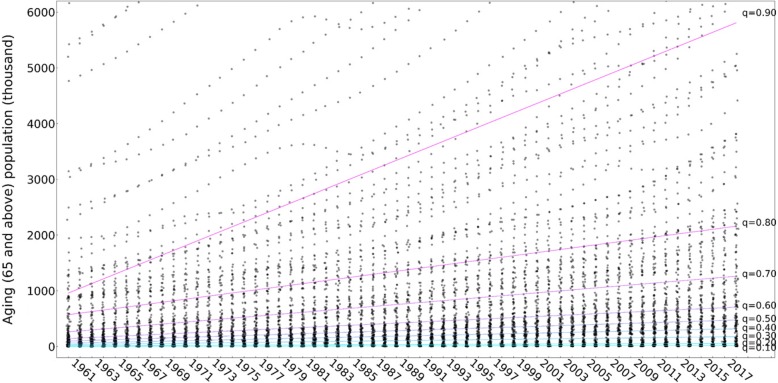
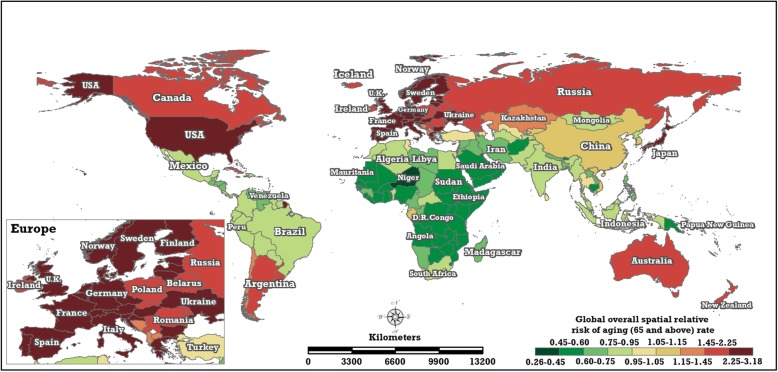
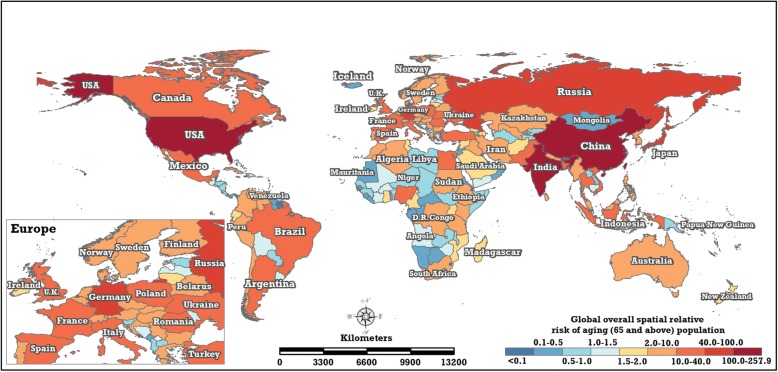
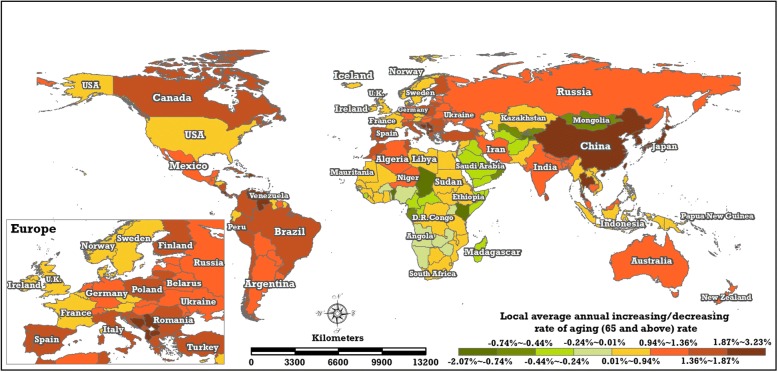
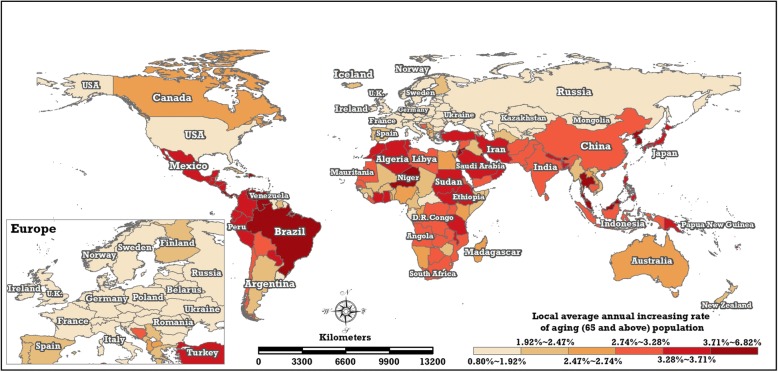
Results: Annual growth of the ageing (65 and above) rate occurred on six continents: Europe (0.1532%), Oceania (0.0873%), Asia (0.0834%), South America (0.0723%), North America (0.0673%) and Africa (0.0069%). The coefficient of variation of the global ageing rate increased from 0.54 in 1960 to 0.69 in 2017. The global ageing rate and ageing population increased over this period, correlating positively with their quantiles. Most countries (37/39) in Europe belong to the top level with regard to the ageing rate, including the countries with the greatest degree of ageing-Sweden, Germany, Austria, Belgium and the UK-whose spatial relative risks of ageing are 3.180 (3.113-3.214), 3.071 (3.018-3.122), 2.951 (2.903-3.001), 2.932 (2.880-2.984) and 2.917 (2.869-2.967), respectively. Worldwide, 44 low ageing areas which were distributed mainly in Africa (26 areas) and Asia (15 areas) experienced a decreasing trend of ageing rates. The local trends of ageing population in the 195 areas increased.
Conclusions: The differentiation of global population ageing is becoming increasingly serious. Globally, all 195 areas showed an increasing local ageing trend in absolute terms, although there were 44 low-ageing areas that experienced a decreasing local trend of ageing rate. The statistical results may provide some baseline reference for developing public health policies in various countries or regions, especially in less-developed areas.
Keywords: Bayesian statistics; Global population ageing; Spatiotemporal evolution.
Conflict of interest statement
Ethics approval and consent to participate
Not applicable.
Consent for publication
Not applicable.
Competing interests
The authors declare that they have no competing interests.
Publisher’s Note
Springer Nature remains neutral with regard to jurisdictional claims in published maps and institutional affiliations.
Figures
References
-
- Partridge L, Deelen J, Slagboom PE. Facing up to the global challenges of ageing. Nature. 2018;561(7721):45–56. - PubMed
-
- Abegunde DO, Mathers CD, Adam T, Ortegon M, Strong K. The burden and costs of chronic diseases in low-income and middle-income countries. Lancet. 2007;370(9603):1929–1938. - PubMed
-
- Kinsella, K. and W. He, An aging world: 2008: International population reports. 2009: US Government Printing Office.
MeSH terms
Grants and funding
LinkOut - more resources
Full Text Sources
