

FLT PET/CT imaging of metastatic prostate cancer patients treated with pTVG-HP DNA vaccine and pembrolizumab
- PMID: 30700328
- PMCID: PMC6354338
- DOI: 10.1186/s40425-019-0516-1
FLT PET/CT imaging of metastatic prostate cancer patients treated with pTVG-HP DNA vaccine and pembrolizumab
Abstract
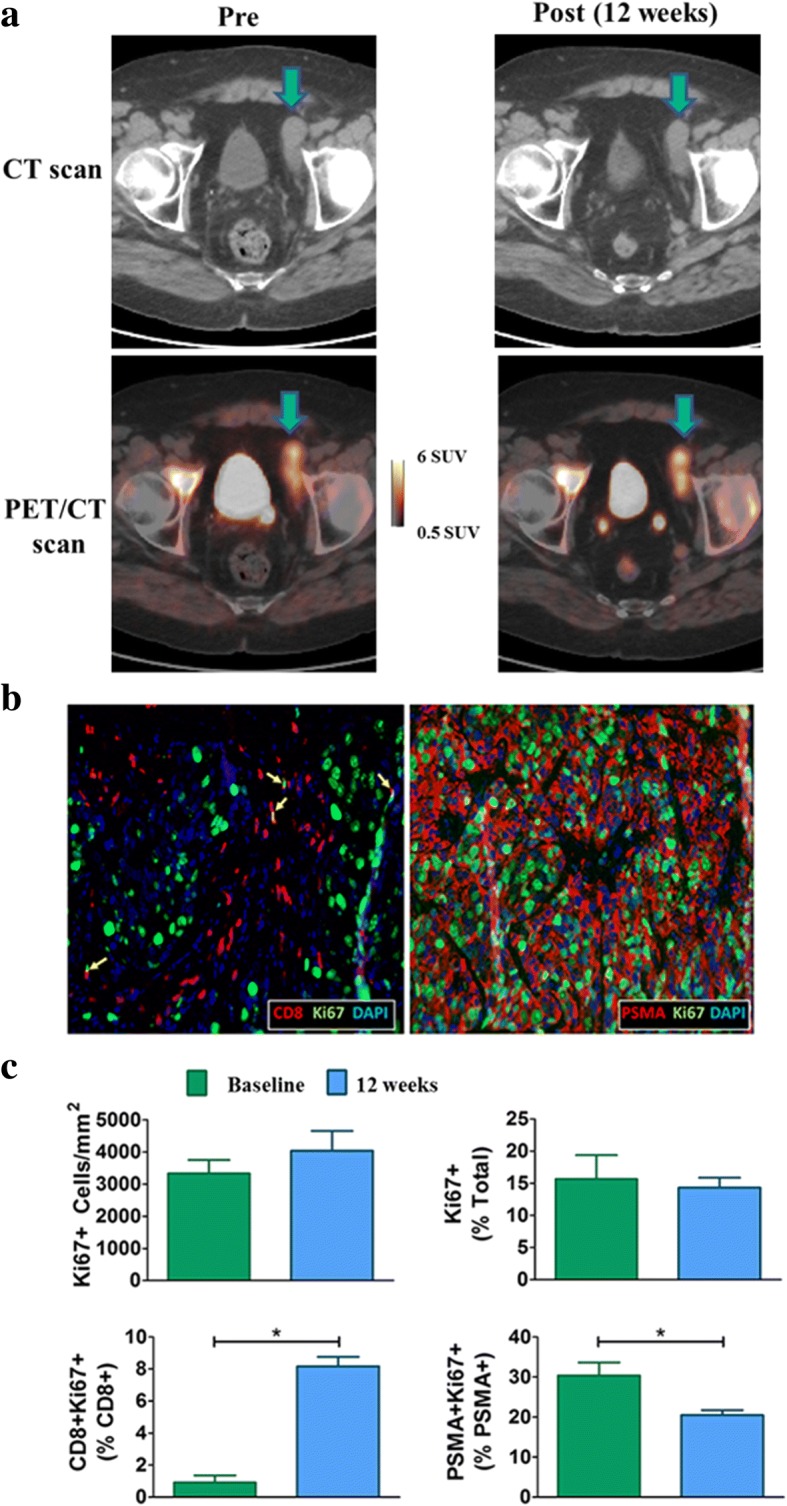
Background: Immunotherapy has demonstrated remarkable success in treating different cancers. Nonetheless, a large number of patients do not respond, many respond without immediate changes detectable with conventional imaging, and many have unusual immune-related adverse events that cannot be predicted in advance. In this exploratory study, we investigate how 3'-Deoxy-3'-18F-fluorothymidine (FLT) positron emission tomography (PET) measurements of tumor and immune cell proliferation might be utilized as biomarkers in immunotherapy.
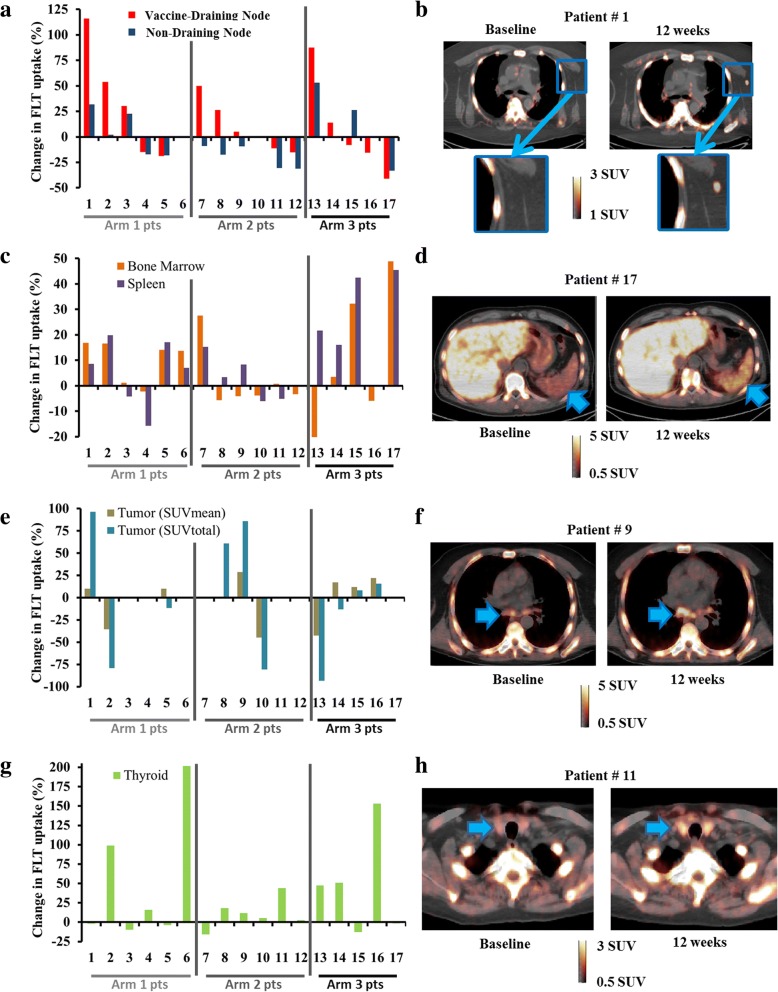
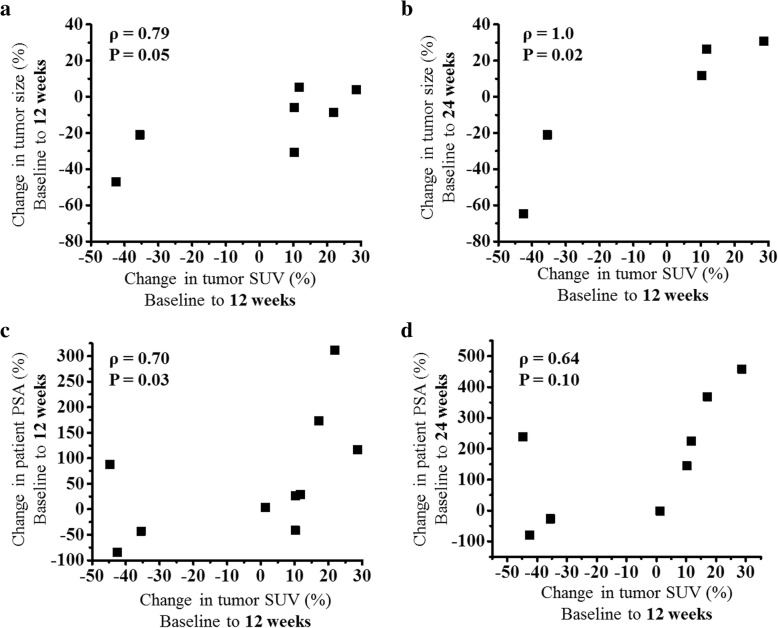
Methods: Seventeen patients with metastatic castrate resistant prostate cancer were treated with combination pTVG-HP DNA vaccine and pembrolizumab. Patients underwent baseline and 12-week FLT PET/CT scans. FLT PET standardized uptake values (SUVs) were extracted from tumors, non-metastatic lymph nodes, spleen, bone marrow, pancreas, and thyroid to quantify cell proliferation in these tissues. Regional immune cell responses to pTVG-HP DNA vaccine were assessed by comparing FLT uptake changes in vaccine draining and non-draining lymph nodes. Cox proportional hazards regression was utilized to relate FLT uptake and other clinical markers (PSA and tumor size) to progression-free survival. Area under receiver operating characteristic (AUC) curves and concordance indices were used to assess the predictive capabilities of FLT uptake.
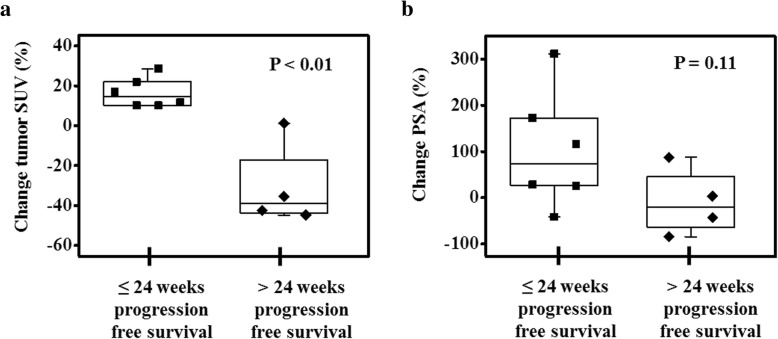
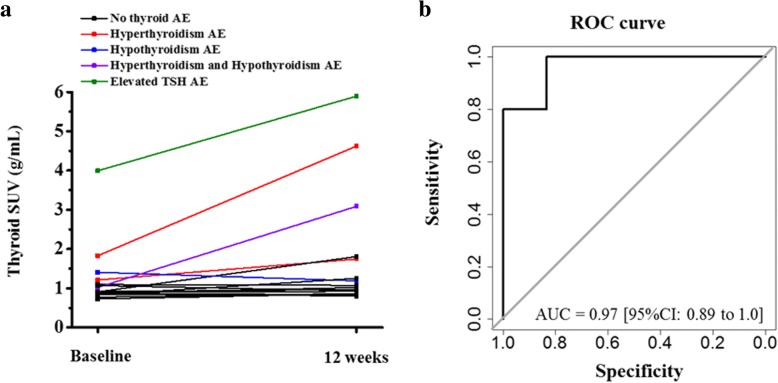
Results: Changes in FLT uptake in vaccine draining lymph nodes were significantly greater than changes in non-draining lymph nodes (P = 0.02), suggesting a regional immune response to vaccination. However, the changes in FLT uptake in lymph nodes were not significantly predictive of progression-free survival. Increases in tumor FLT uptake were significantly predictive of shorter progression-free survival (concordance index = 0.83, P < 0.01). Baseline FLT uptake in the thyroid was significantly predictive of whether or not a patient would subsequently experience a thyroid-related adverse event (AUC = 0.97, P < 0.01).
Conclusions: FLT PET uptake was significantly predictive of progression-free survival and the occurrence of adverse events relating to thyroid function. The results suggest FLT PET imaging has potential as a biomarker in immunotherapy, providing a marker of tumor and immune responses, and as a possible means of anticipating specific immune-related adverse events.
Trial registration: NCT02499835 .
Keywords: Adverse events; Cell proliferation; Clinical trial; DNA vaccine; FLT PET; Imaging; Pembrolizumab; Prostate cancer; Response assessment.
Conflict of interest statement
Ethics approval and consent to participate
The protocol for this study was reviewed and approved by all local (University of Wisconsin Human Subjects’ Review Board (IRB). All patients gave written informed consent for participation.
Consent for publication
Not applicable.
Competing interests
Douglas G. McNeel has ownership interest, has received research support, and serves as consultant to Madison Vaccines, Inc. which has licensed intellectual property related to this content. None of the other authors have relevant potential conflicts of interest.
Publisher’s Note
Springer Nature remains neutral with regard to jurisdictional claims in published maps and institutional affiliations.
Figures
Similar articles
-
FLT-PET At 6 Weeks Predicts Response Assessed by CT at 12 Weeks in Melanoma Patients Treated With Pembrolizumab.Clin Nucl Med. 2020 Apr;45(4):267-275. doi: 10.1097/RLU.0000000000002967. Clin Nucl Med. 2020. PMID: 32108700 Free PMC article.
-
More advantages in detecting bone and soft tissue metastases from prostate cancer using 18F-PSMA PET/CT.Hell J Nucl Med. 2019 Jan-Apr;22(1):6-9. doi: 10.1967/s002449910952. Epub 2019 Mar 7. Hell J Nucl Med. 2019. PMID: 30843003
-
Phase II Trial of a DNA Vaccine Encoding Prostatic Acid Phosphatase (pTVG-HP [MVI-816]) in Patients With Progressive, Nonmetastatic, Castration-Sensitive Prostate Cancer.J Clin Oncol. 2019 Dec 20;37(36):3507-3517. doi: 10.1200/JCO.19.01701. Epub 2019 Oct 23. J Clin Oncol. 2019. PMID: 31644357 Free PMC article. Clinical Trial.
-
FLT: measuring tumor cell proliferation in vivo with positron emission tomography and 3'-deoxy-3'-[18F]fluorothymidine.Semin Nucl Med. 2007 Nov;37(6):429-39. doi: 10.1053/j.semnuclmed.2007.08.001. Semin Nucl Med. 2007. PMID: 17920350 Review.
-
Molecular PET and PET/CT imaging of tumour cell proliferation using F-18 fluoro-L-thymidine: a comprehensive evaluation.Nucl Med Commun. 2009 Dec;30(12):908-17. doi: 10.1097/MNM.0b013e32832ee93b. Nucl Med Commun. 2009. PMID: 19794320 Review.
Cited by
-
Blood-derived dendritic cell vaccinations induce immune responses that correlate with clinical outcome in patients with chemo-naive castration-resistant prostate cancer.J Immunother Cancer. 2019 Nov 14;7(1):302. doi: 10.1186/s40425-019-0787-6. J Immunother Cancer. 2019. PMID: 31727154 Free PMC article. Clinical Trial.
-
Radionuclide Imaging of Cytotoxic Immune Cell Responses to Anti-Cancer Immunotherapy.Biomedicines. 2022 May 5;10(5):1074. doi: 10.3390/biomedicines10051074. Biomedicines. 2022. PMID: 35625811 Free PMC article. Review.
-
Insights into immuno-oncology drug development landscape with focus on bone metastasis.Front Immunol. 2023 Jul 5;14:1121878. doi: 10.3389/fimmu.2023.1121878. eCollection 2023. Front Immunol. 2023. PMID: 37475868 Free PMC article. Review.
-
Deciphering Tumor Response: The Role of Fluoro-18-d-Glucose Uptake in Evaluating Targeted Therapies with Tyrosine Kinase Inhibitors.J Clin Med. 2024 May 31;13(11):3269. doi: 10.3390/jcm13113269. J Clin Med. 2024. PMID: 38892979 Free PMC article.
-
Comparison of DNA and mRNA vaccines against cancer.Drug Discov Today. 2020 Mar;25(3):552-560. doi: 10.1016/j.drudis.2019.12.003. Epub 2019 Dec 13. Drug Discov Today. 2020. PMID: 31843577 Free PMC article. Review.
References
Publication types
MeSH terms
Substances
Associated data
Grants and funding
LinkOut - more resources
Full Text Sources
Other Literature Sources
Medical
Research Materials
Miscellaneous