

Deubiquitinating enzyme USP30 maintains basal peroxisome abundance by regulating pexophagy
- PMID: 30700497
- PMCID: PMC6400567
- DOI: 10.1083/jcb.201804172
Deubiquitinating enzyme USP30 maintains basal peroxisome abundance by regulating pexophagy
Abstract
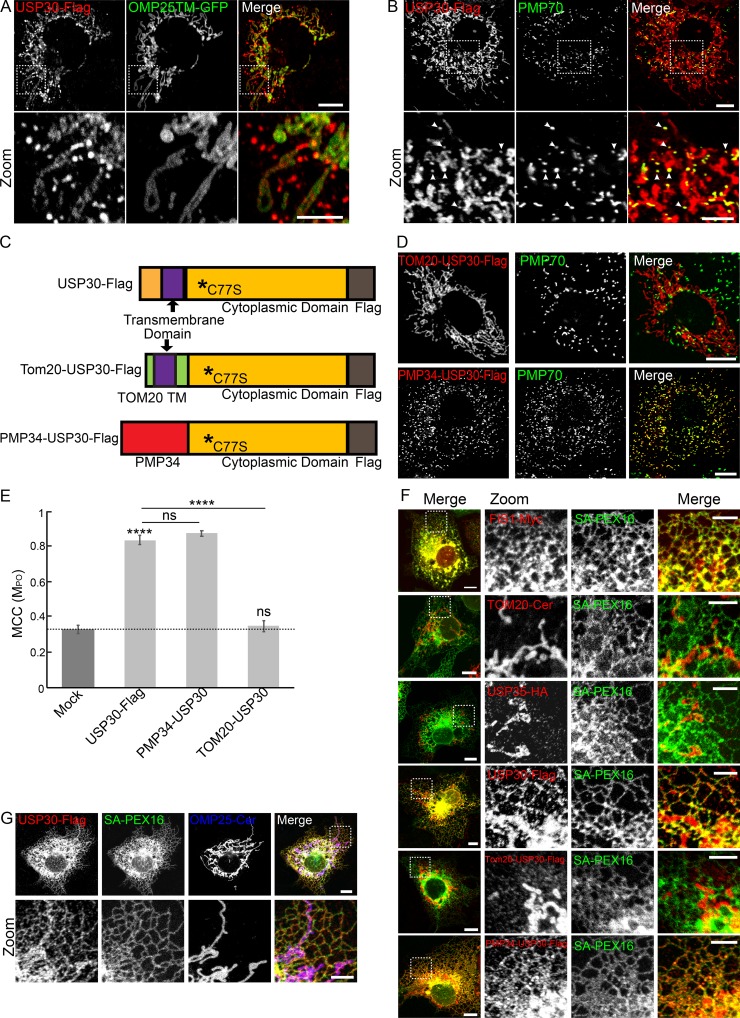
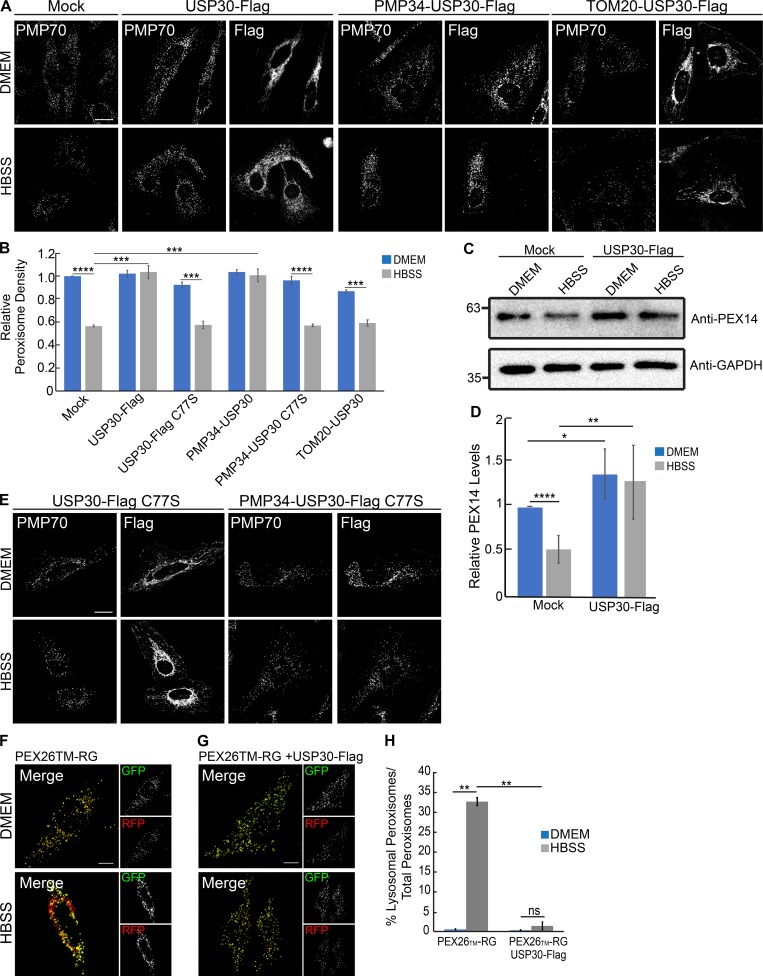
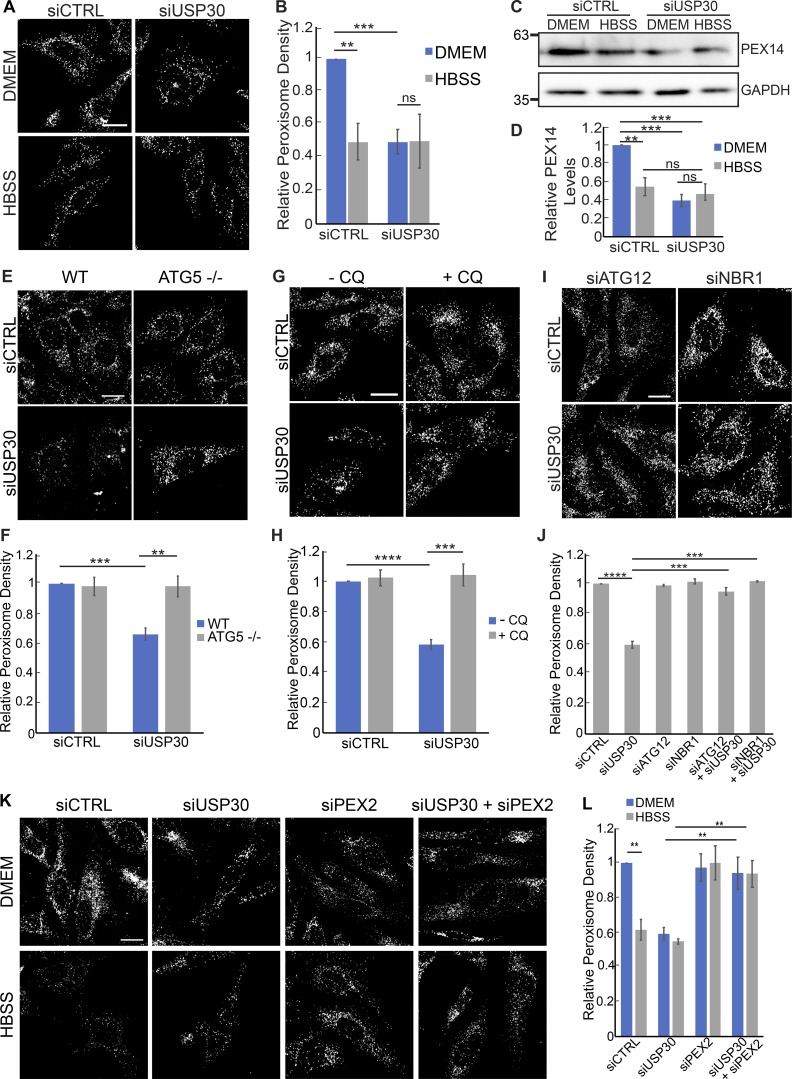
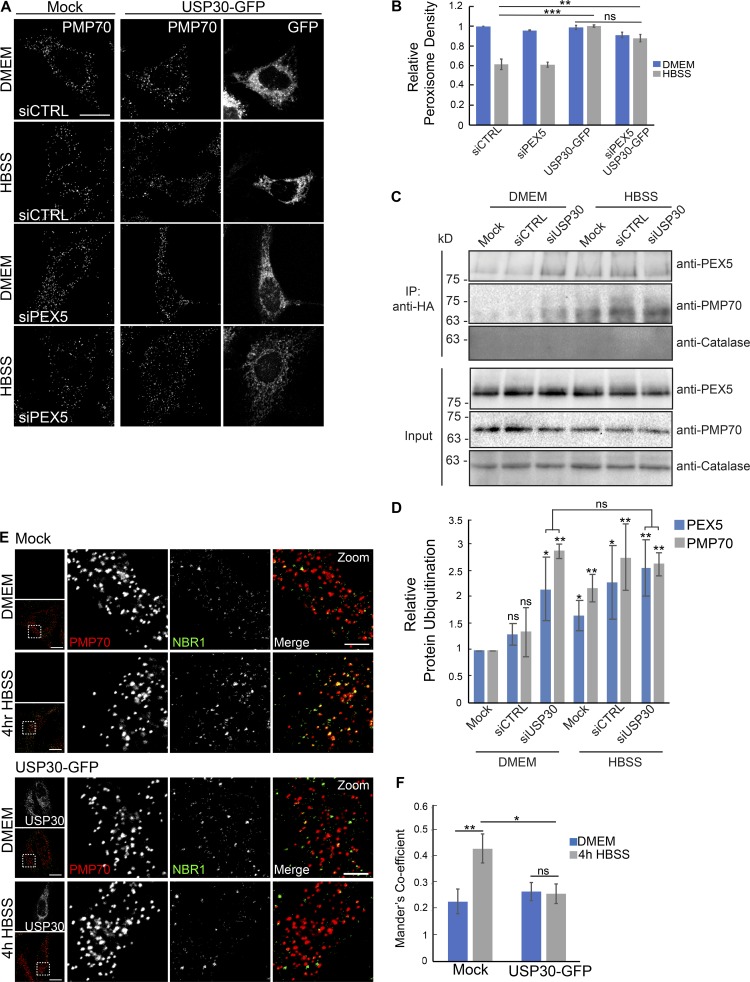
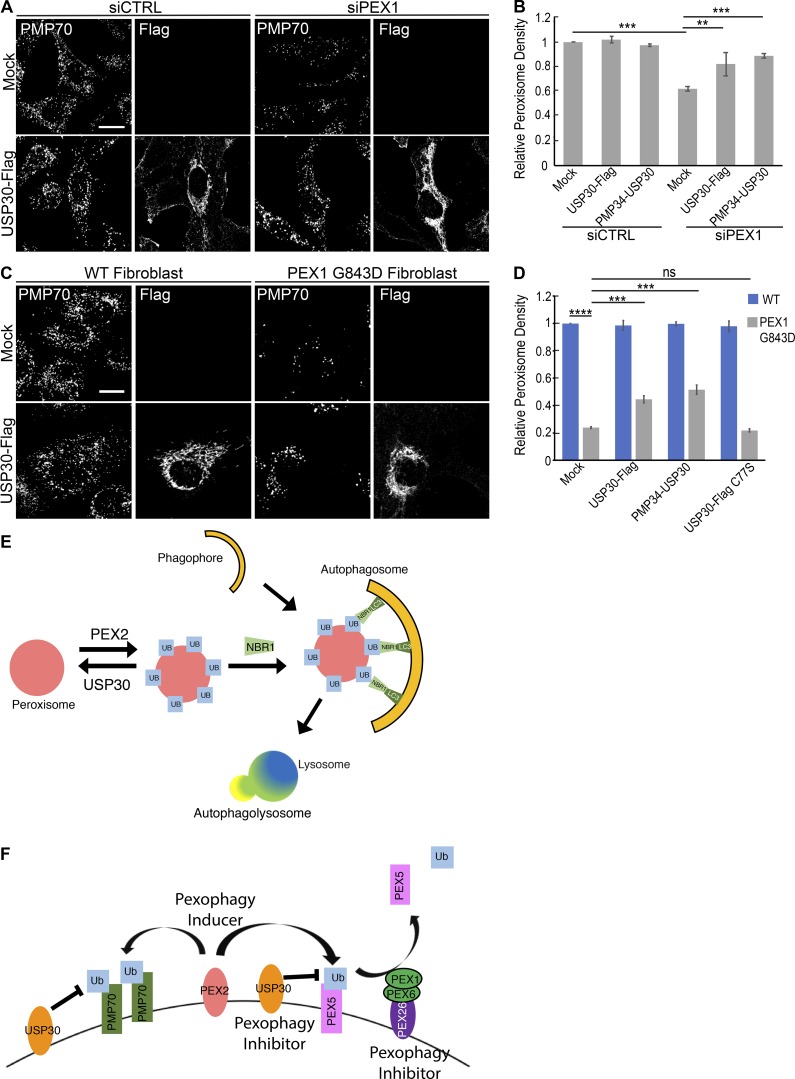
The regulation of organelle abundance is critical for cell function and survival; however, the mechanisms responsible are not fully understood. In this study, we characterize a role of the deubiquitinating enzyme USP30 in peroxisome maintenance. Peroxisomes are highly dynamic, changing in abundance in response to metabolic stress. In our recent study identifying the role of USP30 in mitophagy, we observed USP30 to be localized to punctate structures resembling peroxisomes. We report here that USP30, best known as a mitophagy regulator, is also necessary for regulating pexophagy, the selective autophagic degradation of peroxisomes. We find that overexpressing USP30 prevents pexophagy during amino acid starvation, and its depletion results in pexophagy induction under basal conditions. We demonstrate that USP30 prevents pexophagy by counteracting the action of the peroxisomal E3 ubiquitin ligase PEX2. Finally, we show that USP30 can rescue the peroxisome loss observed in some disease-causing peroxisome mutations, pointing to a potential therapeutic target.
© 2019 Riccio et al.
Figures
Comment in
-
New aspects of USP30 biology in the regulation of pexophagy.Autophagy. 2019 Sep;15(9):1634-1637. doi: 10.1080/15548627.2019.1615304. Epub 2019 Jun 9. Autophagy. 2019. PMID: 31356149 Free PMC article.
Similar articles
-
Dual role of USP30 in controlling basal pexophagy and mitophagy.EMBO Rep. 2018 Jul;19(7):e45595. doi: 10.15252/embr.201745595. Epub 2018 Jun 12. EMBO Rep. 2018. PMID: 29895712 Free PMC article.
-
USP30: protector of peroxisomes and mitochondria.Mol Cell Oncol. 2019 Apr 16;6(3):1600350. doi: 10.1080/23723556.2019.1600350. eCollection 2019. Mol Cell Oncol. 2019. PMID: 31131315 Free PMC article.
-
Regulation of mitochondrial morphology by USP30, a deubiquitinating enzyme present in the mitochondrial outer membrane.Mol Biol Cell. 2008 May;19(5):1903-11. doi: 10.1091/mbc.e07-11-1103. Epub 2008 Feb 20. Mol Biol Cell. 2008. PMID: 18287522 Free PMC article.
-
Beyond Deubiquitylation: USP30-Mediated Regulation of Mitochondrial Homeostasis.Adv Exp Med Biol. 2017;1038:133-148. doi: 10.1007/978-981-10-6674-0_10. Adv Exp Med Biol. 2017. PMID: 29178074 Review.
-
The intriguing role of USP30 inhibitors as deubiquitinating enzymes from the patent literature since 2013.Expert Opin Ther Pat. 2022 May;32(5):523-559. doi: 10.1080/13543776.2022.2003780. Epub 2022 Apr 4. Expert Opin Ther Pat. 2022. PMID: 34743664 Review.
Cited by
-
Cell Biology of Parkin: Clues to the Development of New Therapeutics for Parkinson's Disease.CNS Drugs. 2022 Dec;36(12):1249-1267. doi: 10.1007/s40263-022-00973-7. Epub 2022 Nov 15. CNS Drugs. 2022. PMID: 36378485 Review.
-
Aging lowers PEX5 levels in cortical neurons in male and female mouse brains.Mol Cell Neurosci. 2020 Sep;107:103536. doi: 10.1016/j.mcn.2020.103536. Epub 2020 Aug 7. Mol Cell Neurosci. 2020. PMID: 32777345 Free PMC article.
-
Ubiquitin ligase MARCH5 localizes to peroxisomes to regulate pexophagy.J Cell Biol. 2022 Jan 3;221(1):e202103156. doi: 10.1083/jcb.202103156. Epub 2021 Nov 8. J Cell Biol. 2022. PMID: 34747980 Free PMC article.
-
The p97 ATPase and its adaptor UBXD8 maintain peroxisome pools by preventing pexophagy.J Cell Biol. 2025 Sep 1;224(9):e202409024. doi: 10.1083/jcb.202409024. Epub 2025 Jul 29. J Cell Biol. 2025. PMID: 40728716
-
The Peroxisome-Autophagy Redox Connection: A Double-Edged Sword?Front Cell Dev Biol. 2021 Dec 16;9:814047. doi: 10.3389/fcell.2021.814047. eCollection 2021. Front Cell Dev Biol. 2021. PMID: 34977048 Free PMC article. Review.
References
-
- Braverman N.E., Raymond G.V., Rizzo W.B., Moser A.B., Wilkinson M.E., Stone E.M., Steinberg S.J., Wangler M.F., Rush E.T., Hacia J.G., and Bose M.. 2016. Peroxisome biogenesis disorders in the Zellweger spectrum: An overview of current diagnosis, clinical manifestations, and treatment guidelines. Mol. Genet. Metab. 117:313–321. 10.1016/j.ymgme.2015.12.009 - DOI - PMC - PubMed
Publication types
MeSH terms
Substances
Grants and funding
LinkOut - more resources
Full Text Sources
Other Literature Sources
Molecular Biology Databases
