. 2019 Jan 30;4(1):e00698-18.
doi: 10.1128/mSphereDirect.00698-18.

The Gut Microbiota Is Associated with Clearance of Clostridium difficile Infection Independent of Adaptive Immunity

Affiliations

The Gut Microbiota Is Associated with Clearance of Clostridium difficile Infection Independent of Adaptive Immunity

Jhansi L Leslie et al. mSphere. .

Abstract

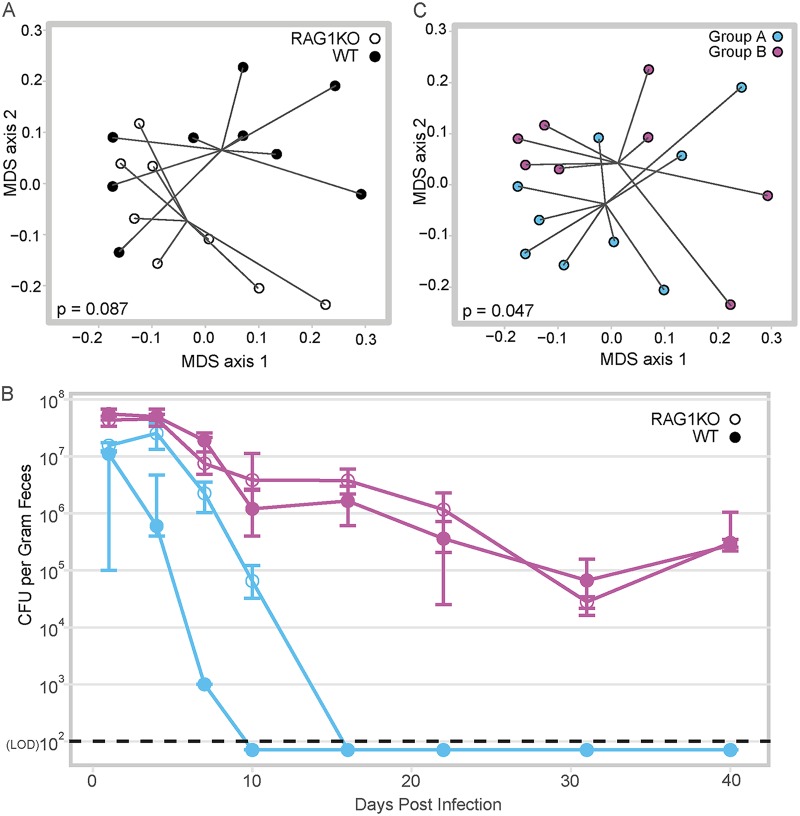
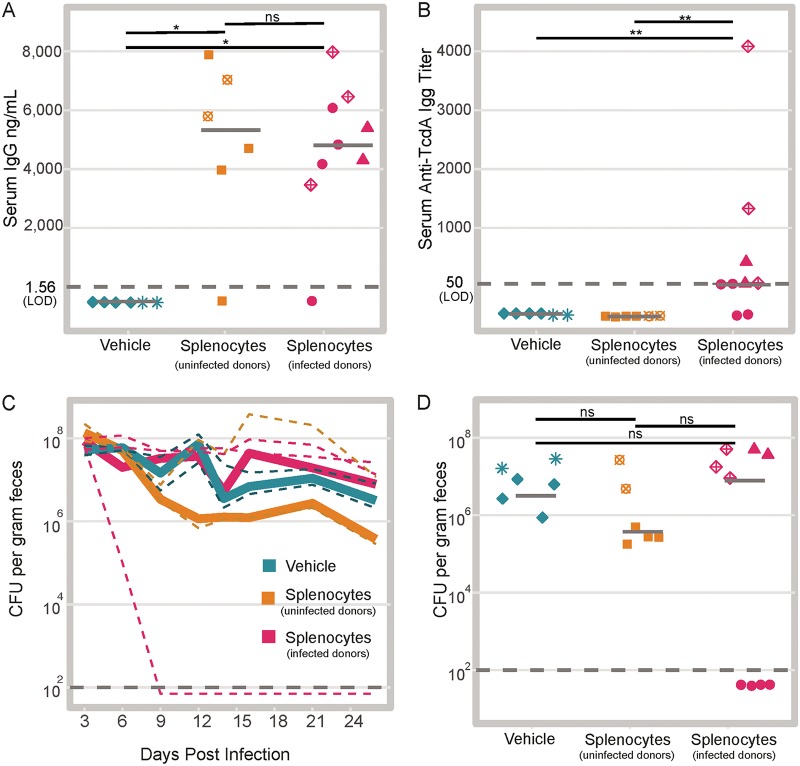
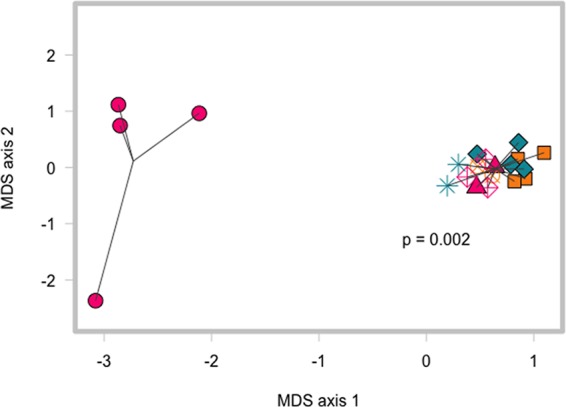
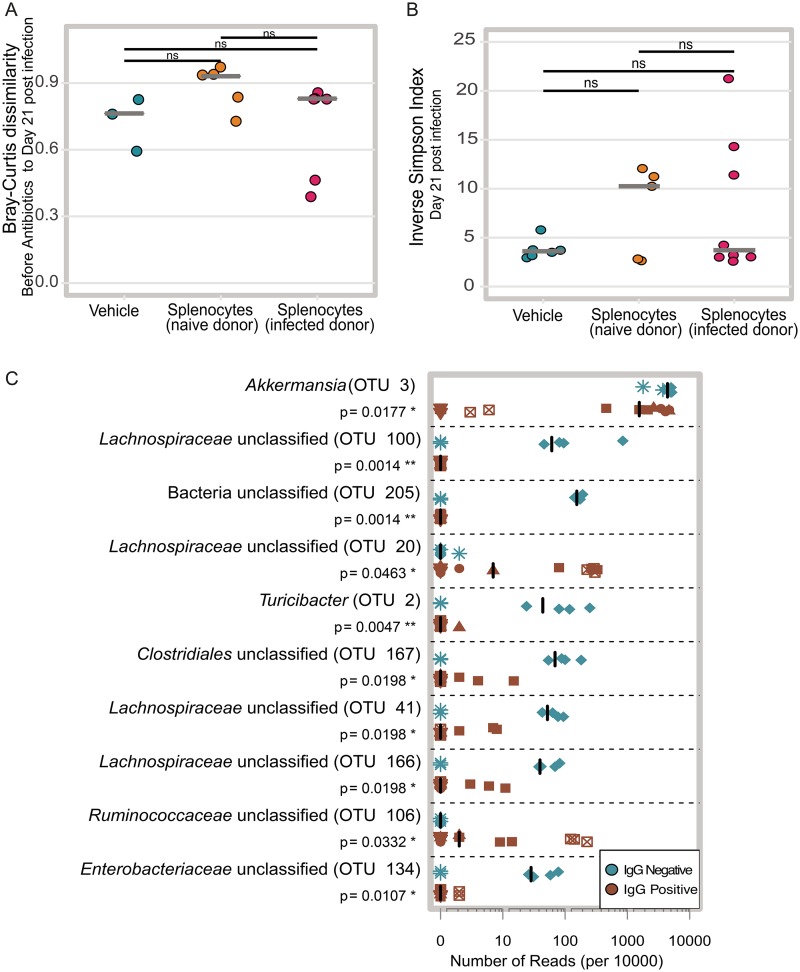
Clostridium (Clostridioides) difficile, a Gram-positive, anaerobic bacterium, is the leading single cause of nosocomial infections in the United States. A major risk factor for Clostridium difficile infection (CDI) is prior exposure to antibiotics, as they increase susceptibility to CDI by altering the membership of the microbial community enabling colonization. The importance of the gut microbiota in providing protection from CDI is underscored by the reported 80 to 90% success rate of fecal microbial transplants in treating recurrent infections. Adaptive immunity, specifically humoral immunity, is also sufficient to protect from both acute and recurrent CDI. However, the role of the adaptive immune system in mediating clearance of C. difficile has yet to be resolved. Using murine models of CDI, we found that adaptive immunity is dispensable for clearance of C. difficile However, random forest analysis using only two members of the resident bacterial community correctly identified animals that would go on to clear the infection with 66.7% accuracy. These findings indicate that the indigenous gut microbiota independent of adaptive immunity facilitates clearance of C. difficile from the murine gastrointestinal tract.IMPORTANCEClostridium difficile infection is a major cause of morbidity and mortality in hospitalized patients in the United States. Currently, the role of the adaptive immune response in modulating levels of C. difficile colonization is unresolved. This work suggests that the indigenous gut microbiota is a main factor that promotes clearance of C. difficile from the GI tract. Our results show that clearance of C. difficile can occur without contributions from the adaptive immune response. This study also has implications for the design of preclinical studies testing the efficacy of vaccines on clearance of bacterial pathogens, as inherent differences in the baseline community structure of animals may bias findings.

Keywords: Clostridium difficile; adaptive immunity; colonization resistance; intestinal colonization; microbiota.


Figures

FIG 1
FIG 1
Adaptive immunity is not required for clearance of C. difficile. (A) Multidimensional scaling (MDS) plot of Bray-Curtis dissimilarity between the fecal microbiota of WT mice versus RAG1−/− mice during cohousing, before antibiotic pretreatment. Each circle represents the fecal microbial community from one mouse. Closed circles depict WT mice, while open circles depict RAG1−/− (RAG1 knockout [RAG1KO]) mice; the communities are not significantly different by ANOSIM (P = 0.087). (B) Temporal C. difficile colonization by cage. The circles indicate the median level of colonization within a cage, while the bars indicate the interquartile ranges. Groups of mice that were cohoused together are denoted by shared color; closed circles are WT mice, while open circles are RAG1−/− mice. Day 40 colonization was used to determine whether C. difficile CFU/g feces was statically different between the groups (purple WT versus purple RAG1−/− P = 0.886, purple WT versus blue RAG1−/− P = 0.026, purple RAG1−/− versus blue RAG1−/− P = 0.026, purple RAG1−/− versus blue WT P = 0.026, purple WT versus blue WT P = 0.026). The LOD was 100 CFU/g feces. In cases where no CFU were detected, results are plotted below the LOD for visual clarity, while a value equal to the LOD/2 was used for statistical tests. Statistical significance was calculated using a Wilcoxon test with Benjamini-Hochberg correction for multiple comparisons. (C) MDS plot of Bray-Curtis dissimilarity of WT versus RAG1−/− mice during cohousing, before antibiotic pretreatment, analyzed by cohousing group rather than genotype. Each circle represents the fecal microbial community from one mouse; the mice that will go on to clear C. difficile are indicated with blue circles versus mice that will remain colonized indicated with purple circles (ANOSIM, P = 0.047).
FIG 2
FIG 2
Adoptive transfer of WT splenocytes into RAG1−/− mice is not sufficient to promote clearance. (A) Total serum IgG in the recipient RAG1−/− mice 24 days after injection of splenocytes (mice that received vehicle versus uninfected donor splenocytes P = 0.014; mice that received vehicle versus infected donor splenocytes P = 0.011; mice that received uninfected donor splenocytes versus infected donor splenocytes P = 0.814). Shapes represent mice in the same cage. Note two mice that were given splenocytes did not develop detectable serum IgG. Each symbol represents the value for an individual mouse. Solid gray lines represent the median values for groups. ns, not significant. (B) Anti-TcdA IgG titers in recipient RAG1−/− mice 24 days after transfer of splenocytes (mice that received vehicle versus infected donor splenocytes P = 0.008; mice that received vehicle versus uninfected donor splenocytes P = not significant; mice that received uninfected donor splenocytes versus infected donor splenocytes P = 0.008). Solid gray lines represent the medians. (C) Time course of intestinal colonization levels with C. difficile colored by treatment group. Solid lines represent the median values (CFU of C. difficile per gram of feces) for treatment groups. Dashed lines represent median colonization values within cages. (D) Colonization on day 26 postinfection (day 24 after adoptive transfer) colored by treatment group (mice that received vehicle versus uninfected donor splenocytes P = 0.689; mice that received vehicle versus infected donor splenocytes P = 1; mice that received uninfected donor splenocytes versus infected donor splenocytes P = 1). Solid gray lines represent the median values. The dark gray dashed line in each panel represents the limit of detection (LOD). In cases where no CFU were detected, results are plotted below the LOD for visual clarity, while a value equal to the LOD/2 was used for statistical tests. Statistical significance was calculated using a Wilcoxon test with Benjamini-Hochberg correction for multiple comparisons.
FIG 3
FIG 3
Clearance of C. difficile colonization is associated with significantly different pretransfer gut microbiota, not treatment groups. Multidimensional scaling (MDS) plot of Bray-Curtis dissimilarity index comparing communities in mice at day 1 postinfection (before adoptive transfer). Cages that cleared infection are shown as pink circles, while the other cages are represented by different shapes (mice that went on to clear C. difficile versus all other mice, ANOSIM P = 0.002).
FIG 4
FIG 4
Effect of reconstitution of adaptive immunity on the microbiota. (A) The Bray-Curtis dissimilarity between each mouse’s preantibiotic and day 21 postinfection communities (mice that received uninfected donor splenocytes versus infected donor splenocytes P = 0.214, mice that received uninfected donor splenocytes versus vehicle P = 0.214, mice that received infected donor splenocytes versus vehicle P = 0.714). Solid gray lines represent the median values for groups. (B) Inverse Simpson diversity of communities day 21 postinfection communities (mice that received uninfected donor splenocytes versus infected donor splenocytes P = 0.9433, mice that received uninfected donor splenocytes versus vehicle P = 0.943, mice that received infected donor splenocytes versus vehicle P = 0.943). Solid gray lines represent the medians. (C) Relative abundance of the top 10 OTUs with the highest LDA distinguishing between vehicle-treated RAG1−/− mice and IgG-positive mice. Each symbol represents the value for a single mouse. The different shapes represent different cages. Solid black lines represent the medians. Statistical significance was calculated using a Wilcoxon test with Benjamini-Hochberg correction for multiple comparisons.
FIG 5
FIG 5
Relative abundance of OTU pretreatment that correctly classify mice that will go on to clear C. difficile infection. Box and whisker plots showing the relative abundance of the two OTUs from the pretreatment fecal microbiota that differentiate animals that will go on to clear C. difficile infection with 66.6% accuracy. Statistical significance was calculated using a Wilcoxon test with Benjamini-Hochberg correction.

Similar articles

Cited by

References

    1. Lessa FC, Mu Y, Bamberg WM, Beldavs ZG, Dumyati GK, Dunn JR, Farley MM, Holzbauer SM, Meek JI, Phipps EC, Wilson LE, Winston LG, Cohen JA, Limbago BM, Fridkin SK, Gerding DN, McDonald LC. 2015. Burden of Clostridium difficile infection in the United States. N Engl J Med 372:825–834. doi:10.1056/NEJMoa1408913. - DOI - PMC - PubMed
    1. Chalmers JD, Akram AR, Singanayagam A, Wilcox MH, Hill AT. 2016. Risk factors for Clostridium difficile infection in hospitalized patients with community-acquired pneumonia. J Infect 73:45–53. doi:10.1016/j.jinf.2016.04.008. - DOI - PubMed
    1. Theriot CM, Koenigsknecht MJ, Carlson PE, Hatton GE, Nelson AM, Li B, Huffnagle GB, Li J, Young VB. 2014. Antibiotic-induced shifts in the mouse gut microbiome and metabolome increase susceptibility to Clostridium difficile infection. Nat Commun 5:3114. doi:10.1038/ncomms4114. - DOI - PMC - PubMed
    1. Carter GP, Rood JI, Lyras D. 2010. The role of toxin A and toxin B in Clostridium difficile-associated disease. Gut Microbes 1:58–64. doi:10.4161/gmic.1.1.10768. - DOI - PMC - PubMed
    1. Pruitt RN, Chumbler NM, Rutherford SA, Farrow MA, Friedman DB, Spiller B, Lacy DB. 2012. Structural determinants of Clostridium difficile toxin A glucosyltransferase activity. J Biol Chem 287:8013–8020. doi:10.1074/jbc.M111.298414. - DOI - PMC - PubMed

Publication types

LinkOut - more resources