. 2019 Mar 22;294(12):4529-4537.
doi: 10.1074/jbc.AC118.006530. Epub 2019 Jan 30.

Drosophila Subdued is a moonlighting transmembrane protein 16 (TMEM16) that transports ions and phospholipids

Affiliations

Drosophila Subdued is a moonlighting transmembrane protein 16 (TMEM16) that transports ions and phospholipids

Trieu Le et al. J Biol Chem. .

Abstract

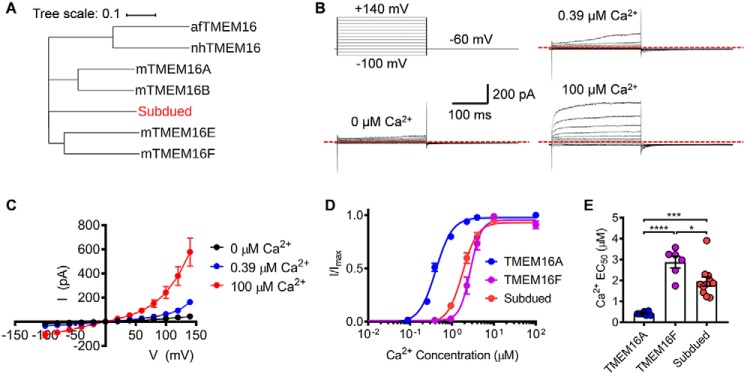
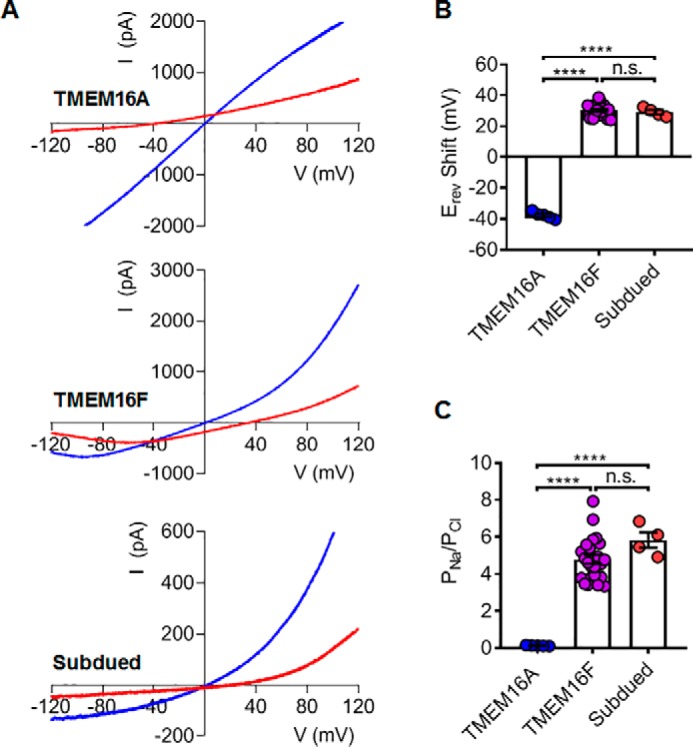
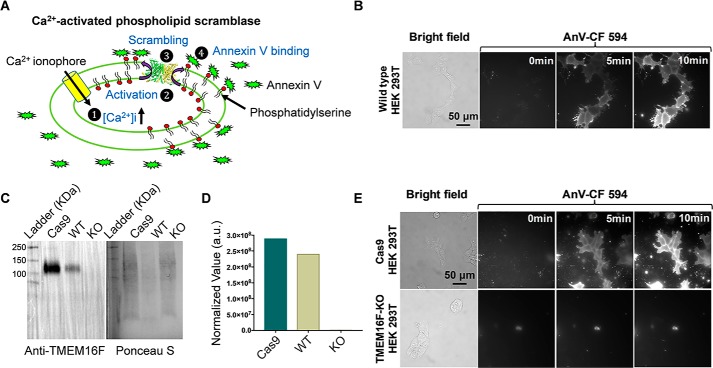
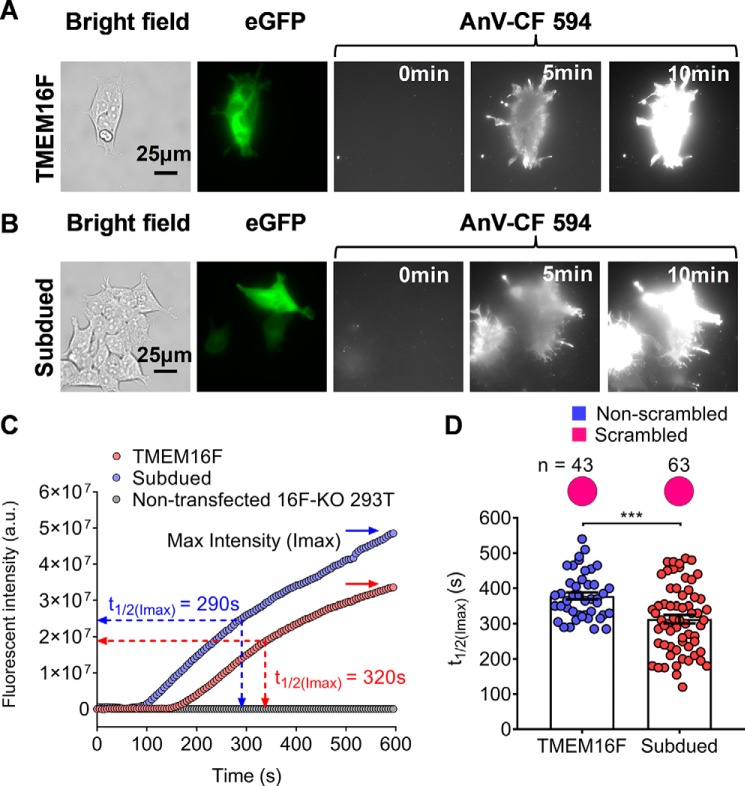
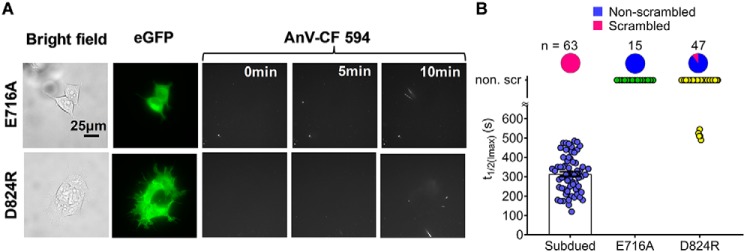
Transmembrane protein 16 (TMEM16) family members play numerous important physiological roles, ranging from controlling membrane excitability and secretion to mediating blood coagulation and viral infection. These diverse functions are largely due to their distinct biophysical properties. Mammalian TMEM16A and TMEM16B are Ca2+-activated Cl- channels (CaCCs), whereas mammalian TMEM16F, fungal afTMEM16, and nhTMEM16 are moonlighting (multifunctional) proteins with both Ca2+-activated phospholipid scramblase (CaPLSase) and Ca2+-activated, nonselective ion channel (CAN) activities. To further understand the biological functions of the enigmatic TMEM16 proteins in different organisms, here, by combining an improved annexin V-based CaPLSase-imaging assay with inside-out patch clamp technique, we thoroughly characterized Subdued, a Drosophila TMEM16 ortholog. We show that Subdued is also a moonlighting transport protein with both CAN and CaPLSase activities. Using a TMEM16F-deficient HEK293T cell line to avoid strong interference from endogenous CaPLSases, our functional characterization and mutagenesis studies revealed that Subdued is a bona fide CaPLSase. Our finding that Subdued is a moonlighting TMEM16 expands our understanding of the molecular mechanisms of TMEM16 proteins and their evolution and physiology in both Drosophila and humans.

Keywords: Anoctamin; CaCC; Drosophila; TMEM16; calcium-binding protein; ion channel; membrane biophysics; membrane transport; phospholipid scramblase; protein moonlighting.


Conflict of interest statement

The authors declare that they have no conflicts of interest with the contents of this article

Figures

Figure 1.
Figure 1.
Subdued encodes a Ca2+- and voltage-activated ion channel that is different from TMEM16A–CaCC. A, phylogenic tree showing the evolutionary relationship between Subdued and other well-characterized members of TMEM16 family. Sequence alignment was performed using Clustal Omega, and the phylogenetic tree was plotted using iTOL-v4. B, Subdued current traces elicited by different voltages and various intracellular Ca2+ concentrations from inside-out patch recordings. Voltage protocol used is shown on the top left. C, current–voltage (I–V) relationship of Subdued current measured at 0, 0.39, and 100 μm Ca2+. D, Ca2+ dose-response curves of mTMEM1A, mTMEM16F, and Subdued. E, half-maximal activation concentrations of Ca2+ (EC50) of mTMEM16A, mTMEM16F, and Subdued channels. With one-way ANOVA with Tukey's multiple comparisons test, in E, p values are <0.0001 (TMEM16A versus TMEM16F), 0.0001 (TMEM16A versus subdued), and 0.0181 (TMEM16F versus Subdued). Error bars indicate S.E.
Figure 2.
Figure 2.
Subdued is a nonselective ion channel with higher cation permeability. A, measurements of the reversal potentials (Erev) for mTMEM16A, mTMEM16F, and Subdued. Blue traces denote currents at symmetric 140 mm NaCl. Red traces denote currents upon switching to an intracellular solution with low 14 mm NaCl. A voltage ramp ranging from −120 to +120 mV was used to elicit channel activation and followed by a reserved +120 to −120 mV ramp, which was used to measure reversal potentials. Currents were recorded under 100 μm intracellular Ca2+. B, changes in the reversal potential (ΔErev) of mTMEM16A, mTMEM16F, and Subdued. C, permeability ratio PNa/PCl mTMEM16A, mTMEM16F, and Subdued calculated based on ΔErev in B using the Goldman–Hodgkin–Katz equation (see “Experimental procedures”). With one-way ANOVA with Tukey's multiple comparisons tests, in B, p values are <0.0001 (TMEM16A versus TMEM16F), <0.0001 (TMEM16A versus subdued), and 0.8393 (TMEM16F versus subdued); and in C, p values are <0.0001 (TMEM16A versus TMEM16F), <0.0001 (TMEM16A versus subdued), and 0.1792 (TMEM16F versus subdued). Error bars indicate S.E. n.s. denotes nonsignificant.
Figure 3.
Figure 3.
Generation of a TMEM16F deficient HEK293T cell line to eliminate endogenous CaPLSase interference. A, schematic demonstration of the microscopy-based, live-cell scrambling assay. In this assay, TMEM16 CaPLSases are activated by ionomycin-induced intracellular Ca2+ elevation (step 1), which subsequently mediates PS externalization (steps 2 and 3) and quickly attracts freely floating fluorescently tagged AnV (step 4). Increase in PS externalization will lead to the accumulation of AnV signal at the cell surface over time. B, WT HEK293T cells exhibited strong endogenous CaPLSase activity as examined using the assay shown in A. The CF 594–tagged AnV signal representing scrambling activity was recorded by time-lapse imaging for 10 min following application of 5 μm ionomycin (0 min) at a 5-s acquisition interval. C, Western blots showing endogenous TMEM16F expression in WT, Cas9 control (Cas9), and TMEM16F–KO HEK293T cells. Cell lysates were separated by SDS-PAGE gel and then analyzed by Western blotting with anti-TMEM16F antibody (left panel). Total protein loading was visualized via Ponceau S staining (right panel). D, the amount of TMEM16F expression from the Western blotting was normalized to the total protein loading from Ponceau S staining. E, endogenous CaPLSase activity in HEK293T cells was eliminated from the TMEM16F–KO cell line, whereas the Cas9-HEK293T cell line retained robust endogenous CaPLSase activity.
Figure 4.
Figure 4.
Subdued expression induces CaPLSase activity. A and B, exogenous expression of murine TMEM16F (A) and Subdued (B) in TMEM16F–KO HEK293T cells induced strong CaPLSase activity. The C-terminal eGFP tagged WT–TMEM16F was used to identify TMEM16F- or Subdued-expressing cells. The CF 594–tagged AnV signal representing phospholipid scrambling was recorded by time-lapsed imaging for 10 min following application of 5 μm ionomycin (0 min) at a 5-s acquisition interval (see Videos S1 and 2 for details). C, representative AnV fluorescent intensity changes over time for TMEM16F-WT and Subdued expressing cells in A and B. TMEM16F–KO HEK cells lacking CaPLSase activity were used as a negative control. t½(Imax) is defined as the time needed to reach 50% of the maximum fluorescence intensity (Imax) after ionomycin stimulation (see “Experimental procedures”). D, ionomycin-induced CaPLSase activity for WT–TMEM16F and Subdued as quantified by their t½(Imax). Each data point represents one single cell, and n denotes the total number of expressing cells analyzed. The pie charts represent the percentages of the Subdued-expressing cells that scrambled after ionomycin application. Statistical analysis was performed using unpaired two-sided t test. *** indicates statistical significance corresponding to p value = 0.0002. Error bars indicate S.E.
Figure 5.
Figure 5.
Mutations of Subdued alter its CaPLSase activity. A, representative images of ionomycin-induced scrambling activity of TMEM16F–KO HEK293T cells transiently transfected with plasmids encoding eGFP-tagged Subdued mutations E716A and D824R. Expression was detected by the C terminus–tagged eGFP signal. The CF 594–tagged AnV signal representing phospholipid scrambling was recorded by time-lapsed imaging for 10 min following application of 5 μm ionomycin (0 min) at a 5-s acquisition interval. B, ionomycin-induced CaPLSase activity for WT and mutant Subdued as quantified by their t½(Imax). Each data point represents one single cell, and n denotes the total number of expressing cells that were analyzed. The pie charts represent the percentages of the Subdued-expressing cells that scrambled after ionomycin application. Error bars indicate S.E. non. scr indicates nonscrambling.

Similar articles

Cited by

References

    1. Yang Y. D., Cho H., Koo J. Y., Tak M. H., Cho Y., Shim W. S., Park S. P., Lee J., Lee B., Kim B. M., Raouf R., Shin Y. K., and Oh U. (2008) TMEM16A confers receptor-activated calcium-dependent chloride conductance. Nature 455, 1210–1215 10.1038/nature07313 - DOI - PubMed
    1. Caputo A., Caci E., Ferrera L., Pedemonte N., Barsanti C., Sondo E., Pfeffer U., Ravazzolo R., Zegarra-Moran O., and Galietta L. J. (2008) TMEM16A, a membrane protein associated with calcium-dependent chloride channel activity. Science 322, 590–594 10.1126/science.1163518 - DOI - PubMed
    1. Schroeder B. C., Cheng T., Jan Y. N., and Jan L. Y. (2008) Expression cloning of TMEM16A as a calcium-activated chloride channel subunit. Cell 134, 1019–1029 10.1016/j.cell.2008.09.003 - DOI - PMC - PubMed
    1. Milenkovic V. M., Brockmann M., Stöhr H., Weber B. H., and Strauss O. (2010) Evolution and functional divergence of the anoctamin family of membrane proteins. BMC Evol. Biol. 10, 319 10.1186/1471-2148-10-319 - DOI - PMC - PubMed
    1. Medrano-Soto A., Moreno-Hagelsieb G., McLaughlin D., Ye Z. S., Hendargo K. J., and Saier M. H. Jr. (2018) Bioinformatic characterization of the anoctamin superfamily of Ca2+-activated ion channels and lipid scramblases. PLoS One 13, e0192851 10.1371/journal.pone.0192851 - DOI - PMC - PubMed

Publication types

LinkOut - more resources