. 2019 Jan 30;10(1):497.
doi: 10.1038/s41467-019-08342-7.

The path of pre-ribosomes through the nuclear pore complex revealed by electron tomography

Affiliations

The path of pre-ribosomes through the nuclear pore complex revealed by electron tomography

Franck Delavoie et al. Nat Commun. .

Abstract

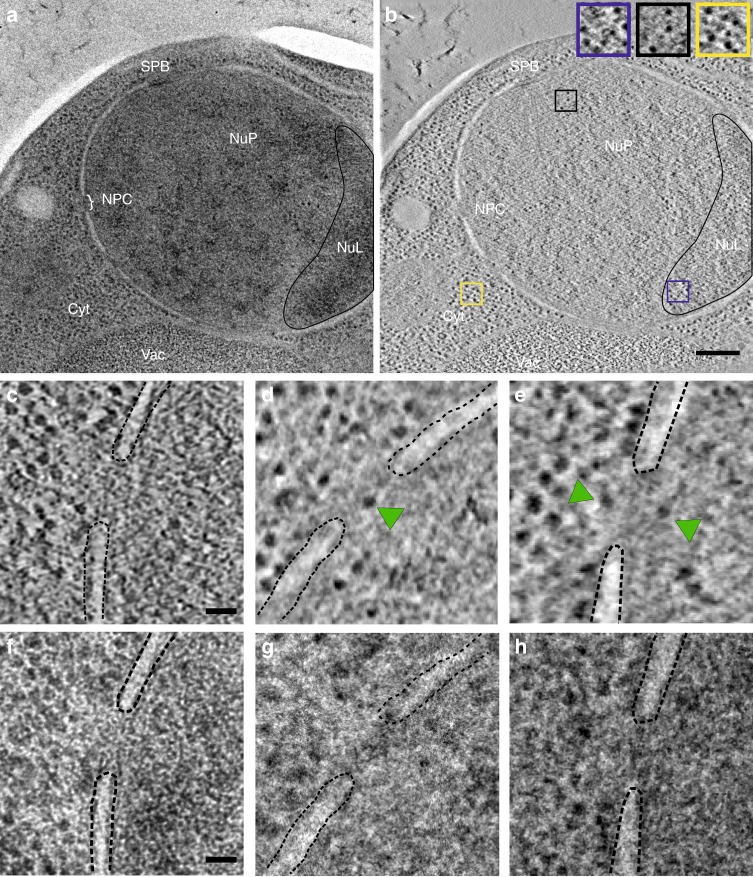
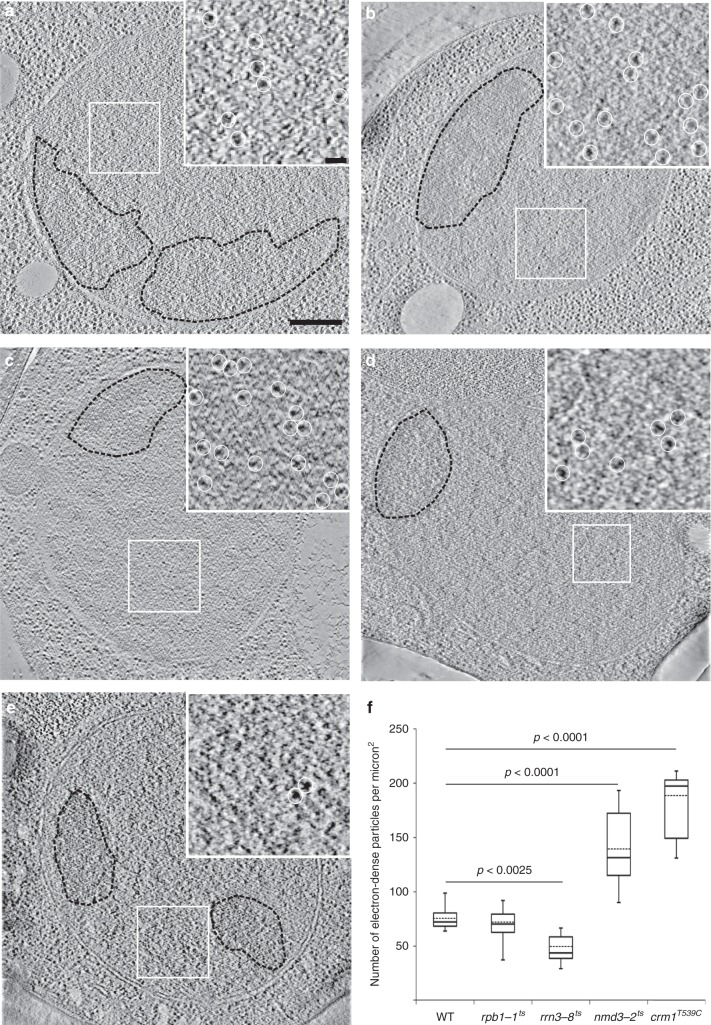
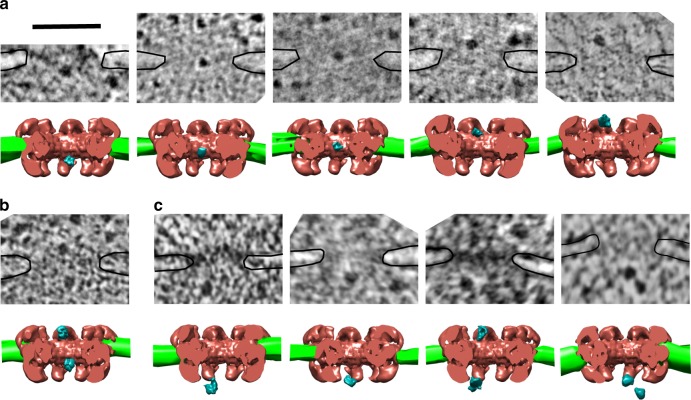
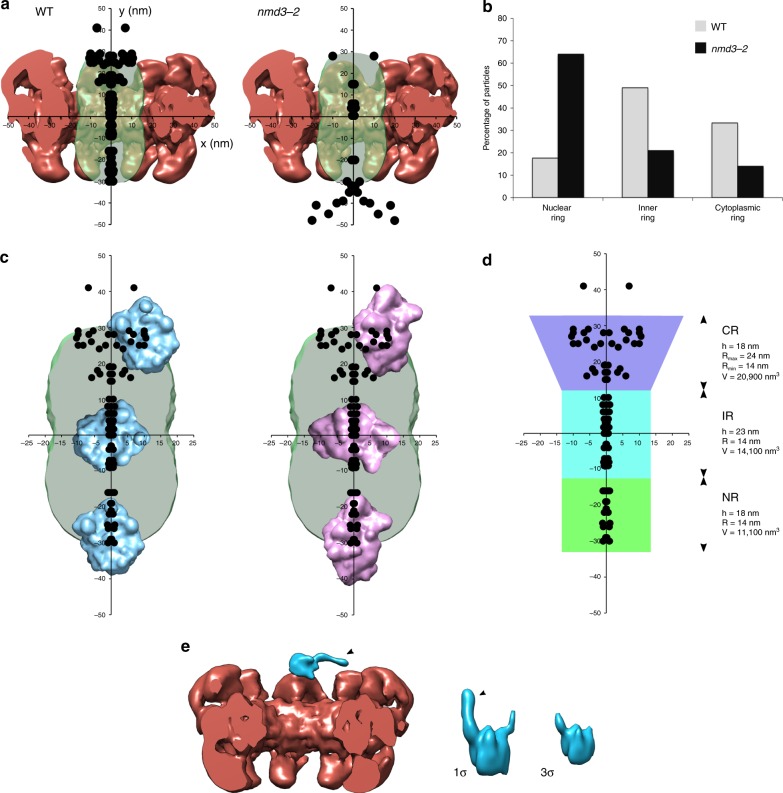
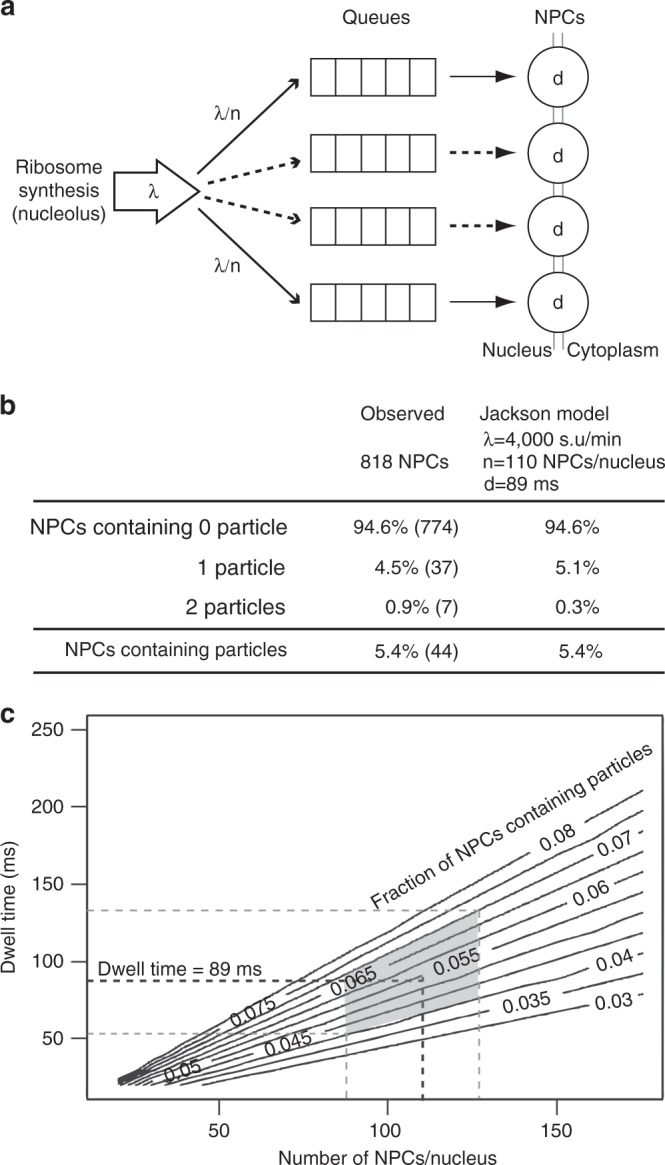
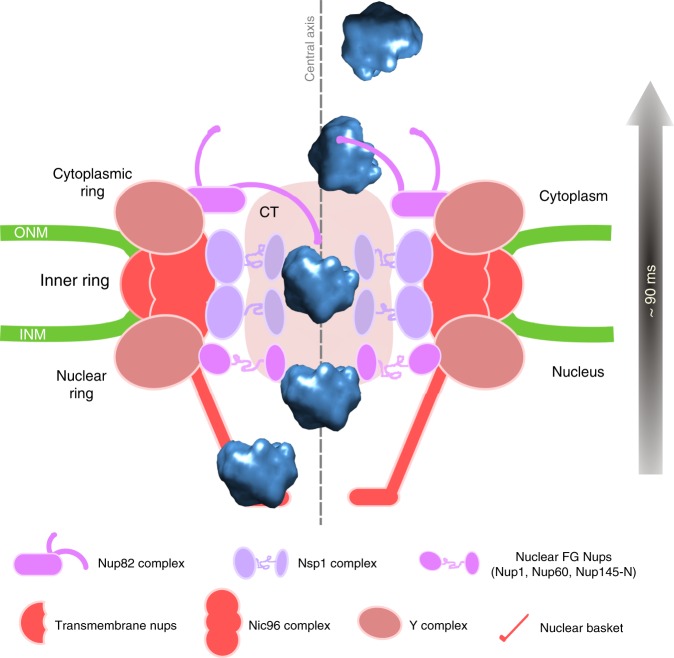
Determining the path of single ribonucleoprotein (RNP) particles through the 100 nm-wide nuclear pore complex (NPC) by fluorescence microscopy remains challenging due to resolution limitation and RNP labeling constraints. By using high-pressure freezing and electron tomography, here we captured snapshots of the translocation of native RNP particles through NPCs in yeast and analyzed their trajectory at nanometer-scale resolution. Morphological and functional analyses indicate that these particles mostly correspond to pre-ribosomes. They are detected in 5-6% of the NPCs, with no apparent bias for NPCs adjacent to the nucleolus. Their path closely follows the central axis of the NPC through the nuclear and inner rings, but diverges at the cytoplasmic ring, suggesting interactions with the cytoplasmic nucleoporins. By applying a probabilistic queueing model to our data, we estimated that the dwell time of pre-ribosomes in the yeast NPC is ~90 ms. These data reveal distinct steps of pre-ribosome translocation through the NPC.


Conflict of interest statement

The authors declare no competing interests.

Figures

Fig. 1
Fig. 1
Electron tomography reveals large cargoes in NPCs. a High-pressure frozen yeast cell visualized by conventional transmission electron microscopy. Vac: vacuole, Cyt: cytoplasm, NuP: nucleoplasm, NuL: nucleolus (black line), SPB spindle pole body and NPC nuclear pore complex. Scale bar: 200 nm. b A section of the electron tomogram showing the same area as in (a). Nuclear electron-dense particles are detected in the crescent-shaped nucleolus (blue frame) and the nucleoplasm (black frame), while ribosomes are visible in the cytoplasm (yellow frame). Scale bar: 200 nm. ce A selection of electron tomography images showing NPCs containing one or two large particles (green arrowheads). fg These particles are not seen by conventional transmission electron microscopy. The dashed lines delineate the nuclear envelope. Scale bar: 50 nm
Fig. 2
Fig. 2
Identification of the particles in NPCs as pre-ribosomes. Tomographic sections of high-pressure frozen and freeze-substituted yeast strains: (a) NOY505 (wild-type), (b) MNY8 (crm1T539C) treated with LMB, (c) nmd3-2ts at 37 °C, (d) rpb1-1ts at 37 °C, and (e) rrn3-8ts at 37 °C. The inset in each image shows an enlargement of the region of the nucleoplasm delineated by the white frame. The nucleolus is outlined by a dotted line and is better seen on the conventional TEM images of these areas (not shown). Electron-dense particles similar to those detected in NPCs (white circles) are observed in the nucleoplasm of wild-type cells. They strongly accumulate upon inactivation of Nmd3 and Crm1, and their number drops upon inactivation of RNA polymerase I transcription (rrn3 mutant), which strongly supports that they correspond to pre-ribosomes. Along the same line, the levels of these particles are not affected by inactivation of RNA polymerase II (rpb1 mutant). Scale bar: 500 nm. f Quantification of the density of nucleoplasmic electron-dense particles in the mutant strains compared to wild-type NOY505 cells. The box plot chart shows the median (line within the box), the mean (dash line within the box), and quartiles. Whiskers caps correspond to the maximum and minimum values. Statistical significance of the results was assessed by applying a one-way ANOVA test. Source data are provided as a Source Data file
Fig. 3
Fig. 3
3D-rendering of pre-ribosomal particles within the NPC. a The yeast NPC model was docked into subtomograms showing pre-ribosomal particles in various regions of the NPC in NOY505 or OGP103 cells. The gallery displays tomographic sections and the corresponding 3D models. Pre-ribosomal particles are segmented in blue, the nuclear envelope in green and the docked NPC model is shown in red. b An example of NPC containing two pre-ribosomal particles. c In nmd3-2ts cells at 37 °C, most pre-ribosomal particles were found at the nuclear ring or below. Black lines indicate the nuclear envelope. Scale bar: 100 nm
Fig. 4
Fig. 4
The path of the pre-ribosomes across the NPC. a Positions of pre-ribosomes in NPCs in wild-type cells (WT) and pre-60S particle nuclear export-defective mutant nmd3-2. The dots represent the centroid of the particles relative to the median plane section (X) and the central axis (Y) of the NPC. The distribution was mirrored along the Y-axis for the representation. b Distribution of pre-ribosomal particles in the nuclear, inner, and cytoplasmic rings in wild-type and nmd3-2 cells. c The central transporter was superimposed with the distribution of pre-ribosomal particles as in a and with pre-60S (blue) or a pre-40S (pink) particles at the same scale. The central transporter is large enough to accommodate pre-ribosomes whatever their orientation. The path of the particles is constrained in a 25–30 nm diameter channel at the center of the nuclear and inner rings. d The volume of the space explored by pre-ribosomal particles was estimated in the nuclear, inner, and cytoplasmic rings the NPC. For the diameter of the central channel, we took into consideration the longest dimension of a pre-ribosomal particle, i.e. 28 nm for a pre-40S particle. e A representative 3D reconstruction of a pre-ribosome at the cytoplasmic ring showing additional densities pointing towards the NPC, almost perpendicular to the central axis (black arrow). On this example, segmentation was performed by isosurfacing with a gray-level cut-off of 1σ but the additional density is still detected with 3σ cut-off (σ: standard deviation of the gray-level distribution). Source data for a and b are provided as a Source Data file
Fig. 5
Fig. 5
Determination of the dwell time of pre-ribosome in NPCs by a probabilistic method. a Nuclear export of pre-ribosomes was modeled according to a Jackson queueing network. Each NPC is characterized by a queue and a dwell time. We assume that pre-ribosomes are routed to NPCs with equal probability, which is supported by the even distribution of pre-ribosomes among nucleolar and nucleoplasmic NPCs. b Based on an average of 110 NPCs per cell and a flux of 4000 pre-ribosomal particles/min, the best fit of the model to the experimental data (5.4% of occupied NPCs) is obtained for a dwell time of 89 ms. The values predicted by the Jackson model correspond to NPCs with no particle, containing one particle, or occupied by one particle with one particle in the queue. c The robustness of this estimated dwell time was tested considering combined errors in the average number of NPCs (110 ± 20) and the observed NPC occupancy rate (5.4 ± 1.5%). The gray polygon delimits the domain defined by these values. The dwell time in this domain ranges from 55 to 140 ms
Fig. 6
Fig. 6
Model of the translocation of pre-ribosomal particles through the NPC. A pre-60S ribosomal particle crossing the NPC is represented. After transient interaction with the nuclear basket, pre-ribosomes are rapidly transferred to the central transporter, which constitutes the main permeability barrier. The path of the particles is constrained in a narrow channel along the central axis as they cross the nuclear and inner rings. Pre-ribosomes spend a longer time in the inner ring than in the nuclear or cytoplasmic rings, maybe due to the high density of FG Nups in the inner ring (especially the Nsp1/Nup49/Nup57 complex), which provides multiple contact sites for pre-ribosomes. We postulate that extraction from this narrow channel at the exit of the inner ring involves interaction with asymmetric Nups found at the cytoplasmic ring, like the Nup82 complex. Disassembly of the nuclear transport factors then makes transport irreversible. This path is consistent with the requirement of the Nsp1 and the Nup82 complexes for pre-ribosome translocation. The NPC and the pre-ribosome are drawn at the same scale. CT central transporter. Modeling of the pre-60S particle is based on PDB structure 5H4P [https://www.rcsb.org/structure/5H4P])

References

    1. Oeffinger M, Zenklusen D. To the pore and through the pore: a story of mRNA export kinetics. Biochim. Biophys. Acta. 2012;1819:494–506. doi: 10.1016/j.bbagrm.2012.02.011. - DOI - PMC - PubMed
    1. Sloan KE, Gleizes PE, Bohnsack MT. Nucleocytoplasmic transport of RNAs and RNA–Protein complexes. J. Mol. Biol. 2016;428:2040–2059. doi: 10.1016/j.jmb.2015.09.023. - DOI - PubMed
    1. Knockenhauer KE, Schwartz TU. The nuclear pore complex as a flexible and dynamic gate. Cell. 2016;164:1162–1171. doi: 10.1016/j.cell.2016.01.034. - DOI - PMC - PubMed
    1. Frey S, Richter RP, Görlich D. FG-rich repeats of nuclear pore proteins form a three-dimensional meshwork with hydrogel-like properties. Science. 2006;314:815–817. doi: 10.1126/science.1132516. - DOI - PubMed
    1. Rout MP, Aitchison JD, Magnasco MO, Chait BT. Virtual gating and nuclear transport: the hole picture. Trends Cell Biol. 2003;13:622–628. doi: 10.1016/j.tcb.2003.10.007. - DOI - PubMed

Publication types

MeSH terms

Substances