. 2019 Jan 30;10(1):488.
doi: 10.1038/s41467-019-08349-0.

Dual RNA-seq identifies human mucosal immunity protein Mucin-13 as a hallmark of Plasmodium exoerythrocytic infection

Affiliations

Dual RNA-seq identifies human mucosal immunity protein Mucin-13 as a hallmark of Plasmodium exoerythrocytic infection

Gregory M LaMonte et al. Nat Commun. .

Abstract

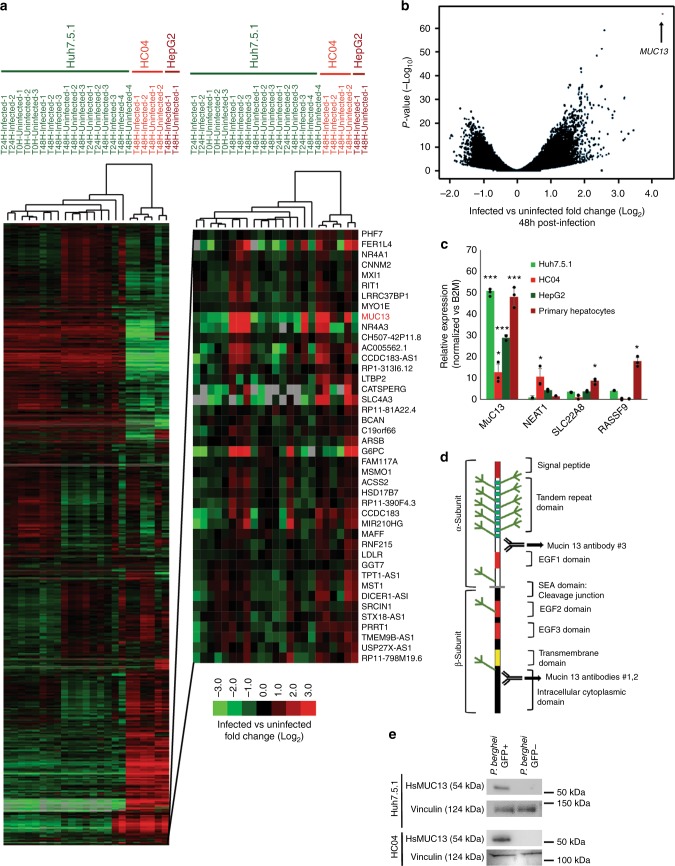
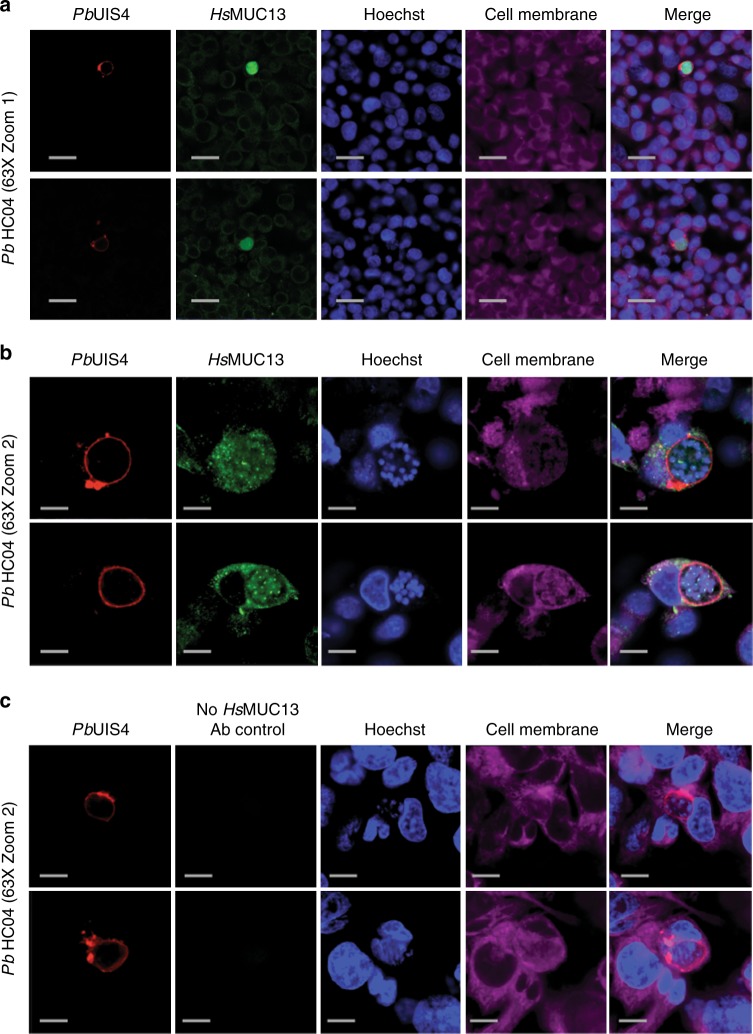
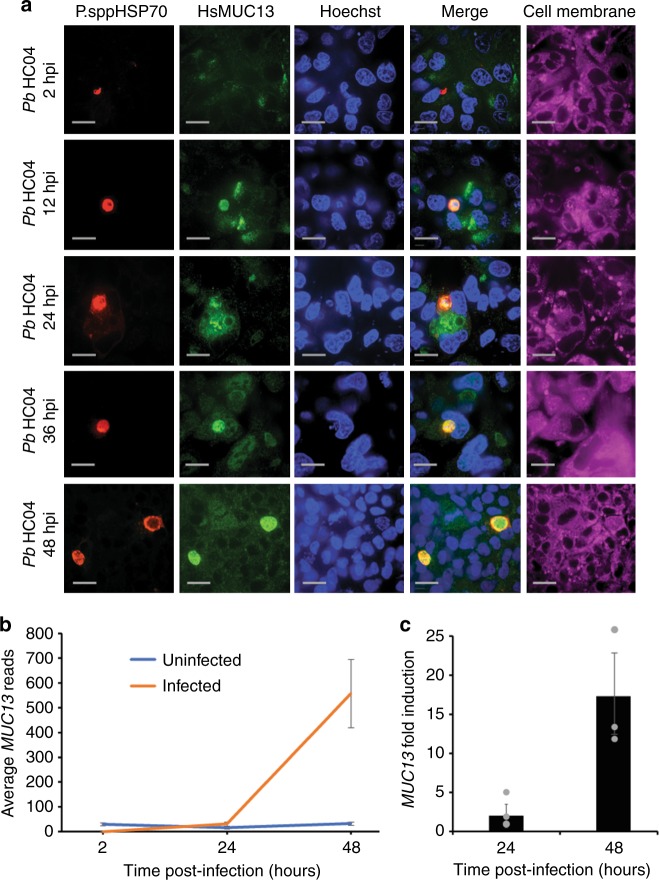
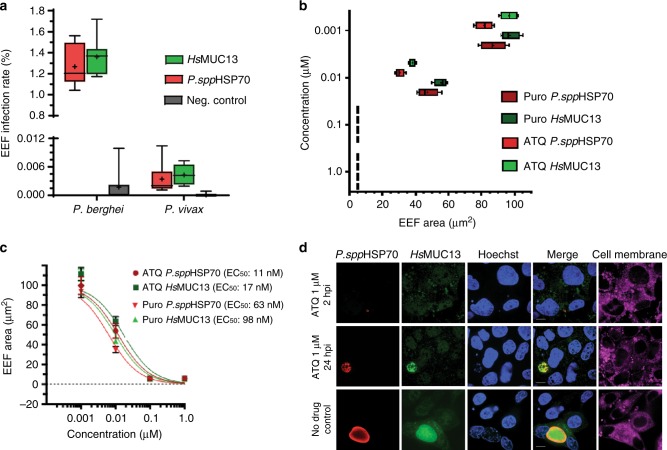
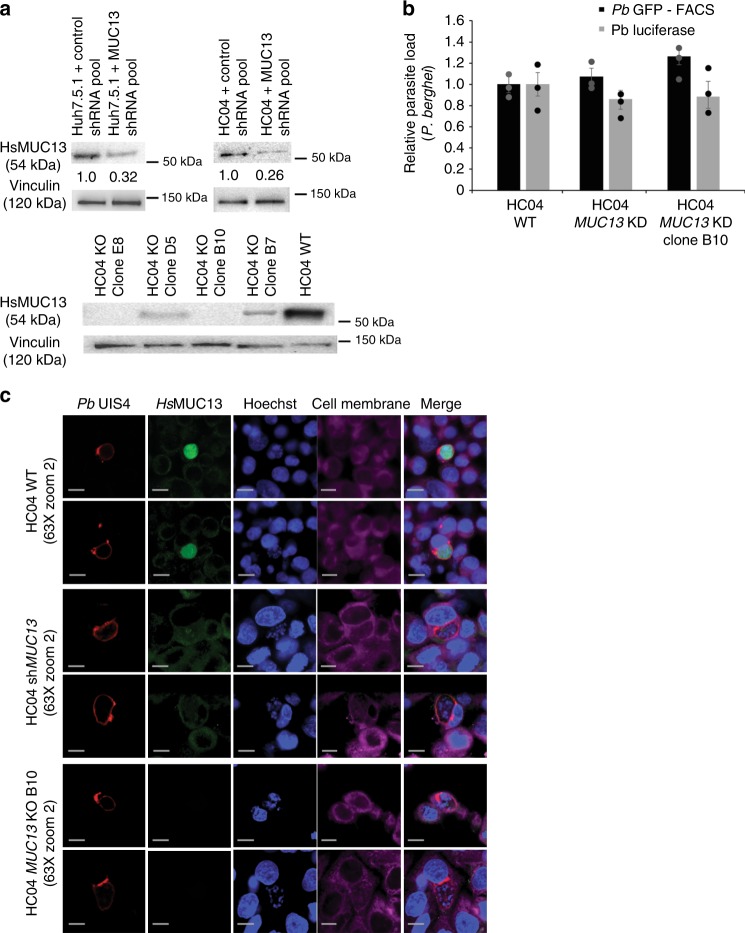
The exoerythrocytic stage of Plasmodium infection is a critical window for prophylactic intervention. Using genome-wide dual RNA sequencing of flow-sorted infected and uninfected hepatoma cells we show that the human mucosal immunity gene, mucin-13 (MUC13), is strongly upregulated during Plasmodium exoerythrocytic hepatic-stage infection. We confirm MUC13 transcript increases in hepatoma cell lines and primary hepatocytes. In immunofluorescence assays, host MUC13 protein expression distinguishes infected cells from adjacent uninfected cells and shows similar colocalization with parasite biomarkers such as UIS4 and HSP70. We further show that localization patterns are species independent, marking both P. berghei and P. vivax infected cells, and that MUC13 can be used to identify compounds that inhibit parasite replication in hepatocytes. This data provides insights into host-parasite interactions in Plasmodium infection, and demonstrates that a component of host mucosal immunity is reprogrammed during the progression of infection.


Conflict of interest statement

The authors declare no competing interests.

Figures

Fig. 1
Fig. 1
Identification of differentially expressed host and parasite transcripts. a Hierarchical clustering of RNAseq samples based on gene-expression patterns in the indicated host hepatocytes and specified times postinfection. The color scale for the figure, as indicated by the scale bar in the lower left corner of Fig. 1a, indicates log2 fold changes from −3 to +3. Data used to generate heatmap is located within Supplementary Data 3. b Volcano plot of gene-expression pattern vs. p value, with the position of MUC13 indicated. c Confirmation of host factor upregulation via qPCR, with relative quantitation of the indicated host transcripts calculated using the ΔΔCT method, in the indicated hepatocyte cell types (data presented as mean ± s.e.m, n = 3 with individual biological replicates overlaid, * = p value < 0.05, *** = p value < 0.001. p values determined by two-tailed t test). d Schematic of MUC13 protein structure and approximate antibody locations. Antibody #1: AbCam #Ab65109, Antibody #2: LifeSpan BioSciences #LS-C345092 (discontinued), and Antibody #3: LifeSpan BioSciences #LS-A8191. e Confirmation of MUC13 upregulation during infection via western blot
Fig. 2
Fig. 2
Expression and localization of MUC13 in Plasmodium infected hepatoma cells. a, b Confocal microscopy images of representative HC04 liver cells infected with Plasmodium parasites 48 hpi at two different magnifications. c Control Confocal microscopy images of representative HC04 liver cells infected with Plasmodium parasites 48 hpi without MUC13 antibody being used. Cells were labeled using a rabbit polyclonal antibody (dilution 1:500, 1 mg/ml stock) against the intracellular region of MUC13 (MUC13 antibody #1—AbCAM #Ab65109) and visualized with a goat anti-rabbit Alexa Fluor 488 (green); CellMask deep red was used for plasma membranes (Cell Membrane—magenta). P. berghei EEFs were labeled using a goat polyclonal (dilution 1:200, 1 mg/ml stock) against PbUIS4 (LS-204260, LifeSpan Biosciences) and visualized with a bovine anti-goat secondary antibody (Alexa Fluor 647, red), respectively. Nuclei were labeled with Hoechst 33342 (blue). Merged images between HsMUC13, UIS4 and Hoechst are shown. Scale bars 50 (zoom 1) or 10 (zoom 2) μm; 63× oil objective
Fig. 3
Fig. 3
Temporal detection of MUC13 in HC04 cells infected with P. berghei. a HC04 cells were infected with P. berghei sporozoites and then fixed and stained at 2, 12, 24, 36, and 48 hpi. Infected cell cultures were stained using a 1:500 dilution (1 mg/ml stock) of mouse polyclonal antibody to P.spp HSP70 (see methods) and a 1:500 dilution of rabbit polyclonal antibody to MUC13 intracellular domain (MUC13 antibody #2—LifeSpan BioSciences #C345092). Primary antibody localization was visualized with goat anti-mouse (Alexa Fluor 647, red) and goat anti-rabbit (Alexa Fluor 488, green) secondary antibodies, respectively. Nuclei were stained with Hoechst 33342 (blue) and cell membranes with CellMask deep red (magenta). Scale bars 10 μm; 60× oil objective. b The total reads, from the Huh7.5.1 RNA seq samples 1–3, for MUC13 at the 5 indicated time points (0 h uninfected, 24 h infected, 24 h uninfected, 48 h infected, and 48 h uninfected). c The fold-induction of MUC13, based upon the total read count in panel B, at 24 and 48 hpi, presented as a ratio of Infected:Uninfected. Data presented as mean ± s.e.m, n = 3 with individual biological replicates overlaid
Fig. 4
Fig. 4
MUC13 as a quantitative biomarker of Plasmodium EEF infection. a Counts of P. berghei or P. vivax EEF in HC04 cells by indirect immunofluorescence. Negative controls with no primary antibodies were included. Parasite burden was estimated by counting at least 240,000 cells, via high content imaging. Data (n = 3) presented with the mean indicated by a “+” and error bars indicating the 5–95% confidence interval. b Effect of atovaquone (ATQ) and puromycin (PURO) treatment (2 hpi) on cell area (growth) of P. berghei EEF in HC04 at 48 hpi. Data (n = 4) presented with the mean indicated by a “+” and error bars indicating the 5–95% confidence interval. c Dose–response curves of P. berghei EEF in HC04 cells for atovaquone (ATQ) and puromycin (PURO). 95% confidence interval for EC50s = ATQ P. spp HSP70, 8.98–15.82; ATQ HsMUC13, 11.18–26.05; PURO HsMUC13, 6.29–15.29; PURO P. spp HSP70, 5.01–7.92. Data presented as mean ± SD, n = 2 with 5–95% confidence intervals indicated. d Representative images of P. berghei EEF in HC04 cells (48 hpi) treated (2 hpi) with 1 μM of atovaquone, puromycin, or DMSO. P. berghei was labeled with P. ssp HSP70 mouse polyclonal antibody (dilution 1:500, 1 mg/ml stock). HC04 cells were labeled with a rabbit polyclonal antibody (dilution 1:500, 1 mg/ml stock) recognizing the intracellular region of HsMUC13 (MUC13 antibody #2—LifeSpan BioSciences #LS-C345092). Primary antibody detection was performed with goat anti-mouse (Alexa Fluor 647, red) and goat anti-rabbit (Alexa Fluor 488, green) antibodies. Nuclei and cell membranes were stained with Hoechst 33342 (blue) and CellMask deep red (magenta), respectively. Scale bar 10 μm; 100× oil
Fig. 5
Fig. 5
Confirmation of antibody specificity in regards to HsMUC13’s localization within P. berghei during liver-stage infection. a Confirmation of both MUC13 knockdown, in cells expressing a pool of four anti-mucin13 shRNAs which have been integrated into the hepatocyte genome, and MUC13 knockout, via CRISPR/Cas9, during infection via western blot. Values indicated are relative protein expression as determined by densitometry. b Effect of MUC13 knockdown and knockout in the indicated cells infected with P. berghei expressing either luciferase (measured via total luminescence) or GFP (measured by FACS). Data is presented as mean ± s.e.m with n = 3 with individual biological replicates overlaid. c Confocal microscopy images of HC04 liver cells, either unmodified (WT), expressing an shRNA pool for MUC13 (KD) or with MUC13 knocked out (KO clone B10), infected with P. berghei 48 hpi. Cells were labeled with a rabbit polyclonal antibody (dilution 1:500, 1 mg/ml stock) against the intracellular domain of HsMUC13 (MUC13 antibody #1 AbCam #Ab65109). P. berghei was detected using a UIS4 antibody (1:500 dilution, 1 mg/ml stock LS-204260, LifeSpan Biosciences). Primary antibodies were detected with a goat anti-rabbit (Alexa Fluor 488, green) and a goat anti-mouse (Alexa Fluor 647, red). Cell membranes and nuclei were stained with Hoechst 33342 (blue) and CellMask deep red (magenta), respectively. Merged images between HsMUC13, P. spp HSP70, and Hoechst shown. Scale bars 10 μm; 63× oil objective

References

    1. W.H.O. World Malaria Report: 2016 (2017).
    1. Sturm A, et al. Manipulation of host hepatocytes by the malaria parasite for delivery into liver sinusoids. Science. 2006;313:1287–1290. doi: 10.1126/science.1129720. - DOI - PubMed
    1. Olotu A, et al. Seven-year efficacy of RTS, S/AS01 malaria vaccine among young African children. New Engl. J. Med. 2016;374:2519–2529. doi: 10.1056/NEJMoa1515257. - DOI - PMC - PubMed
    1. Burrows JN, van Huijsduijnen RH, Mohrle JJ, Oeuvray C, Wells TN. Designing the next generation of medicines for malaria control and eradication. Malar. J. 2013;12:187. doi: 10.1186/1475-2875-12-187. - DOI - PMC - PubMed
    1. Melo MB, et al. Transcriptional analysis of murine macrophages infected with different Toxoplasma strains identifies novel regulation of host signaling pathways. PLoS Pathog. 2013;9:e1003779. doi: 10.1371/journal.ppat.1003779. - DOI - PMC - PubMed

Publication types